Viewing and evaluating data
Real-time and recent data can be viewed in the software dashboard, including CO2 and H2O measurements, wind speed measurements, and computed fluxes. Recent Biomet data can be checked under the Biomet > Data tab.
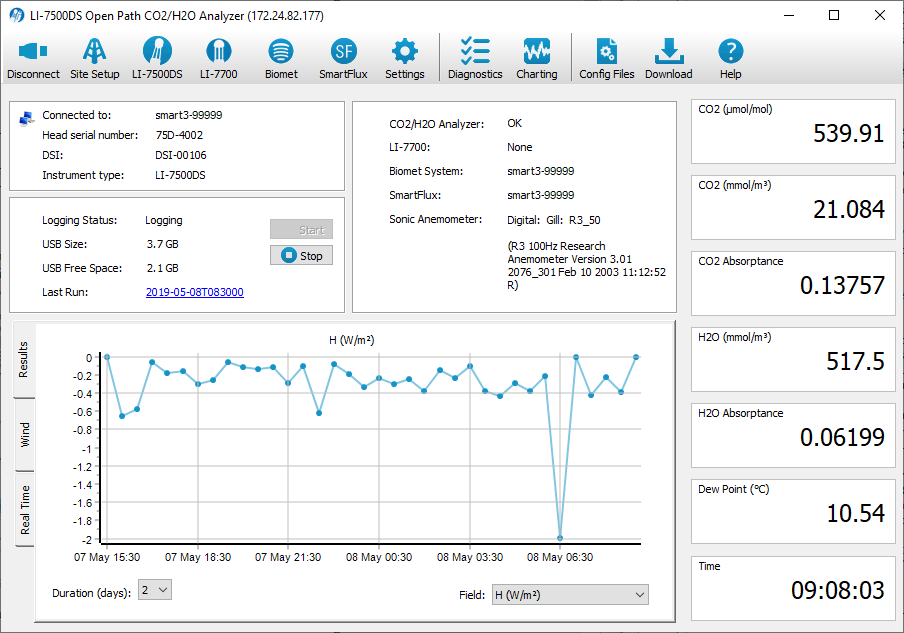
See Support: LI-7500DS and SmartFlux® 3 System for details.
Logged data files
The SmartFlux 2 and 3 System records raw data and processed flux results to its USB drive. To retrieve the data, you can download it directly to a computer or you can eject the USB drive and copy files from it. We recommend downloading data directly so that you do not have to eject the USB drive. The basic set of folders on the USB drive are given in Table 6‑1.
The Raw data folder
The raw data are compressed in a folder with a .ghg file extension. You can unzip the file to view the contents. You may need to change the extension from .ghg to .zip before unzipping the file. It includes high speed gas and wind measurements in a file with a .data extension, as well as site information in a file with a .metadata extension. The file may also include biomet data and biomet metadata if the system was equipped with a biomet system. Depending on the variables selected when configuring the system (see Selecting CO2/H2O log variables), you may find some or all of the variables in Table 6‑2 in the data file. Typically, the file will include a smaller subset of variables.
| Variable | Description |
|---|---|
| Time | Time in HH:MM:SS:MS |
| Date | Date in YY:MM:DD |
| Sequence Number1 | Index value, increments every 3.3 ms (1/300s) |
| CO2 (mmol/m3) | CO2 molar density |
| CO2 (mg/m3) | CO2 mass density |
| CO2 Absorptance | CO2 raw absorptance value |
| CO2 (µmol/mol) | CO2 mole fraction |
| H2O (mmol/m3) | H2O concentration density |
| H2O (g/m3) | H2O mass density |
| H2O Absorptance | H2O raw absorptance value |
| H2O (mmol/mol) | H2O mole fraction |
| Dew Point (°C) | Dew point temperature (°C) |
| Temperature (°C) | Air temperature |
| Box Pressure (kPa) | Pressure measured at the DSI box |
| Cooler Voltage (v) | Detector cooler voltage |
| Chopper Cooler Voltage (V) | Chopper cooler voltage |
| SmartFlux Vin (v) | Voltage in |
| Diagnostic Value | Diagnostic value 0-8191 |
| Diagnostic Value 2 | Diagnostic value 0 or 1 (sync clocks)2 |
| CO2 Signal Strength | CO2 Signal Strength (Sc) |
| H2O Signal Strength | H2O Signal Strength (Sw) |
| Average Signal Strength | (Sc + Sw)/2 |
| Delta Signal Strength | Sc - Sw |
| Integral | Integration result (area under curve) |
| Peak Height | Integration peak height |
| CO2 Sample | Floating point value, power received from source in absorbing wavelength for CO2 |
| CO2 Reference | Floating point value, power received from source in reference (non-absorbing) wavelength for CO2 |
| H2O Sample | Floating point value, power received from source in absorbing wavelength for H2O |
| H2O Reference | Floating point value, power received from source in reference (non-absorbing) wavelength for H2O |
| CH4 Seconds | Time from the LI-7700 |
| CH4 Nanoseconds | Time from the LI-7700 |
| CH4 (µmol/mol) | CH4 mole fraction (LI-7700 required) |
| CH4 (mmol/m3) | CH4 molar density (LI-7700 required) |
| CH4 Signal Strength (RSSI) | RSSI value measured by the LI-7700 |
| CH4 Diagnostic Value | Diagnostic value output by the LI-7700 |
| U3 | Horizontal wind speed (m/s) as measured toward the direction in line with the north spar |
| V | Horizontal wind speed (m/s) as measured toward the direction of 90° counterclockwise from the north spar |
| W | Vertical wind speed (m/s) as measured up the mounting shaft |
| TS | Sonic temperature |
| SOS | Speed of sound |
| AnemDiag | Diagnostic value output by the anemometer |
The Results folder
These are the output files from EddyPro. They follow a format typical of EddyPro outputs, as described in detail in the EddyPro help.
The Summaries folder
The EddyPro summaries, typically named something like YYYY-MM-DD_EP-Summary, include the half-hour eddy covariance flux results. These files are created and stored every 30 minutes. The variables included in this file are specified in EddyPro automatically if you select Basic processing or manually if you select Advanced processing.
The DAqM folder
If the system includes a biomet data acquisition system, the daily biomet data are summarized in this folder.
The Images folder
If the system is equipped with a StarDot PhenoCam, one image per day is stored in this folder. Images are typically about 3 MB each (per day), depending on the camera configuration.
The ICOS CSV folder
Summaries that are to meet the specifications of ICOS. This file may not be visible on the device itself, but will be created when files are pushed to a repository, where you can select it.
Automatic file management
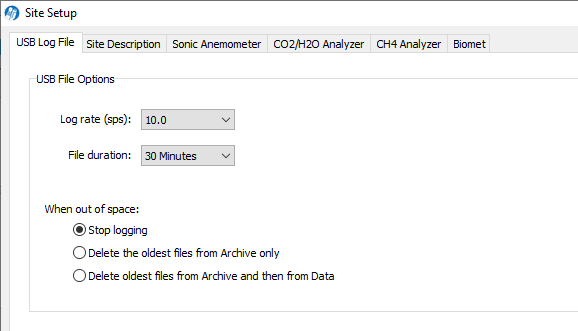
The USB drive has limited space, and with continuous data logging, it will get full if files are not removed from it periodically. You have some options for manual and automatic file management when the USB drive gets full. The system will always maintain 10% of space on the drive as free space.
When the USB drive has <10% of space remaining, the SmartFlux System will either Stop logging, Delete the oldest files from the Archive only, or Delete oldest files from Archive and then from Data, depending upon the setting selected. Priorities for automatic file deletion are given in Table 6‑3. If you store other files on the USB drive, the space available for data files will be reduced.
Copying data files from USB storage
Files can be managed using the Download utility in the gas analyzer PC software or a Secure File Transfer Protocol (SFTP) application.
Using the Download utility
The Download utility allows you download and delete files that are stored on the USB device in the SmartFlux System. You can access the files remotely, so long as you can connect to your instrument over a network. The utility is a component of the gas analyzer software. Click the Download button to launch it.
![]()
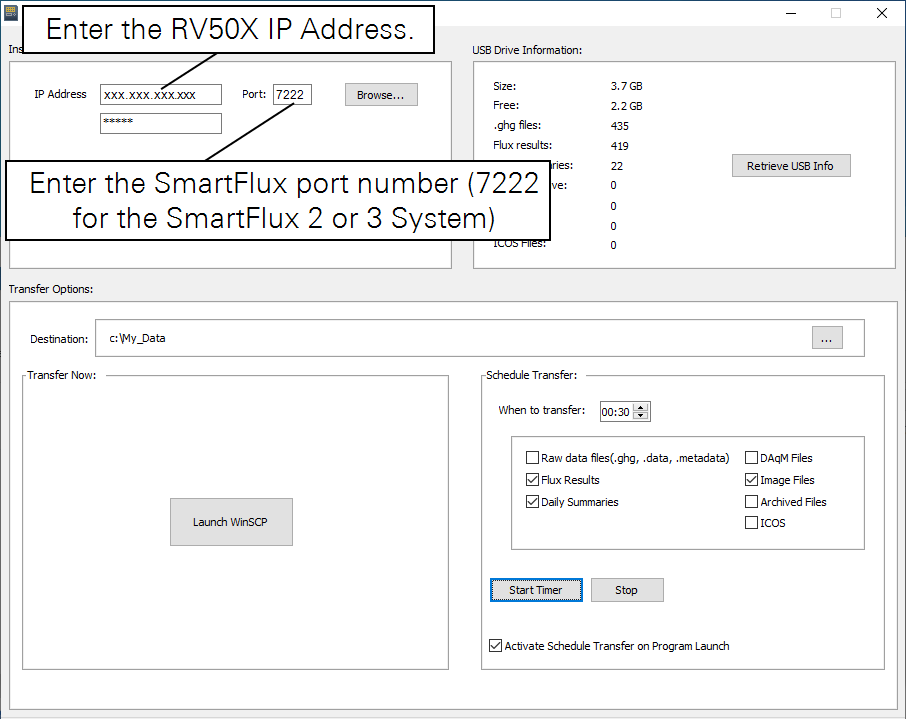
The application should automatically connect to the instrument, but if it doesn't, click Browse to view a list of instruments on the network. Select the instrument, click OK, enter the password (licor) and click Verify Connection. You may need to set the port if you are connecting with a cellular or satellite gateway. If your instrument is not listed, type the IP address into the IP Address field. If you are using a RV50X, set the Port to the same number that you have opened in the RV50X software.
USB Drive Information displays the size of the USB drive, available memory, number of each type of file.
Transfer Options are used to configure settings and other features:
- Transfer Now will allow you to use WinSCP to transfer files. WinSCP is a free file transfer application that can be installed as part of the win-GHG application. Click Launch WinSCP to open the application.
- Destination: This is where the transferred files will be saved. Ideally, this will be a directory on your computer. If you are transferring files to a server or cloud-based service such as a Dropbox, this is configured in the SmartFlux section of the application.
- Schedule Transfer: This section allow you to configure automatic file downloads to a computer.
- When to transfer: You can Transfer files daily at a scheduled time.
- You can close the application to your system tray (close it, but choose No) so it continues running in the background. Also be sure your computer does not go to sleep before the scheduled transfer. You may need to re-start the automatic download service if your computer is shut down and re-started.
- Files to transfer: Select any or all file types to transfer data files (you must select a file type before files are displayed). When you check a box, a corresponding tab is added to the box on the right. Here you can choose to download specific files or all of them.
- After configuring the transfer and selecting files, click Start Timer and allow the application to run in the background so it can download files as scheduled.
Tips for the Scheduled Download utility:
- If the downloader is already running, open it from your system "tray" rather than starting another instance of it.
- Set the download to begin at 00:15 (12:15 am) if you are using the SmartFlux System. That way all the logged files for the previous day will be processed before the download begins.
- Close the application to your system tray to keep it running in the background. Be sure the computer that runs the application is on and not in power saver mode.

Using an SFTP application
You can also use third-party file transfer (SFTP) applications to transfer data, such as WinSCP or another application. In this case, connect using the instrument IP address and the following settings:
- Port: 22 or 2200 if you have forwarded port 22 to port 2200.
- Username: licor
- Password: licor
You will see all of the files in the file system. The files of interest are in a data folder.
Viewing raw logged data
To view raw data, copy raw data files from the SmartFlux System in one of two ways: connect the EC system to your computer or network and download the data using the gas analyzer PC application software, or eject the USB storage device from the SmartFlux System and connect it to your computer to read the data.
In the LI-7x00 File Viewer
The File Viewer application (fv7x00-1.x.x-install.exe) is included with the gas analyzer software. If you didn't install with your gas analyzer application software, you can download it at https://licor.app.boxenterprise.net/s/c9pqypt9nhuwcu2oaajmcsudfsnp689m. To view data:

- Launch the LI-7x00 File Viewer application and open the .ghg file.
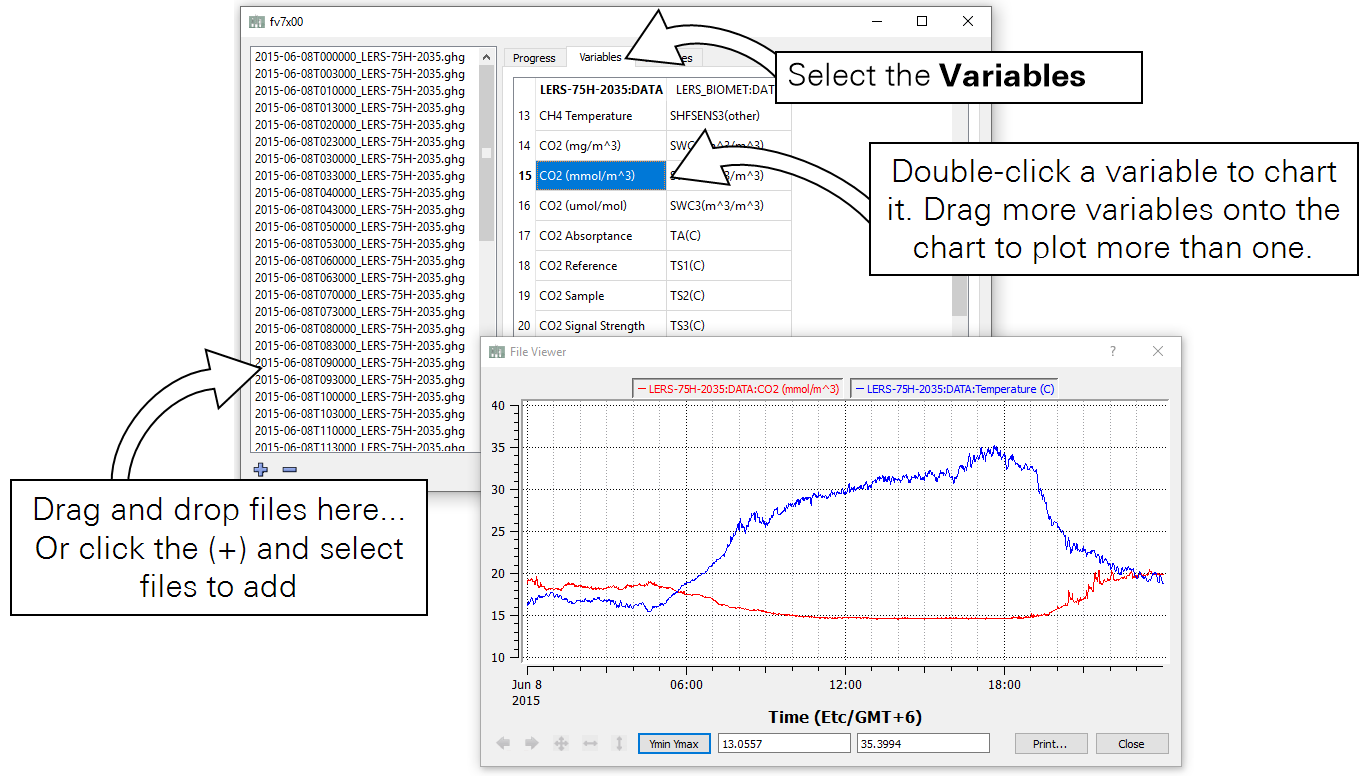
- Drag files into the File Viewer interface or click the plus button (+) and select the files to open. You can load one or many files. They'll be in the order of the time stamps. When a file is open, you'll see a list of variables under the Variables tab on the right.
- View one or more variables.
- Double-click any variable to see a chart of the time-series. Drag any other variable onto the chart to view multiple variables. Use the zoom controls to examine the data in more detail.
The file viewer also provides options to export the dataset, which you can use at your discretion.
In a text editor
To see text data, you can extract the data files from the compressed eddy covariance data.
- Copy the file of interest.
- Copy the files before modifying them so that you are not altering the original data. If you alter the original data, EddyPro may be unable to process it.
- Change the .ghg file extension to .zip.
- For example, the file name 2018-05-05T003000_AIU-0288.ghg should be changed to 2018-05-05T003000_AIU-0288.zip.
- Extract the contents of the zipped file.
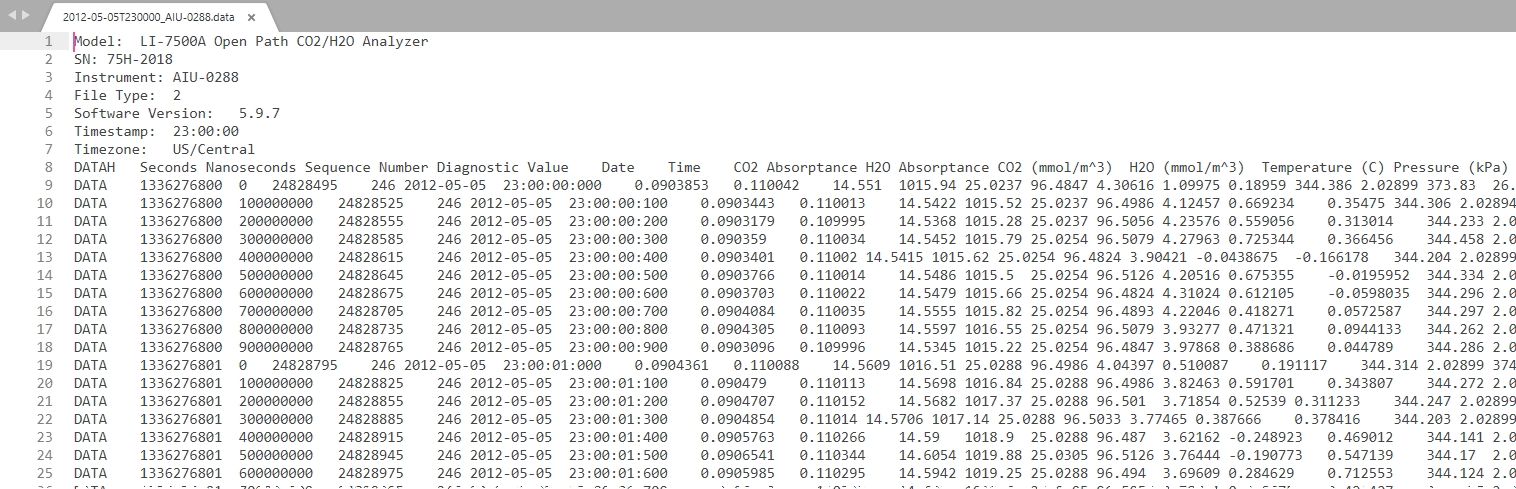
- Data are stored in a file with a name like 2018-05-05T003000_AIU-0288.data. The file contains a file header, data header, and data. The file header describes the system that collected the data. The data header identifies the variable and units. The data (typically 0.1-second or 0.05-second records, depending upon instrument settings) are in tab-delimited columns. A second file, with a name like 2018-05-05T003000_AIU-02880.metadata, includes information about the site and instrument setup. You can open either of these files in a text editor or spreadsheet.
Although you can read the raw data and use it, we don't recommend working with the .ghg files outside of EddyPro Software. EddyPro will summarize and average the biomet data.
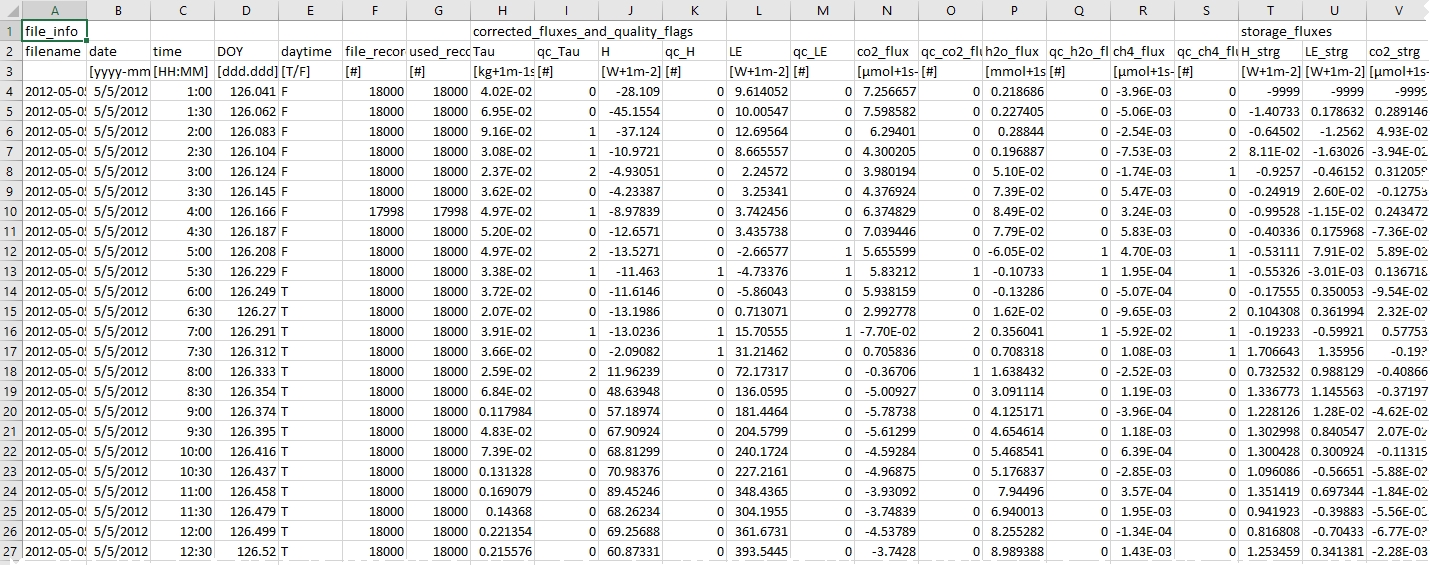
Viewing processed data from the EddyPro output
Logged biomet data are processed by EddyPro, and in a typical eddy covariance system, these data will be recorded as 30 minute averages with flux data. The EddyPro output files include a file called something like eddypro_Demo_full-output_2018-05-05T143614_adv.csv. Data are stored as comma separated values (.csv) in a text file that can be opened in a spreadsheet or text editor. The header displays the variable label and position code, as well as the variable units.
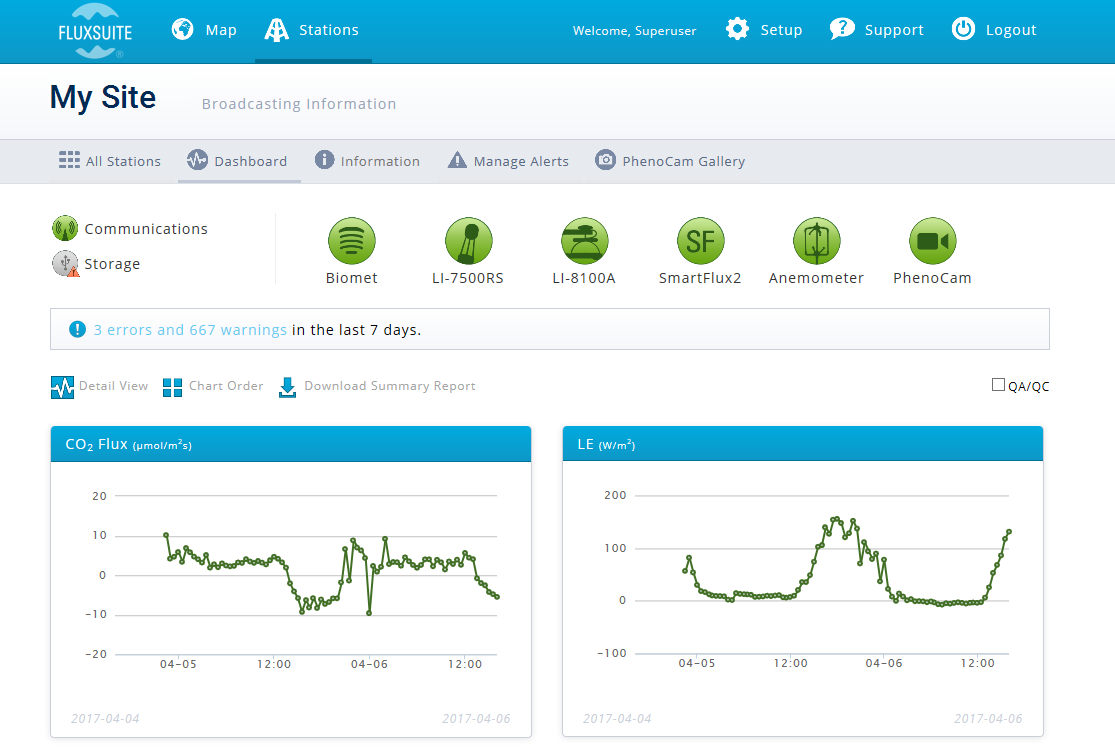
Viewing data in FluxSuite Software
FluxSuite Software (fluxsuite.com) is a cloud-based application that provides near real-time access to site status information, processed flux results, biomet data, and images taken with a PhenoCam. Contact LI-COR or your distributor for more information.
![]()
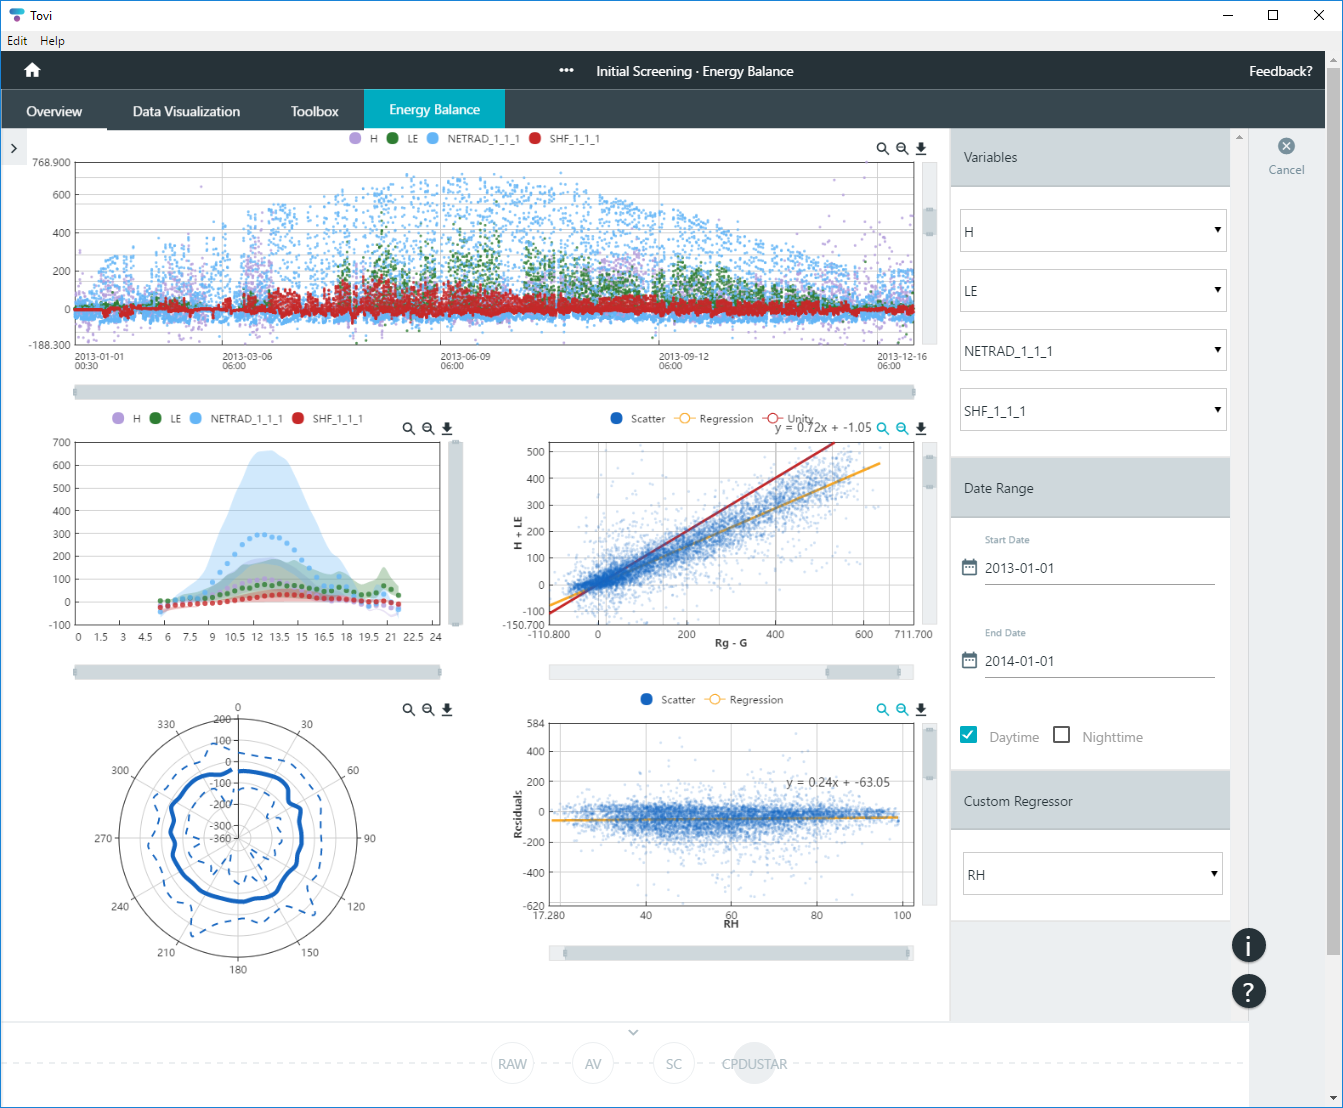
Evaluating long-term data in Tovi® Software
Tovi Software provides tools to evaluate and process the fluxes and biomet data that have been processed by EddyPro. For example, you can average redundant measurements, merge variables and gap fill with data from your site, gap fill with data from nearby weather stations, evaluate the quality of data, and use the biomet data to interpret flux results. Tovi is designed to evaluate lengthy time-series eddy covariance data sets.