Software overview
This section provides descriptions of the relevant software features that you'll use with the LI-7500DS analyzer.
Dashboard
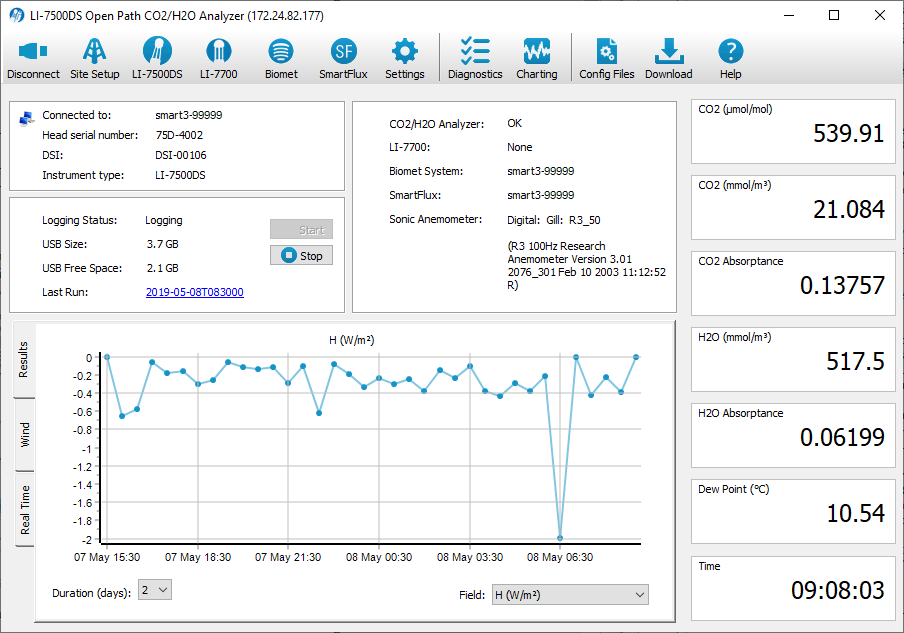
The dashboard provides status and diagnostic indicators, live data values, and graphs of flux results. In addition, it is used to configure the gas analysis settings, set eddy covariance parameters, connect with an LI-7700, connect with a biomet system, and connect with the SmartFlux System.
Instrument information and data logging status
Information about the CO2/H2O gas analyzer is presented in this pane.
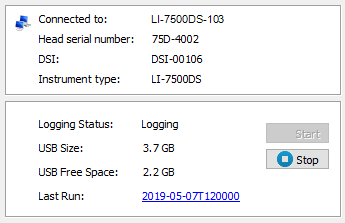
- Connected to: Indicates the network name of the gas analyzer.
- Head serial number: Serial number of the CO2/H2O analyzer sensor head.
- Instrument type: Indicates the model of the CO2/H2O analyzer.
- Logging Status: Indicates Logging or Not logging.
- USB Size: Total storage capacity of the USB drive on the SmartFlux System.
- USB Free Space: Available space on the USB drive.
- Last Run: Last half-hour flux processing run by Eddypro® inside the SmartFlux System. Gives the most recent date and time when data collection began with a link to download the results (if you are connected directly to the device).
- Start button: Starts logging.
- Stop button: Stops logging.
Instrument performance and connection status
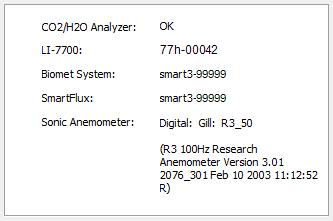
Instrument status information is presented in the status pane.
Note: The warning symbol ( ) indicates that the component is in need of attention or that it is not communicating properly.
- CO2/H2O Analyzer: Indicates the status of the CO2/H2O gas analyzer.
- LI-7700: Indicates the status of the LI-7700 Open Path CH4 Analyzer (optional).
- None: LI-7700 not connected.
- Name of LI-7700: Connected.
- Biomet System: Indicates the status of the Biomet Station, if installed.
- None: Biomet not connected.
- Name of Biomet System: Connected.
- SmartFlux: Indicates the serial number of the SmartFlux System. A warning symbol (
 ) indicates waiting to connect or that the system has become disconnected.
 - Sonic Anemometer: Indicates the status of the sonic anemometer.
- None: Sonic anemometer not connected or not present.
- Name of the sonic anemometer: Connected.
Graphs
Click on one of the three tabs on the left side of the graphing pane. The Real Time tab provides real-time graphing of measured variables. The Results tab displays eddy covariance flux results from the SmartFlux System. The Wind tab displays a graph of wind speeds by direction.
- Real Time: Current data measured by the instrument. Click the
 button to open the charting.
Note: It may take several minutes after you select a tab for data to load into the graph.
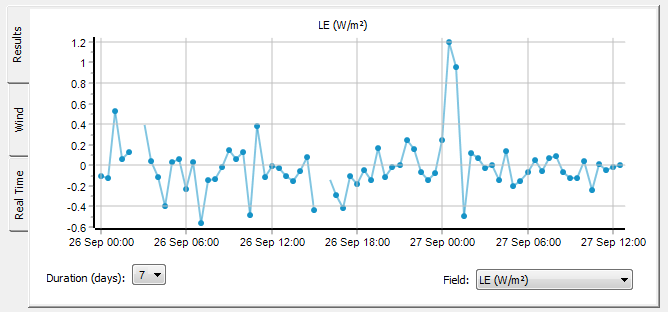
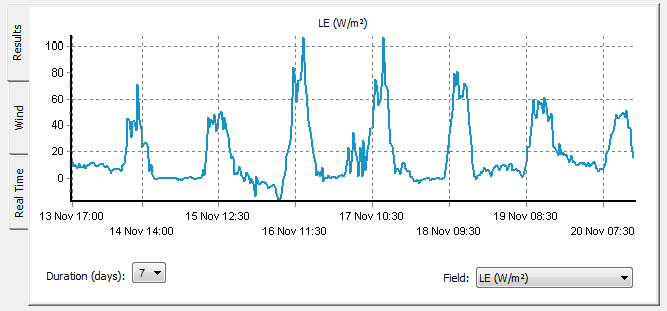
- Results: Presents fully processed flux results (SmartFlux System required) for the variables that are measured at the site. Duration sets how many days of data are displayed (maximum of 7 days). Field sets the flux variable that is displayed. The variables available are:
- H (W/m2),
- LE (W/m2),
- ET (mm/h),
- CO2 Flux (µmol/m2/s),
- CH4 Flux (µmol/m2/s; LI-7700 required),
- u* (m/s),
- CO2 (µmol/mol),
- H2O (mmol/mol),
- CH4 (µmol/mol; LI-7700 required).
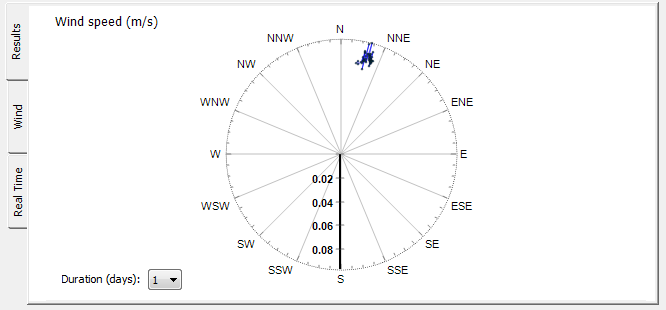
- Wind speed: Presents mean wind speed by direction. Duration sets how many days of data are displayed.
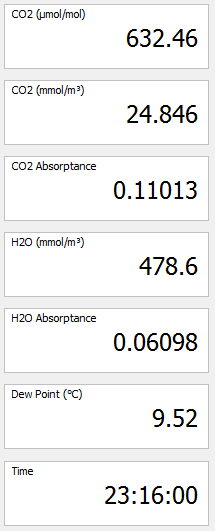
Data display
Measured variables are displayed on the right of the dashboard. To change a variable displayed click directly on a data value and select a new item from the Data Items menu.
The variables available for display are given in Table 6‑2.