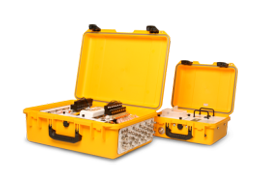
The LI-8100A is an automated soil flux measurement system that can be used to measure soil fluxes with varying rates of emission. While typical measurements are made on flux rates that range from 0.5 to 10 µmol CO2 m-2 s-1, the LI-8100A can be used to measure much higher fluxes with a small modification as discussed in Technical Note #136, or much lower flux rates with appropriate setup. There are different ways to characterize low flux detecting limit of measurements with the instrument. This article discusses how to estimate the limits of detection of the LI-8100A with a specific setup using a ‘zero’ flux measurement.
Limit of detection (LOD) of a measurement is defined as the smallest measure that can be detected with a given confidence level for a given procedure (IUPAC). In mathematical terms it is expressed as
1XLOD = xb + k × sb
where XLOD is the limit of detection for the measurement, xb is the mean of the blank measurements (‘zero’ flux), k is a numerical factor chosen according to the confidence level and sb is the standard deviation of the blank measurements. The LOD is typically calculated with k = 3 to give the confidence interval of 99.7%. Therefore, if repeated blank measurements are made with the LI-8100A, the LOD can be computed as the mean of such measurements plus three times the standard deviation of the blank measurements.
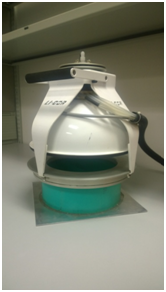
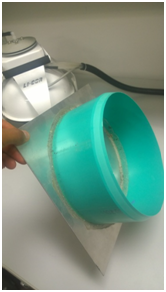
For the test, an LI-8100A with a 20-cm survey chamber (8100-103) was used to measure soil CO2 flux from a bottom sealed soil collar. The sealed soil collar represents a blank (‘zero’ flux) measurement (see pictures below). Each measurement was 5 minutes long, and a deadband (time to allow for mixing) was set to 20 seconds. The measurement was repeated 30 times with a 5 minute break between measurements.
The LI-8100A computes the flux rates for each individual measurement automatically and reports them in a file. The file was analyzed using the LI-8100A File Viewer (FV8100). The fluxes were recomputed using the Recompute functionality of FV8100. We changed the flux value display setting on the FV8100 software using the Preference dialog to include six digits after the decimal instead of the default two digits. After screening out two observations the statistics on 28 observations were computed using the FV8100. The mean value for the 28 blank measurements was 0.001264 µmol m-2 s-1 and the standard deviation was 0.002883 µmol m-2 s-1. According to the equation described above, the limit of detection of the current setup (LI-8100A with the 20 cm chamber and measurement time of 5 minutes with a dead band of 20 seconds) is 0.009913 µmol m-2 s-1 or approximately 0.01 µmol m-2 s-1 with a confidence interval of 99.7%. Similar tests can be performed for any specific setup that may contain a different chamber, a different IRGA averaging setting or measurement period.