Charting Window
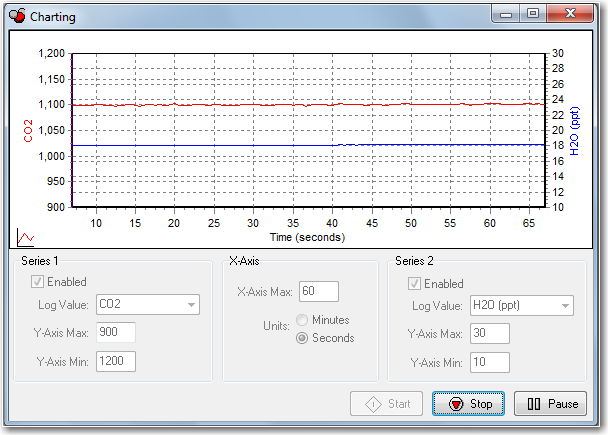
Select Charting from the View menu to open the Charting window (below). This is the window in which you can set up the parameters for plotting your data. Two charts can be plotted simultaneously, using Y axes on either side of the chart.
Series 1
The Series 1 options are used to plot a chart with the Y axis on the left side of the chart. Choose the value to be logged and set the maximum and minimum values for the Y axis.
Series 2
The Series 2 options are used to plot a chart with the Y axis on the right side of the chart. Choose the value to be logged and set the maximum and minimum values for the Y axis.
X-Axis Max
Sets the maximum value for the X axis (Time). The units for the X axis can be seconds or minutes.
Press Start at any time to view the chart layout and begin displaying data. Note that you must press Stop to make changes to the chart parameters, and then press Start again to resume data display.
Diagnostic Window
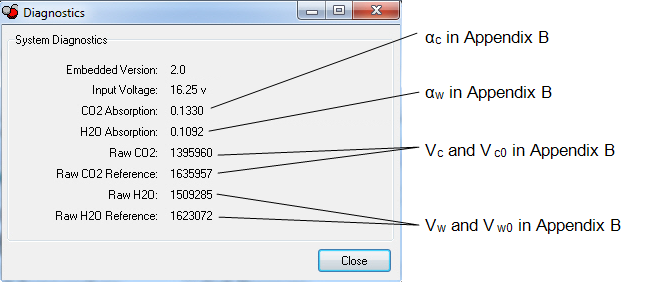
Select Diagnostics from the View menu to open the Diagnostics window (below). This window displays the current LI‑840A internal software version number, the input voltage, and raw absorption values.
Logging Data
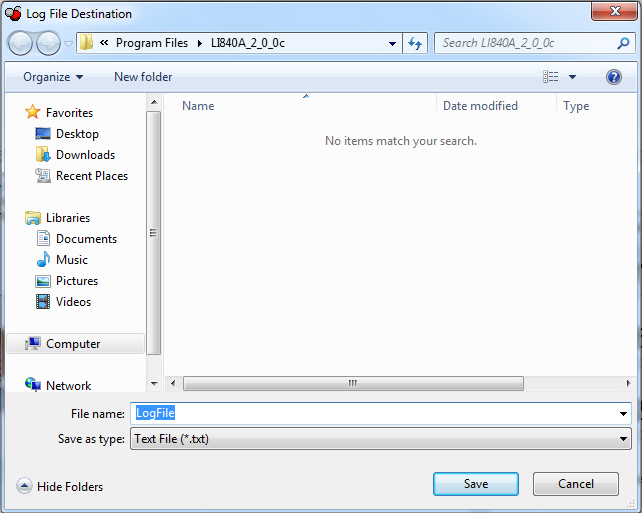
Start Logging
Opens the Log File Destination dialog, where you enter a file name for the data file. The file extension .txt is added automatically.
Stop Logging
Stops data logging.
Pause Logging
Pauses logging of data until Start is chosen from the Logging menu again, or the Start button on the toolbar is pressed.
Options
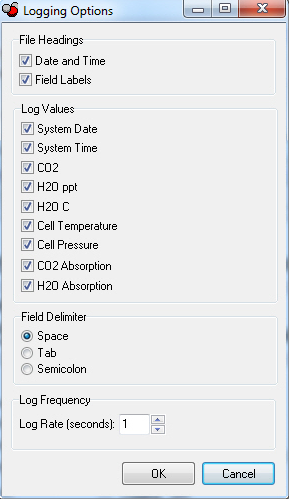
Opens the Logging Options window, where you can configure the data output options.
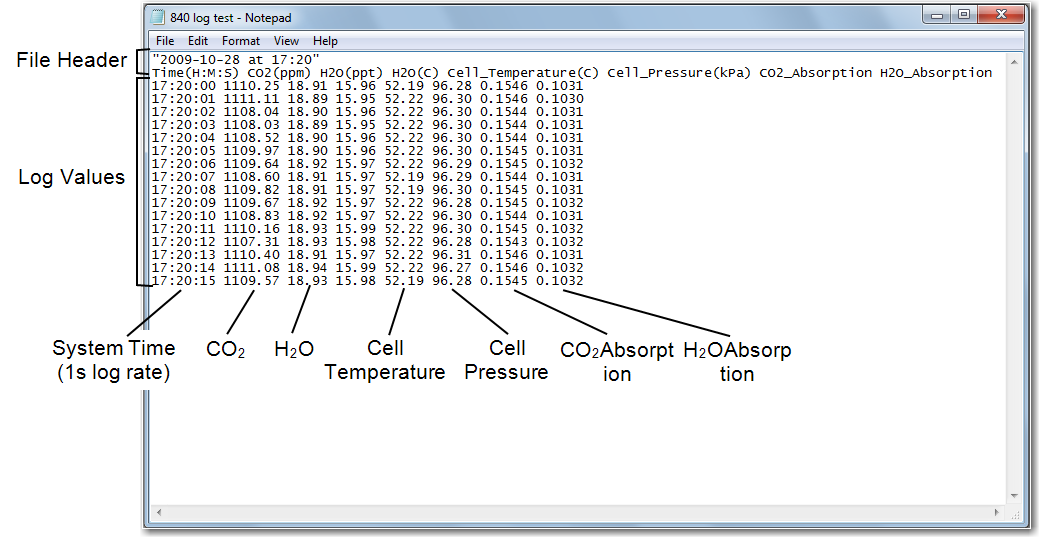
As configured above, the data output would appear similar to that shown below.