The following section briefly covers the basic steps you might follow to set up the LI-840A to collect and record data. Many of these steps are described in greater detail throughout this manual.
- Install the PC Communications Software.
- This software is used to set the zero and span of the LI-840A and set up data communication and data transfer parameters for viewing and logging data. Installation instructions can be found in Installing the PC Communication Software on Your Computer.
- Determine your jumper settings for high and low alarm output, if required.
- There are 2 jumpers inside the LI-840A case (on the main circuit board), which toggle the high and low alarm output between 0-5V (TTL levels) and an open drain condition. The default jumper positions are set for 0-5V output for both high and low alarms. This alarm configuration is suitable for logic devices such as dataloggers. To use the high and/or low alarms to operate a relay switch, the jumpers should be reconfigured for open drain output. See Alarms, for a description of how to change the alarm jumper settings.
- If the default jumper positions are suitable for your application, or if you do not intend to use the alarms, proceed to Step 3.
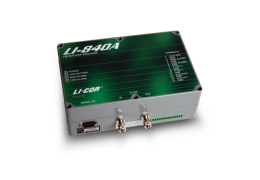
- Connect a power source to the LI-840A
- The LI-840A requires an input voltage of 12-30 VDC. The power supply must be able to source a maximum current drain of 1.2A (at 12 VDC). After the instrument has warmed up it will draw about 0.3A (at 12 VDC) with the heaters on.
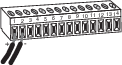
- Bare wire leads are connected to the terminal strip at positions 1 and 2. Connect the positive lead (usually red) to position #1 (12-30VDC), and the negative lead to position #2 (GND).
- NOTE: Pull straight out on the face of the terminal strip to remove it; this can make it easier to connect the wires.
- Connect the RS-232 cable.
- Connect one end of the serial cable to the 9-pin Serial I/O port on the LI-840A front panel, and the other end to a serial port on your computer. If you want to interface to a device with a 25-pin serial port, a 9-pin to 25-pin adapter must be used; a gender changer may be required in some cases. Tighten the two screws on the ends of the serial cable.
- Connect other output device(s) if desired.
- Output devices such as dataloggers and relay switches for high and low alarms are connected via the terminal strip. A complete description of the terminals can be found in Section 3, Using the Terminal Strip.
- Connect an air pump and external power source.
- The LI-840A sample cell must be continually flushed while making measurements, which requires an external air pump that supplies a flow rate of between 0.25 and 1.0 liters per minute. LI-COR offers a Diaphragm Pump under part number 286-04198 that is suitable for use with the LI-840A. One pump plumbing option is shown below.
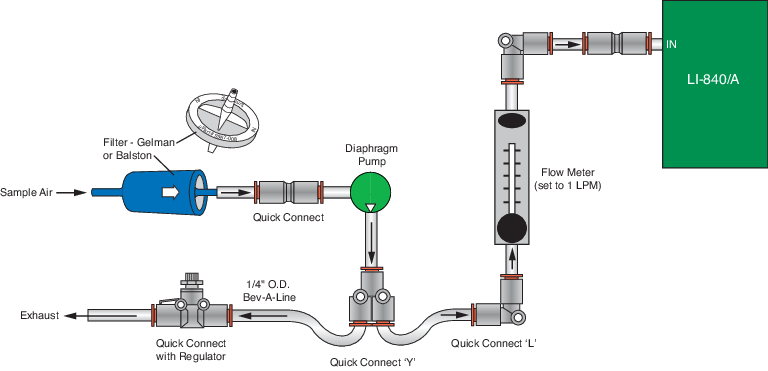

- NOTE: More information about plumbing options and parts available from LI-COR can be found in an application note, which can be viewed here.
- Connect the input air stream and external filter.
- Remove the nut from the FLOW IN fitting and conect a short (12" or so) piece of Bev-a-line tubing (from the spares kit) . Tighten the nut. Place a Geman filter (also from the spares kit) in the sample airstream before it enters the FLOW IN port on the LI-840A. A user-supplied pump is required to force air through the LI-840A.
- IMPORTANT: Always install the external air filter before operating the LI-840A. Insert filter into the input airstream before it enters the LI-840A. Failure to do this will lead to contamination of the optical path.
 When using the LI-840A for applications where sample air is particularly dirty, you may consider stacking two filters in series. For maintenance, replace the filter furthest upstream from the analyzer with the filter closest to the analyzer and replace the filter closest to the analyzer with a new filter.
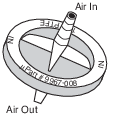
- Install the new filter(s) with the blue lettering facing away from the FLOW IN port.
- The air inlet and outlet ports should be covered with the dust caps provided or attached to an air line when the instrument is not in use. This will prevent dust from entering the instrument downstream from the filters where it can enter the optical path.
- Replacement Gelman Acro 50 filters can be obtained from LI-COR (part #9967-008).
- Start the PC Communications Software.
- Click on the program icon to start the application. The Main window appears. Select Connect from the File menu. Choose the serial port to which the LI-840A is connected, and the data output interval. Click the Connect button. If the analyzer is connected properly, data will appear in the main window.
- Configure the analyzer.
- Select Settings from the View menu. The Settings window appears. Choose a value for signal averaging (the Filter field), between 0 and 20 seconds. Set values for high and low alarms and corresponding dead bands, if desired. See Alarms for a complete description of the alarms. If you are using an output device to collect data, choose the value to be output at DAC 1 and/or DAC 2. Make sure the Enable Heater and Pressure Compensation buttons are enabled (checked), and click OK.
- Set the analyzer zero.
- NOTE: The LI-840A is calibrated at the factory before shipping. It is recommended, however, that you verify the calibration by connecting a gas with known concentration and reading the displayed value. If the instrument needs to be calibrated, follow the steps below.
- Connect a dry, CO2-free gas to the input air stream. Select Calibration from the View menu. Click on the Zero tab. Click the Zero CO2. Wait up to 15 minutes for any water vapor to clear from the optical cell, then click the Zero H2O button. After several seconds, a message will appear that indicates the IRGA is zeroed.
- Set the analyzer span.
- Connect a span gas with known concentration of CO2 to the input air stream. Choose a span gas that will be below or close to the highest reading expected. Select the Span tab. Enter the value of the span gas in ppm. Click on Span CO2. A message will appear indicating when the span calibration is completed.
- Connect an airstream with a known water vapor concentration (such as may be generated by the LI-610 Portable Dew Point Generator). Enter the dew point value of the H2O span gas, in degrees C, and click on Span H2O.
- Connect a second span gas with a known concentration of CO2 to the input air stream. If the reading is not within 1% of the expected value, perform a second span: use a span gas with a concentration that is higher than the highest expected reading. Under the Span 2 tab enter the 2nd span gas concentration and click Span CO2.
- Check the H2O reading with a water vapor concentration that is higher than that used to set the H2O span. If the reading is outside the acceptable range, perform a secondary H2O span. Click Close.
- Set up the logging parameters.
- Select Options from the Logging menu. Choose the File Header(s) to be output with the data, the values to be logged, the field delimiter, and log frequency. Click OK. Choose Start from the Logging menu. Enter a file name for the data file. Click Save.
- Set up the charting parameters, if desired.
- Select Charting from the View menu. Enter the value to be plotted, the Y-Axis min and max values, X-Axis max, and time units to be displayed on each plot. Click Start to begin recording data. Graphs with data will appear in the window and data will be logged to the file designated in Step 11 above.
- Choose Stop from the Logging menu to stop recording when you are done collecting data.