
The Average Variables tool averages multiple measurements of a variable for a site. For example, if you have two sensors that measured air temperature, you'll use the average tool to average the two variables.
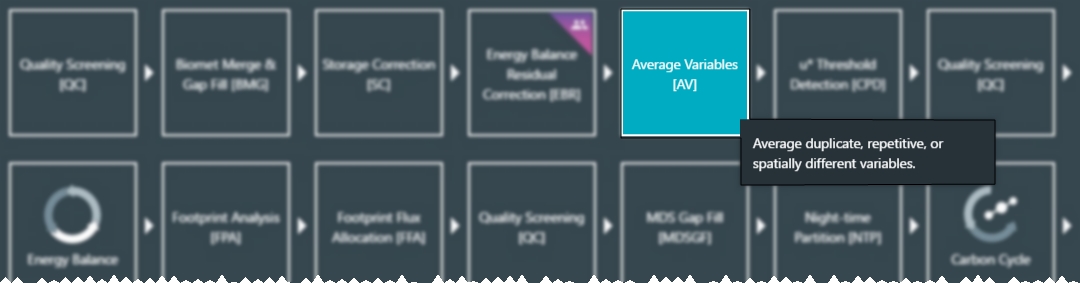
When you open the average tool, you'll see groups of data sets for your site.
- In Overview > Analysis History, select the node to modify and click Toolbox > Average Variables.
- Select the group that has the variables you want to average.
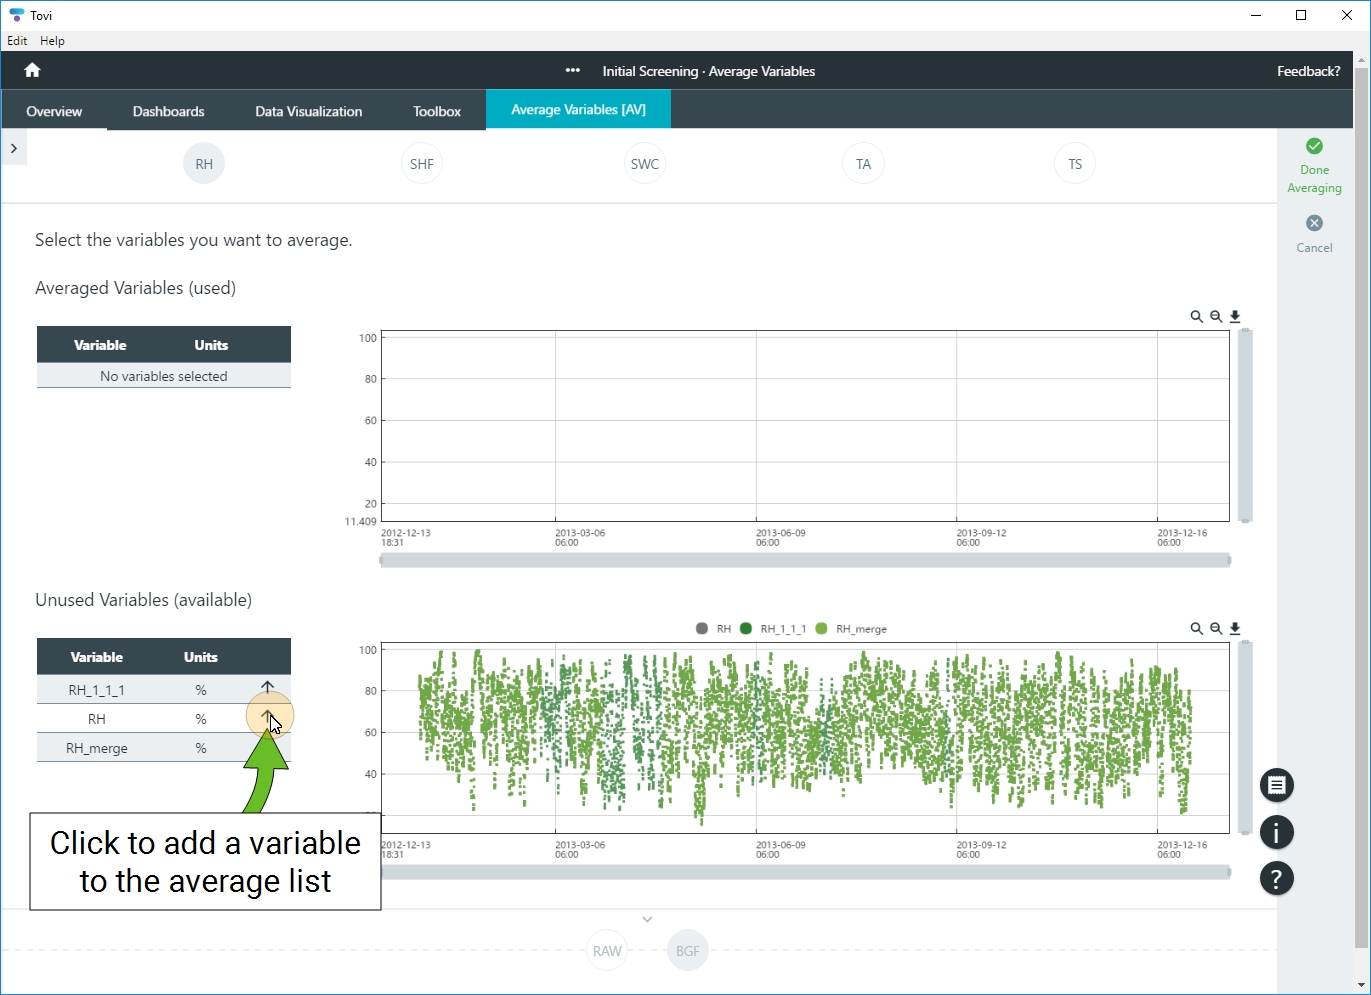
- The groups are RH (relative humidity), SHF (soil heat flux), SWC (soil water content), TA (air temperature), and TS (soil temperature). When a group is selected, you'll see variables. All the variables are listed as Unused. They are plotted on top of each other in the lower graph.
- Click the up arrow next to a variable to add it to the average list.
- Add a second (or third, and so on) variable to the Averaged Variables (used) list.
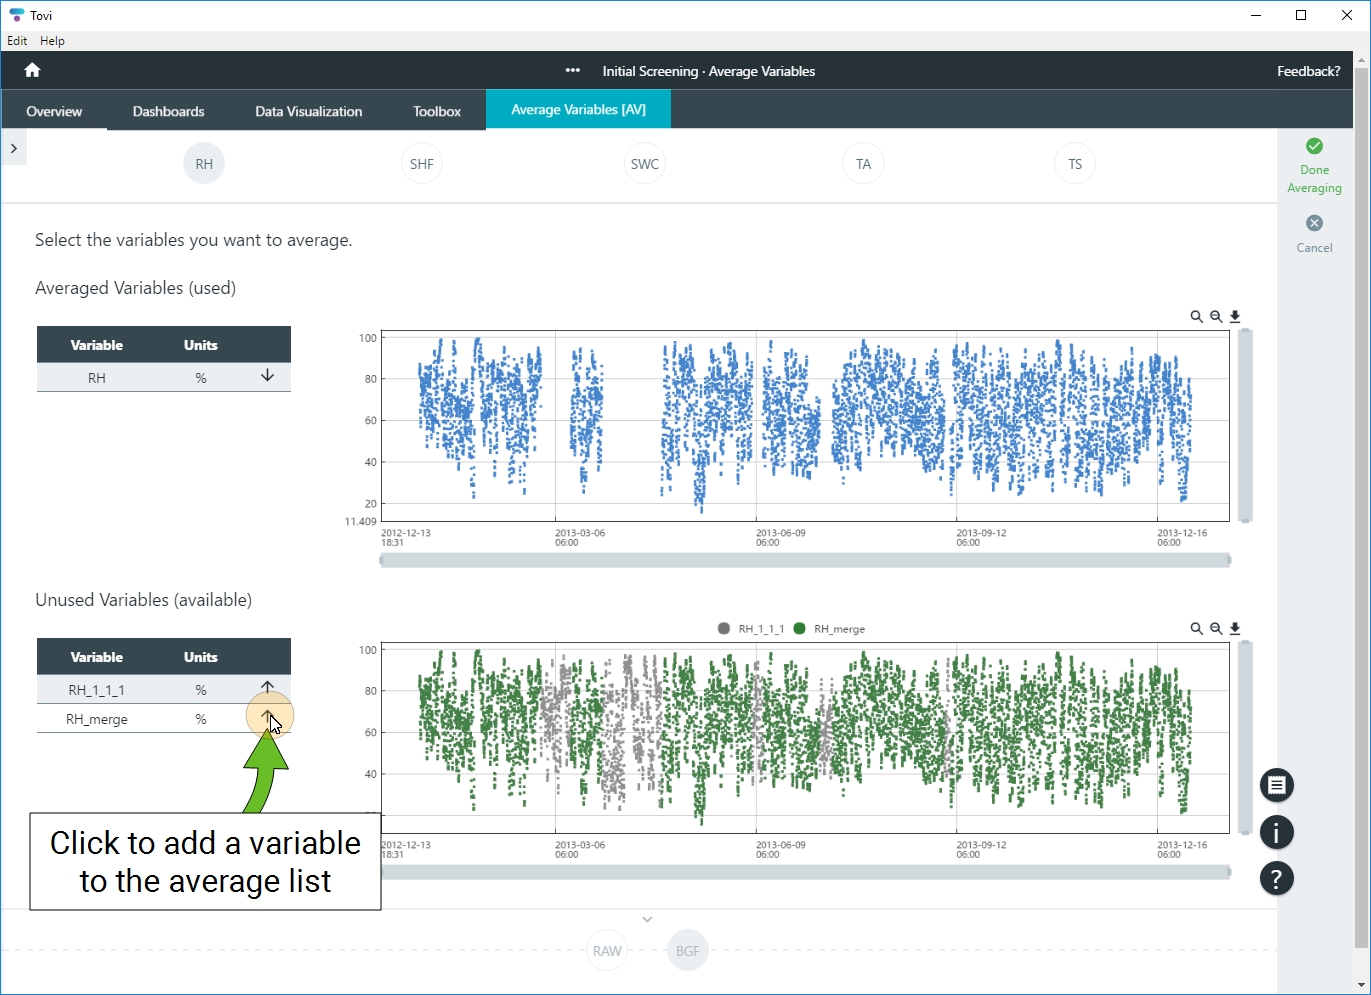
- Tovi will display the average of the variables.
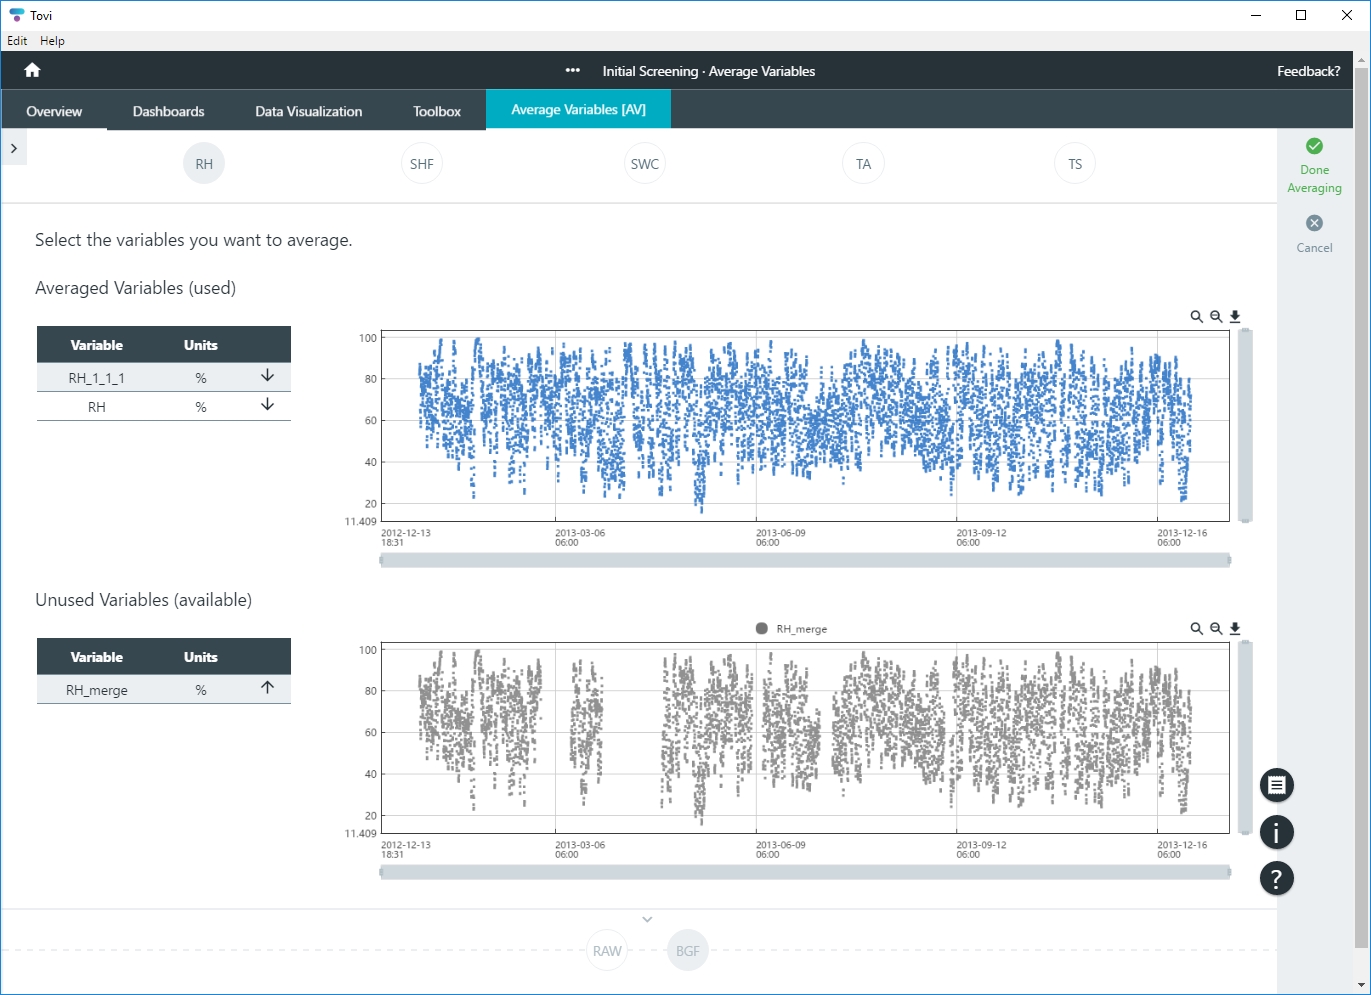
- You can hover your mouse over data points, zoom in, zoom out, and download an image of the chart.
- When you are satisfied with the variable averaging, click Done Averaging.