


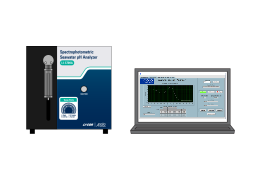
Measuring pH with Alternative Dyes and the LI-5700A
Author: Mike Scaboo
Correspondence: envsupport@licor.com
Published: May 2026
Instruments: LI-5700A
Keywords: meta-Cresol Purple (mCP), Phenol Red (PR), spectrophotometric pH
Abstract
Accurate measurement of pH in freshwater systems is critical for understanding carbon transport within the global carbon cycle. In estuarine environments, freshwater rivers transport terrestrial carbon to the ocean, where carbon dioxide plays a dominant role in regulating pH. Spectrophotometric pH measurements commonly use the indicator meta-Cresol Purple (mCP), which operates effectively within a pH range of 7.4 to 9.0—ideal for most marine systems. However, freshwater and upper estuarine environments often exhibit lower pH values, outside the optimal range for mCP. Phenol Red (PR) is a suitable alternative indicator for these systems, with a working pH range of 5.9 to 7.7. This application note demonstrates how to adapt the LI-5700A for accurate freshwater pH measurements using Phenol Red. The approach can also be extended to other sulfophthalein indicators.
1 | Measurement principles
The LI-5700A is designed to measure seawater pH using mCP, with absorbance peaks at:
-
434 nm and 578 nm (indicator peaks).
-
705 nm (baseline).
Phenol Red requires different absorbance wavelengths:
-
433 nm and 558 nm (indicator peaks).
This method outlines how to configure the instrument to capture these wavelengths while maintaining compatibility with the system’s default settings.
2 | Software setup
The software for the LI-5700A will always measure the peaks as 434, 578, and 705 nm. These wavelengths correspond to the absorption peaks for mCP and a non-absorbing baseline at 705 nm. However, other wavelengths can be added to the peak measurements and saved in the raw data file.
-
To add extra wavelengths go to the WL Setup tab.
In this case we will add 433 and 558 nm wavelengths that correspond to PR absorption peaks.
-
Under Wavelength, type in 433 and click Add.
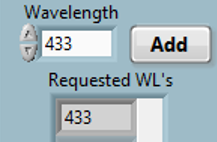
433 will be added to the Requested WL’s array and to the Wavelength Data Table.

-
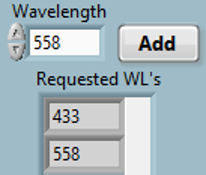
Repeat this step for 558.

-
If you are using a different indicator with a different baseline from 705 nm, use the Baseline WL’s to set your baseline.
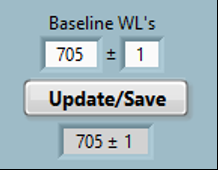
The +/-1 for the baseline can be adjusted as well if the need for baseline absorption must be verified.
-
Remember to click Save for both wavelength inputs.
The analyzer will now read the absorption peaks at 433, 434, 558, 578, and the baseline of 705 +/-1 nm and save the data in the raw files.
The software is still going to report a pH. However, the reported pH will be based on the mCP absorption and equations. Therefore, the reported pH will be incorrect. The true pH will have to be calculated post analysis.
3 | Sample setup
The Standard Deviation Limit will still be based on the mCP pH calculation and again may not be accurate. This can be adjusted by the user as needed.
MCP Volume (mL) is still the volume of dye added, in this case PR.
All other parameters will work the same and should be adjusted to the user’s preference.
Note: Salinity in each port setup will also still be used by the software for the mCP calculation. If measuring estuarine samples, this would be a nice spot to save the salinity of each sample in the raw data file.
The samples can now be run as normal.
4 | pH calculation
The blank and sample absorption values at 433 and 578 nm are now saved in the raw data file.

These values can now be used to calculate the pH of the sample using equations established in the literature for PR.
For our experiment we made a solution at 7.0 pH in freshwater according to Lai et al., (2016). The salts were not dried, nor was pure PR used. Therefore, the pH calculated is slightly lower than 7.0.
| pH | |
|---|---|
| 6.9663 | |
| 6.9663 | |
| 6.9663 | |
| 6.9664 | |
| Average | 6.9663 |
| Precision | +/-9.0E-06 |
The precision still meets the +/- 0.001 as specified for the LI-5700A.
5 | References and related publications
This list is not exhaustive.
| 1 | Yao W, Byrne RH. (2001). Spectrophotometric determination of freshwater pH using bromocresol purple and phenol red. Environmental Science and Technology. 15;35(6):1197-201. https://doi.org/10.1021/es001573e. |
| 2 | Lai, C.-Z., DeGrandpre, M.D., Wasser, B.D., Brandon, T.A., Clucas, D.S., Jaqueth, E.J., Benson, Z.D., Beatty, C.M. and Spaulding, R.S. (2016), Spectrophotometric measurement of freshwater pH with purified meta-cresol purple and phenol red. Limnology Oceanography: Methods, 14: 864-873. https://doi.org/10.1002/lom3.10137. |
| 3 | Fleger, K.L., Liu, X., Berelson, W., Cetiner, J.E.P., Adkins, J., Byrne, R.H. (2025). Total alkalinity measurements in small samples: methods based on CO2 equilibration and spectrophotometric pH. Analytica Chimica Acta, Volume 1372, 344432, https://doi.org/10.1016/j.aca.2025.344432. |