


Meta commands
The Meta specifier contains commands that tell the LI-6800 how to handle an event (flash or dark pulse), and what analysis computations to add to the event file, once the event data is received from the fluorometer. With standard events (RECT, MPF, INDUCTION, or DARK), the meta commands are automatic, and hidden. With a CUSTOM event, however, you have access to them to use as you wish.
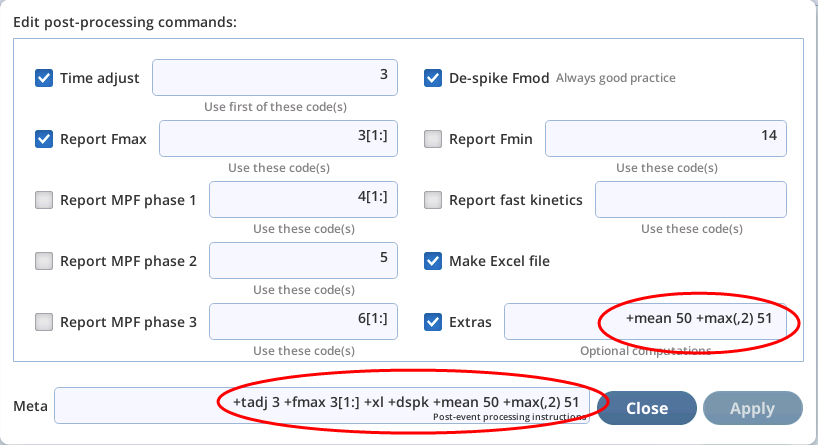
Meta commands can be entered in the Meta field shown in Figure 8‑92. A summary of the meta commands is given in Table 8‑19.
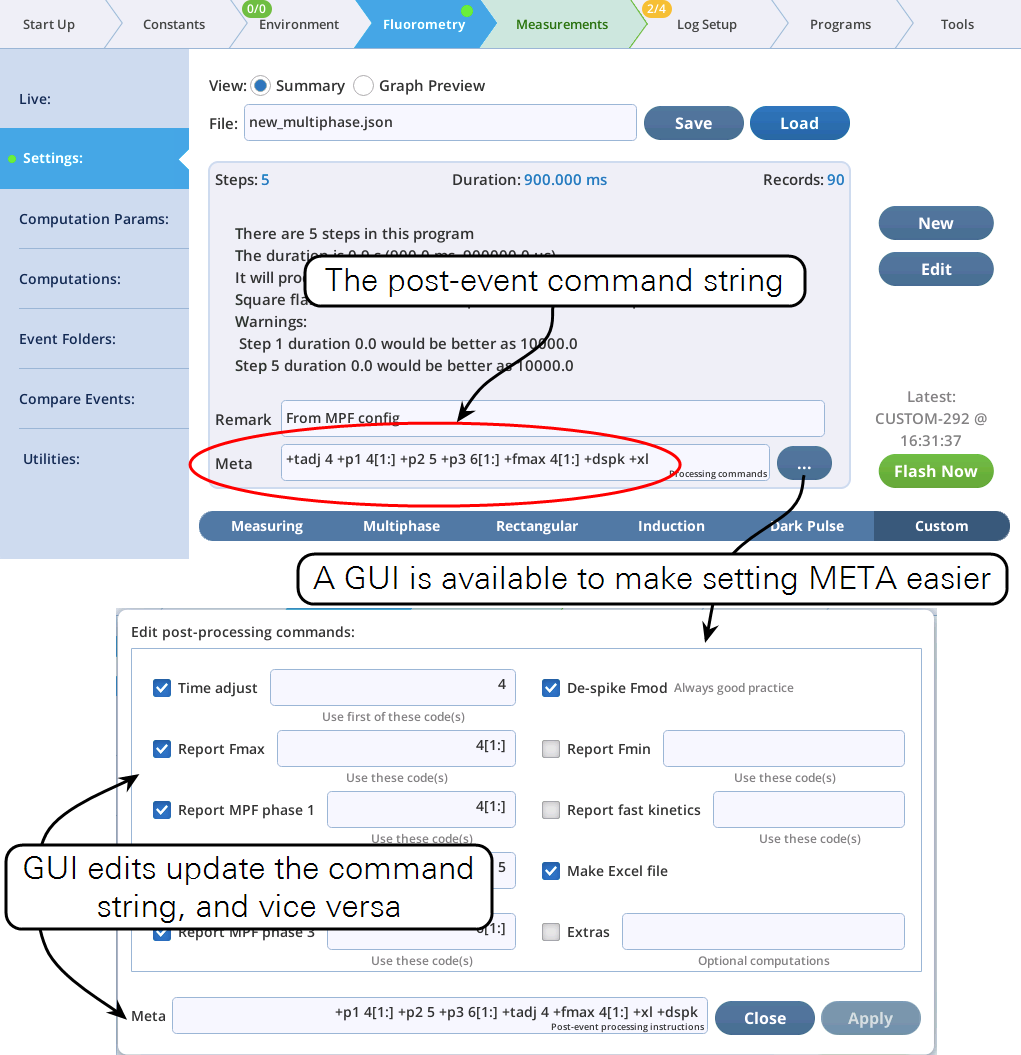
Meta commands can be specified by editing the string, or using the GUI. For example, to compute the maximum fluorescence reported from a flash during codes 20 and 21, either include +fmax 20,21 as part of the Meta string, or check the Report FMax checkbox and enter 20,21 in its edit box:

Note that the two items at the bottom have reverse logic; clearing the Compare Events or the Computations boxes, causes a suppression command (!ce and !comps) to appear; checking them makes them disappear.
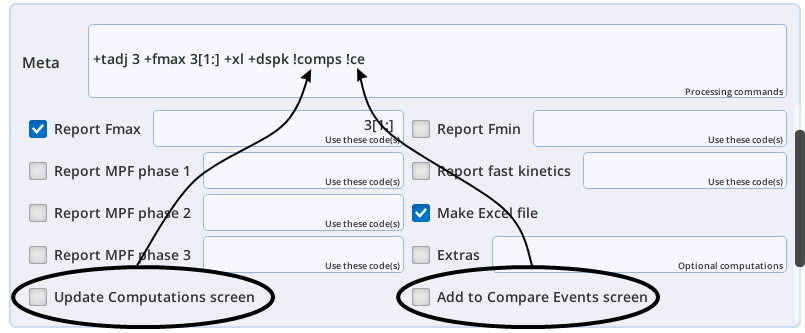
!ce and !comps, are suppressors and have reverse logic; the command only appears in the meta string if the corresponding checkbox is unchecked.Syntax
Each meta command has two basic parts: a name and options, separated by one or more spaces.
+command spec
where +command is one of the items in Table 8‑18, and spec is an optional code specifier, identifying which part of the flash data to use for a computation.
Some rules:
-
The meta string is parsed on space characters. Therefore, no spaces allowed within a
+commandor aspec. -
Any parsed item beginning with a + (or in two cases !) is taken to be a command.
-
The meta commands in Table 8‑18 are "one or none". That is, each is tied to a singular action (e.g. make an excel file) or computation (e.g. maximum fluorescence). If there are multiple occurrences of a command in the meta string counts, only the last one counts. For example:
+fmax 3 +fmax 4. Thefmax 4will overrule thefmax 3. (Note: Meta extra commands described in Meta extras do not have this limit.) Also note that this differs from+fmax 3,4, which will compute the max looking at both codes 3 and 4. -
specitems have their own set of rules and options, described next.
Code specifiers
Code number(s) represent a list of indices in the flash file's time series data. For example, consider a hypothetical flash data set that includes these time series data:
:
    "FLUOR":[91, 92, 93, 94, 95, 96, 97, 98, 99, 100]
    "CODE": [16, 16, 17, 17, 17, 17, 17, 18, 18, 18]
              0   1   2   3   4   5   6   7   8   9 ← Indices
:
Consider the meta command +fmax 17.
The code specifier is 17. This means we want to work on data whose CODE is 17. The list of indices (first index is 0) where this condition is true is
[2, 3, 4, 5, 6]
+fmax means we are looking at the FLUOR values, which, for those indices are [93, 94, 95, 96, 97], so +fmax 17 = 97.
Codes can be chained together: for example +fmax 16,17 would operate on indices
[0, 1, 2, 3, 4, 5, 6]
Code order does not matter, since the final list is sorted in ascending index order, so +fmax 17,16 would still yield the indices
[0, 1, 2, 3, 4, 5, 6]
Also, redundancy is ignored, as the final list of indices will have no repeated value. Thus +fmax 16,16 would yield indices of
[0, 1]
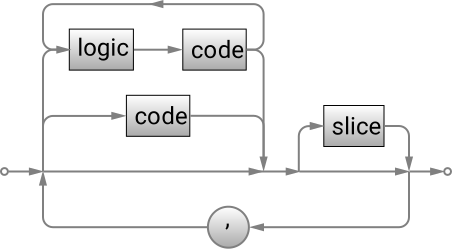
Version 2.2 adds an operator option to code specifiers. The supported operators are !, <, <=, >, >=. (! means "not".) Suppose you want to operate on all data having codes larger than 17. This can be accomplished by >17 or >=18 or !16!17 (as long as 16 and 17 are the lowest code values). The second example illustrates that operators and their targets can be chained together. Chained together operators (not separated by a comma) imply a logical "and". To do a logical "or", put them in separate specifiers. For example, to elect everything below 17 OR above 20, you could specify <17,>20. Contrast that with <17>20 (below 17 AND above 20, which is the empty set.)
A code specifier can contain slice information (using the Python slicing convention), allowing you to further filter the list of indices. The syntax is (no spaces!)
code[start:stop:step]
where code is the code number, start is starting index, defaults to 0, stop is stopping index, defaults to None, and step is the step count, defaults to 1. start and stop can be positive (count from the left end) or negative (count from the right end).
Note that slicing can be applied to a single code, as in the above example, or to the final result. For example
10,12[-4:],16,[2:10]
will trigger the following list of actions for accumulating the indices:
-
add all of code 10
-
add the last 4 indices of code 12
-
add all of code 16
The "codeless" ,[2:10] does a final slice on the list of indices we have accumulated so far, selecting indices 2 through 9.
Where a "codeless" slice occurs in a list of code specifiers doesn't matter; it is always deferred to the end. If more than one is found, only the last one in the list is used.
When a code specifier has both an operator (or chained together operators) and slice information, the slice information always is applied after the operators. Thus, the following are equivalent:
-
>10<20[2:]- all codes passing the test > 10 and < 20 are assembled, then sliced with[2:] -
>10[2:]<20- same -
>10[4:10]<20[2:]- same. The[4:10]is replaced with the[2:]during parsing.
Examples using the above hypothetical flash data are shown in Table 8‑18.
:
    "FLUOR":[91, 92, 93, 94, 95, 96, 97, 98, 99, 100]
    "CODE": [16, 16, 17, 17, 17, 17, 17, 18, 18, 18]
              0   1   2   3   4   5   6   7   8   9 ← Indices
:Standard meta commands
Table 8‑19 summarizes the standard meta commands available for use.
+tadj (Time adjust)

As reported by the fluorometer (see, for example, Listing 8‑3), the values in the time vector (SECS) start at 0. The +tadj command allows you to shift that time so it corresponds to something else. In the standard flashes, time is adjusted so 0 occurs at the start of the flash, skipping over any margin points. For a dark pulse, time = 0 is when the actinic turns off. In a custom flash you can make time 0 correspond to the first occurrence of a record with the code value of your choice.
See Time adjust to start of flash.
Examples:
+tadj 20
|
Make time = 0 correspond to the first record of code=20 |
+tadj 13,14
|
If multiple codes are given, the one that occurs first is used. If slice specifiers are included (e.g. 4[1:], they are ignored by tadj. |
If slice specifiers are included (e.g., 4[1:]), they are ignored by tadj.
If a time shift is implemented, the offset used is recorded (in s) in the file as
"T_OFFSET": 0.003675 All values in the SECS vector have had this subtracted from them
+dspk (De-spike)

If the actinic light changes significantly from one step to the next, it usually generates a spurious modulated fluorescence reading (in the FLUOR vector in the file). Despiking replaces those readings with the mean of adjacent readings, to prevent contaminating subsequent computations or interfering with graph scaling.
Examples:
+dspk
|
Despike FLUOR data |
If any values are replaced by despiking, the index of the value replaced, as well as the original replaced value are reported the file in space-delimited strings:
"Dspk_indices":[35, 70], Indices (0 based) of the FLUOR values replaced
"Dspk_values":[-95727, -95626] The FLUOR values replaced
+fmax (Maximum Fluorescence)

To find the maximum modulated fluorescence, use this command.
Examples:
+fmax 4[1:]
|
Find max FLUOR when code=4 (ignoring first point) |
+fmax 17,20[2:],31
|
Find max FLUOR in these codes |
The following entries are added to the file that contain the results: the maximum (FMAX), and also the corresponding time and quantum values.
"FMAX":1790.33, Maximum value in modulated fluorescence
"T@FMAX":0.68625, The time of the max value (s)
"QMAX":15654.6, The corresponding value of PFD
:
"Fo":136.69, If a dark-adapted flash
- or -
"Fs":1838.77, If a light adapted flash
The reported value FMAX is actually the average of three data points: the actual max, and the neighbor to each side (or the two neighbors on one side, if the maximum occurs at the end of a code segment).
If the processing codes include the +p2 command (MPF Phase 2), then only FMAX is reported, with the value coming from the P2 INT value (or, if there is also a +p1 command, the maximum of P2_INT and P1_MAXF.
+fmin (Minimum Fluorescence)

To find the minimum modulated fluorescence, use this command.
Examples:
+fmin 21
|
Find min FLUOR when code = 3 |
+fmin 20,21
|
Find min FLUOR for all codes 20 or 21 |
The following entries are added to the file that contain the results: the maximum (FMIN), and also the corresponding time and quantum values.
"FMIN":721.27, Minimum value in modulated fluorescence
"T@FMIN":3.59, The time of the min value (s)
"QMIN":0.00999929, The corresponding value of PFD
:
"Fs":1838.77, F prior to the event
The reported value FMIN is actually the average of three data points: the actual min, and the neighbor to each side (or the two neighbors on one side, if the minimum occurs at the end of a code segment).
+p1 (MPF Phase 1)

To analyze part of a flash event as an MPF phase 1, use this command, specifying which code(s) are to be included.
Examples:
+p1 4
|
Consider code 4 to be Phase 1 |
+p1 20,21,22
|
Consider codes 20, 21, and 22 to all be part of Phase 1 |
The following is added to the file:
"P1_MAXF":1848.65, Maximum value in phase 1 of modulated fluorescence
"T@P1_MAXF":0.09, The time of that max value (s)
"Q@P1_MAXF":10348.5, The corresponding value of PFD
If there is also a Phase 2 associated with the flash, the following will also be added, based on the fit of F vs 1E4 / PFD done in Phase 2:
"P1_PREDF":1836.69, Predicted max fluorescence in phase 3
"P1_DELTAF":-18.77, Measured - predicted
+p2 (MPF Phase 2)

To analyze part of a flash event as an MPF Phase 2, use this command, specifying which code(s) are to be included.
Examples:
+p2 5
|
Consider code 5 to be Phase 2 |
+p2 24,25,26
|
Consider codes 24, 25, and 26 to all be part of Phase 2 |
The following is added to the file:
"P2_SLP":-43.0325, For a fit of F vs 1E4/PFD, there is slope,...
"P2_INT":1878.27438, ... intercept
"P2_R2":0.92802, ... r2 of the fit
"P2_SLP_SE":2.26483, ... standard error of the slope
"P2_INT_SE":2.52247, ... standard error of the intercept
"P2_DQDT":-0.008515, dQ/dt for phase 2 (mol m-2 s-2)
+p3 (MPF Phase 3)

To analyze part of a flash event as an MPF Phase 3, use this command, specifying which code(s) are to be included.
Examples:
+p3 6
|
Consider code 6 to be Phase 3 |
+p2 27,28
|
Consider codes 27 and 28 to all be part of Phase 3 |
The following is added to the file:
"P3_MAXF":1817.92, Maximum value in phase 3 of modulated fluorescence
"T@P3_MAXF":0.63, The time of that max value (s)
"Q@P3_MAXF":10348.3, The corresponding value of PFD
If there is also a Phase 2 associated with the flash, the following will also be added, based on the fit of F vs 1E4 / PFD done in Phase 2:
"P3_PREDF":1836.69, Predicted max fluorescence in phase 3
"P3_DELTAF":-18.77, Measured - predicted
+fk (Fask Kinetics)

Fast Kinetics refers to the computations associated with the initial rise of an induction curve.
To do the complete analysis, durations of at least 50 ms are required.
Examples:
+fk 3
|
Use code 3 for computing fast kinetics |
+fk 31,32,33
|
Use code 31, 32, and 33 for computing fast kinetics |
"DCmax":16.983, Using normalized DC fluorescence, the max value...
"T@DCmax":0.04599825, ... time of the max value,
"DCo":16.3611, ... intercept of curve fit of initial points
"PhiPS2_dc:0.0366, ... 1 - DCmax/DCo
"InitSlope":1534.0, ... slope of that curve fit.
"F1":1728.135, Fluor at 1st inflection on initial rise. (J)
"T@F1":0.00615825, Time (s) of F1
"T@HIR":0.00019425, Time to half of (F1 - Fo)
"F2":1728.998, Fluor at 2nd inflection (I)
"T@F2":0.04399825, Time of F2
+xl Make Excel File

Creates an Excel file, in addition to the .json file in /home/licor/logs/flrevents/.
Meta extras
When the meta parser encounters a non-standard meta specifier (i.e., anything that is not in Table 8‑19), it is considered an extra meta command. On the interface, extras show up as shown in Figure 8‑95.
There are several factory-supplied meta extras (Table 8‑20), and it is possible to add user-defined extras as well (see User-defined meta extras). But first, let's consider the two in Figure 8‑95 +stats 3 +stats(DC/Q) 3.
The first looks like other meta commands: it is performing whatever stats does (described below) on code 3 data. The second (+stats(DC/Q) 3) is an example of the optional parameters available to meta extras. In this case, we want the same computation, but using DC/Q data instead of FLUOR data. Optional parameters are described next.
Optional parameters
The target of most meta and meta extra commands is FLUOR. +mean 16, for example, computes the mean value of FLUOR for code 16 data. But what if you want the mean of light (PFD), or non-modulated fluorescence normalized by light (DC/Q) instead? Meta extras pass parameters by appending them in a comma separated list (no spaces!) after the name, surrounded with ( ). In the case of +mean, it supports one optional parameter, an alternative target (any of the time series variables in a flash file).
+mean(dc/q) 17 - compute the mean of DC/Q values for code 17.
As a convenience, the factory supplied extras don't force you to specify a target in upper case (DC/Q), although you can; the code supporting the extra will turn dc/q into DC/Q for you. In the table below, you can find meta extras that support 1, 2, or 3 optional parameters. If you create your own, you can make it support as many or few as you like.
Factory supplied extras
The following illustrates the syntax we'll use for describing extra commands, where square brackets [ ] mean "optional".
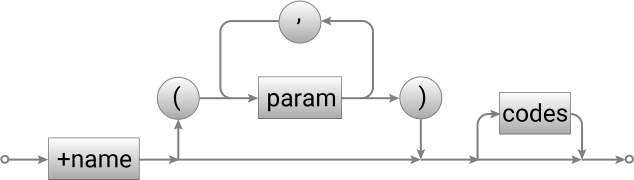
+name codes - name requires codes
+name[(arg1,arg2)] [codes] - name has 2 optional parameters, arg1 and arg2. codes is optional.
Table 8‑20 summarizes the meta extras the system provides, with details in the sections following. If you don't find what you need here, then User-defined meta extras shows how to add your own.
+fit
Compute the coefficients of a polynomial fit.
+fit[(y_target, x_target, power)] [codes]
y_target - can be any time series ID in the file (SECS, FLUOR, DC, PFD, RED, REDMODAVG, FARRED, CODE or one of the computed light values BLUE or DC/Q). (target can be entered as lowercase.) If not specified, target defaults to FLUOR.
x_target - can be any time series ID. If not specified, target defaults to SECS.
codes - see Code specifiers. If not specified, defaults to * (all data)
Examples:
+fit 22[2:]
|
Generate a linear fit of FLUOR vs SECS for the code 22 data, neglecting first two points in the fit. Report the slope of the fit. |
+fit(dc) 22[2:]
|
Same as first, except fit DC instead of FLUOR |
The list of fit parameters added to the file uses the extras specifier as the label: For example, fit(dc,pfd,2) 5 will yield a list of coefficients, highest order first.
"fit(dc,pfd,2) 5":[2.504963014e-05, 7.21237939, 191.5738090],
+HIQ
Performs a high intensity quenching (HIQ) computation for the specified code, using data from the preceding step as a baseline. This command can be used for a single event, or to generate a response curve for HIQ as a function of light intensity.
+hiq[(target)] codes
target - can be any time series ID in the file (SECS, FLUOR, PFD, RED, REDMODAVG, FARRED, CODE or one of the computed light values BLUE or DC/Q). (target can be entered as lowercase.) If not specified, target defaults to FLUOR.
HIQ is the ratio of two values:
8‑28hiq = dark / base
where dark is the maximum value of the target (e.g., FLUOR) found in the codes step, and base is the maximum value of target for the step immediately preceding codes.
Examples:
+hiq 24
|
Find hiq of FLUOR at code 24. |
If there is only one set of contiguous code 24 data, there are three lines added to the file.
"hiq_Qx 24":20244.8, PFD from previous step
"hiq_Fx 24":1273.56, FLUOR from previous step
"hiq 24":1.0176, HIQ computation
If there are multiple sets of contiguous code 24 data (the example below has 10) then hiq is computed once for each, and the results shown in a list. A linear fit of hiq as a function of hiq_Qx is performed, and the slope and offset shown in the hiq_fit entry.
"hiq_Qx 24":[20244.8, 10063.2, 16206.8, 5980.72, 8037, 12144.4, 18302.8, 14197.9, 10102.2, 20370.8],
"hiq_Fx 24":[1273.56, 1273.17, 1272.42, 1267.91, 1271.78, 1271.06, 1270.45, 1273.26, 1270.5, 1269.29],
"hiq 24":[1.015, 1.01, 1.006, 1.003, 1.01, 1.012, 1.01, 1.005, 1.01, 1.018],
"hiq_fit 24":[5.29e-07, 1.003], Slope and intercept of hiq as function of Qx
+iv
Initial Value: Fit a polynomial as a function of time, nd the value at the start of a step.
+iv[(target,power)] [codes]
The polynomial is evaluated at the start of the rst step specified in codes.
target - can be any time series ID in the file (SECS, FLUOR, DC, PFD, RED, REDMODAVG, FARRED, CODE or one of the computed light values BLUE or DC/Q). (target can be entered as lowercase.) If not specified, target defaults to FLUOR.
power - the power of the fit. Default is 1.
codes - see Code specifiers. If not specified, defaults to * (all data)
Examples:
+iv 22[2:]
|
Generate a linear fit of FLUOR vs SECS for the code 22 data, neglecting first two points in the fit. |
| Evaluate at time of the start of first code 22 step. | |
+iv 22[2:],23
|
Same as above, but include code 23 data as well. |
+iv 23,22[2:]
|
Same as above, except now the fit is evaluated at the first code 23 step. |
+iv(,2) 22[2:]
|
Same as first example, but use a 2nd order polynomial. |
+iv(dc) 22[2:]
|
Same as first, except t DC instead of FLUOR |
The initial time t0 of a step is computed from the SECS value for that step, adjusted for the modulation and output rates. See Fluorometry timing details.
The entry added to the file uses the extras specifier as the label: For example, iv 3[2:] will yield
"iv 3[2:]":2457.3923279998585,
+max
Find the maximum, with option to average adjacent points.
+max[(target,interval)] [codes]
target - can be any time series ID in the file (SECS, FLUOR, DC, PFD, RED, REDMODAVG, FARRED, CODE or one of the computed light values BLUE or DC/Q). (target can be entered as lowercase.) If not specified, target defaults to FLUOR.
interval - default is 0. Number of data values on each side of the maximum value to average together for the result.
codes - see Code specifiers. If not specified, defaults to * (all data)
Examples:
+max 20,22[2:]
|
Find the maximum of FLUOR for the specified codes. |
+max(,2) 16
|
Find the average of 5 data points centered on the maximum value of FLUOR in code 16 data. |
+max(dc) 16
|
Find the highest value of DC in code 16 data |
The entry added to the file uses the extras specifier as the label: For example, max(,2) 3[1:] will yield
"max(,2) 3[1:]":2668.9383333333335,
+mean
Compute the mean value.
+mean[(target)] [codes]
target - can be any time series ID in the file (SECS, FLUOR, DC, PFD, RED, REDMODAVG, FARRED, CODE or one of the computed light values BLUE or DC/Q). (target can be entered as lowercase.) If not specified, target defaults to FLUOR.
codes - see Code specifiers. If not specified, defaults to * (all data)
Examples:
+mean 20,22[2:]
|
Compute mean of FLUOR for the specified codes. |
+mean(dc) 16
|
Compute the mean of DC all code 16 data. |
The entry added to the file uses the extras specifier as the label: For example, mean 3[2:] will yield
"mean 3[2:]":2629.890897435898,
+min
Find the minimum, with option to average adjacent points.
+min[(target,interval)] [codes]
target - can be any time series ID in the file (SECS, FLUOR, DC, PFD, RED, REDMODAVG, FARRED, CODE or one of the computed light values BLUE or DC/Q). (target can be entered as lowercase.) If not specified, target defaults to FLUOR.
interval - default is 0. Number of data values on each side of the minimum value to average together for the result.
codes - see Code specifiers. If not specified, defaults to * (all data)
Examples:
+min 20,22[2:]
|
Find the minimum of FLUOR for the specified codes. |
+min(,2) 16
|
Find the average of 5 data points centered on the minimum value of FLUOR in code 16 data. |
+min(dc) 16
|
Find the lowest value of DC in code 16 data |
The entry added to the file uses the extras specifier as the label: For example, min(,2) 3[1:] will yield
"min(,2) 3[1:]":2401.875,
+smean
Sorts the data (low to high) then does the mean value of the selected slice (uses Python list slicing) of that data.
+smean[(y_target, slice1, slice2)] [codes]
target - can be any time series ID in the file (SECS, FLUOR, DC, PFD, RED, REDMODAVG, FARRED, CODE or one of the computed light values BLUE or DC/Q). (target can be entered as lowercase.) If not specified, target defaults to FLUOR.
slice1 - post-sort slice parameter #1. Defaults to 0
slice2 - post-sort slice parameter #2. Defaults to None
codes - see Code specifiers. If not specified, defaults to * (all data)
Examples:
+smean(,2,-1) 44
|
Get mean of FLUOR for code 44 data, neglecting the lowest 2 and highest 1 values. |
+smean(dc,-10) 3
|
Get mean of the highest 10 values of DC for code 3 data. |
+smean(dc,0,10) 3
|
Get mean of the lowest 10 values of DC for code 3 data. |
+smean(,0,10) 3[2:-1]
|
Using all of the code 3 FLUOR data except the first 2 and final points, sort it, then get the mean of the lowest 10 points. |
Note: There is potentially slicing done before the sorting, and that is specified in the code specifier. The slicing specified in the optional parameters is done after the sorting. The last example above illustrates this point.
The entry added to the file uses the extras specifier as the label: For example, smean(,0,10) 3 will yield
"smean(,0,10) 3":587.386,
+stats
Find count, min, max, mean, and standard deviation for a code. +stats can be a convenient shortcut instead of specifying +min +max +mean +std.
+stats[(y target)] [codes]
target - can be any time series ID in the file (SECS, FLUOR, DC, PFD, RED, REDMODAVG, FARRED, CODE or one of the computed light values BLUE or DC/Q). (target can be entered as lowercase.) If not specified, target defaults to FLUOR.
codes - see Code specifiers. If not specified, defaults to * (all data)
Examples:
+stats 51
|
Get stats on FLUOR for all points with code 51. +stats(dc) 16 - Get stats on DC for all points with code 16. |
+stats
|
Adds 5 lines to the file, none of which are labeled stats: |
"count(dc) 16":10,
"min(dc) 16":10567.6,
"max(dc) 16":10600.5,
"mean(dc) 16":10584.509999999998,
"std(dc) 16":9.194503793027568
+std
Compute the standard deviation.
+std[(target)] [codes]
target - can be any time series ID in the file (SECS, FLUOR, DC, PFD, RED, REDMODAVG, FARRED, CODE or one of the computed light values BLUE or DC/Q). (target can be entered as lowercase.) If not specified, target defaults to FLUOR.
codes - see Code specifiers. If not specified, defaults to * (all data)
Examples:
+std 20,22[2:]
|
Find the standard deviation of FLUOR for the specified codes. |
+std(pfd) 16
|
Find the highest value of PFD in code 16 data |
The entry added to the file uses the extras specifier as the label: For example, std 3[2:] will yield
"std 3[2:]":63.12815516320482,