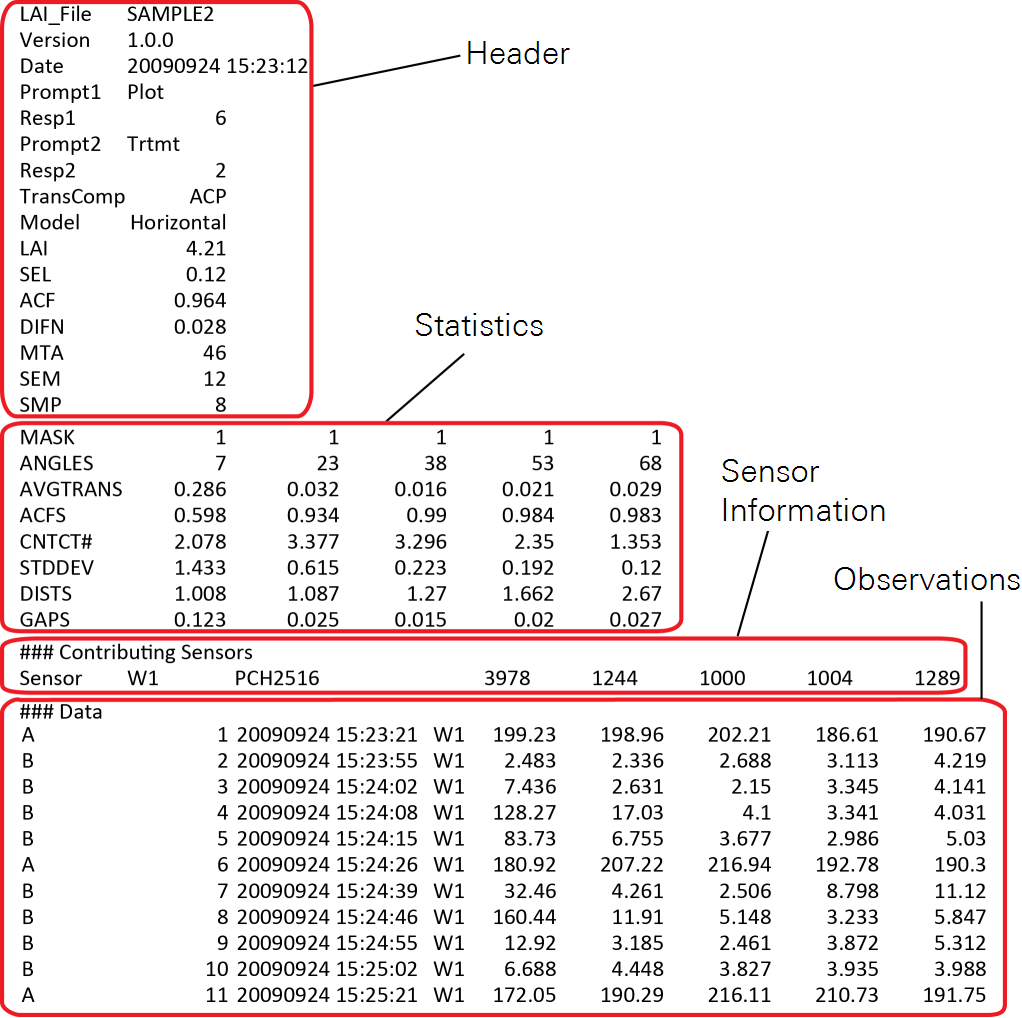
In this section we describe the files that are created by the LAI-2200C. Files generated by the LAI-2200C are text based and consist of four basic parts: Header, Statistics, Sensor Information, and Observations (see Figure C‑3).
Header
The header is a group of fields at the top of the file. It includes the file name, console firmware version, time stamp indicating when the file was created, and user remarks. The remaining part of the header contains the result of LAI calculations: leaf area index (LAI), standard error LAI (SEL), apparent clumping factor (ACF), diffuse non-interceptance (DIFN), mean tilt angle (MTA), standard error MTA (SEM), and the number of pairs of Above and Below observations that were included in the calculations (SMP). If GPS logging is enabled, average latitude (GpsLat), longitude (GpsLong), altitude (GpsAlt), number of satellites used (GpsNum), horizontal dilution of precision (GpsHDOP), and coordinated universal time (GpsUTC) are visible in the header.
Statistics
The statistics group contains 8 groups of 5 numbers: MASK indicates which rings were included in calculations (1 indicates the ring is included, 0 indicates omission). ANGLES are the midangles of the field of view for each of the 5 rings. CNTCT# are the mean contact frequencies (the logarithm of the gap fraction divided by the path length), STDEV are the standard errors of the contact frequencies, DISTS are the path lengths, and GAPS are the gap fractions. ACFS is the apparent clumping factor for each ring, and AVGTRANS is the average transmittance for each ring in the file. Theory discusses how these quantities, as well as those in the header, are computed.
Sensor Information
This field indicates which sensors were used to record the data and the name of the wand used. The five values to the right are matching values for each ring in the sensor. If quantum sensors are connected to port 1 or 2, the light sensor name and calibration information is in this field as well.
Observations
The Observations each have a label (A or B indicating above or below the canopy), a sequential number, a time stamp, and the readings from the five rings of the detector. In this example, the first four samples (B readings 2 through 5) use A reading 1 as a reference. The next four samples (B readings 7 through 10) use the A reading 6 as a reference. If enabled, GPS observations are labeled G. Light sensor observations are labeled 1 or 2.
What do the Results Mean?
LAI is the answer to the question “How much foliage?”. Although LAI nominally means “leaf area index”, please remember that the LAI-2200C is measuring all light-blocking objects, so “foliage area index” is more appropriate. LAI is dimensionless, but it can be thought of as {m2 one-sided foliage area/m2 ground area}. However, if the Model is not Horizontal (that is, if the DISTS values have been changed to reflect measurements of an isolated plant instead of an “infinitely” horizontal canopy), then the LAI value is foliage density (foliage area in m2/canopy volume in m3). SeeComputing LAI.
SEL is Standard Error of LAI (Lse).
ACF is Apparent Clumping Factor. It is equivalent to the apparent clumping index Ωapp defined by Ryu, et al (2010). One of the assumptions the LAI-2200C makes is that foliage positioning is random - if not for the entire canopy, at least for parts of it. For example, consider a widely spaced row crop: The randomness assumption is clearly wrong when considering the entire field, but is much better when considering just one row. Lang and Xiang (1986) showed that in cases like this, if multiple transmittance measurements are made so that each contains either mostly row or mostly gap in its view, they can be combined by averaging the natural logarithms of the transmittances to give the correct leaf area index. For this reason, the LAI-2200C combines multiple transmittance readings by averaging the natural logarithms of the transmittances when computing LAI. The ACF value is
C‑1

where LAIlog(avg(T)) is the leaf area index computed by taking the log of the averaged transmittances, and LAIavg(log(T)) is that reported by the LAI-2200C (computed by averaging the logs of the transmittances). Note that the simple averaged transmittances for each ring are reported in the statistics block of the file, after the label AVGTRANS, while the log-averaged transmittances are reported after the label GAPS. Ring by ring values of ACF are shown after the labels ACFS.
The purpose of ACF is to provide a way to "undo" the avg(log(T)) protocol used by the LAI-2200C to combine readings. Why would you want to do that? If, for example, you had an independently determined clumping factor Ω (determined, for example, from a gap size distribution measurement) for a canopy that you wished to apply to the LAI-2200C results, you would need to do this to compute a true LAI (Ftrue)
C‑2

LAI × ACF undoes the clumping factor compensation inherent in how the LAI-2200C works, and allows the independently determined clumping factor Ω to be applied.
MTA answers “How is the foliage oriented?”. If all the foliage were horizontal, then the correct MTA would be 0°; if all were vertical, MTA would be 90°. This information may not be of particular interest to everyone, but it is wise to make sure the numbers seem at least reasonable. Typically, MTA will range from the 30s to the 60s, but an unexpected MTA value can indicate something wrong with the measurement or the DISTS values.
DIFN is calculated by integrating gap fraction (GAPS) to yield a value that indicates the fraction of sky that is not blocked by foliage. This value ranges from 0 (no sky visible to the sensor) to 1 (no foliage visible to the sensor). DIFN is in essence a single value representation of canopy structure, as it combines LAI and MTA into one number. However, DIFN does not depend on the same assumptions that go into LAI and MTA, but only depends on the assumption of no scattering by the foliage. Of all the values computed by the LAI-2200C, DIFN comes the closest to being an indicator of “canopy light absorption”. However, canopy absorption involves not only canopy structure (DIFN), but also the foliage spectral properties in the wavelength range of interest (for example, the photosynthetically active 400 to 700 nm region) for the foliage and the surface beneath the canopy, and the location of the sun. Therefore, in terms of canopy absorptance, DIFN is merely an indicator of the absorption of diffuse, short wave (<490 nm) radiation.
SMP is the sample size (total number of below canopy readings).