This section describes the measurement of isolated plants, for which a different protocol must be used. We begin with a discussion of LAI and foliage density.
Note: It is best to avoid direct sun when making measurements of isolated canopies. If you do need to make measurements of isolated canopies in direct sun, follow the recommendations in Isolated Canopies and Scattering Corrections.
LAI or Foliage Density?
LAI is one-sided leaf (or foliage) area per unit ground area. In a large, homogeneous plant community, LAI is a reasonable way to express the amount of vegetation. An isolated plant presents difficulties, however, because the amount of foliage over a given area of ground depends on ground position. For example, consider a single tree:
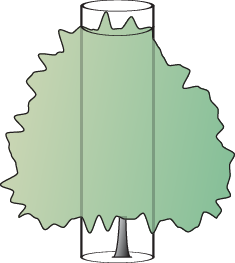
The amount of foliage above a unit of ground area at the tree’s center…
…is probably different than the amount of foliage near the tree’s edge.
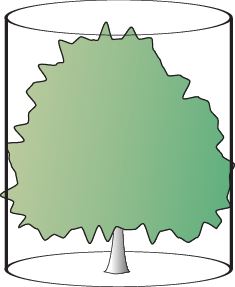
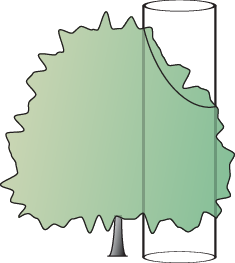
Also, the ground area affects the LAI measurements. For example, we might wish to express LAI based on the tree’s drip line area, or based on the area associated with the tree as a member of a community, as illustrated in the over-head view below.
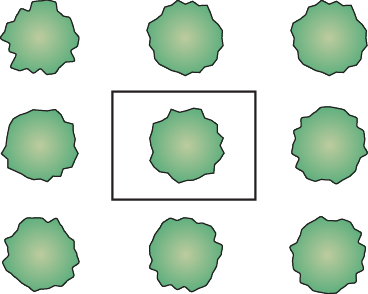
Thus, LAI for an isolated plant is ambiguous unless the size and position of the ground area is also given.
A more useful measure of foliage amount for individual plants, or clumps of plants, is that of foliage area density (or simply foliage density), which is foliage area divided by canopy volume. Foliage density has units of m2 foliage area per m3 canopy volume, which reduces to units of inverse length, typically m-1. If a tree has 2 m2 of foliage in a 5 m3 crown, its foliage density is 0.4 m2/m3, or 0.4 m-1.
The DISTS Vector
Theory describes the theory of the LAI-2200C, showing that the only theoretical difference between measuring LAI and measuring foliage density involves something called the DISTS (Distances) Vector.
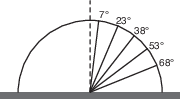
The DISTS Vector is a group of 5 numbers in the control unit that are used in the computations. These numbers indicate the distances sky radiation must travel through the canopy to reach each of the 5 detector rings of the sensor. They can be viewed on the console by going to MENU > Log Setup > Distances. The default values in this vector are 1/cosθ, where angle is the view associated with each of the five rings (7°, 23°, 38°, 53°, and 68°). When making LAI measurements, there is no need to adjust these values since 1/cosθ is sufficient regardless of canopy height.
Foliage density measurements, however, require that the DISTS vector indicate the actual mean path lengths that each ring sees through the canopy. When results are computed, the LAI value is now foliage density. The units of foliage density depend on the units used for the DISTS values. If distances are entered in m, then the foliage density is in m-1.
To set the DISTS vector for new data, go to MENU > Log Setup > Distances. To change the DISTS vector for an existing data file, go to MENU > Data > Console Data. Select a data file, then Edit > Edit Dists.
A Simple Example
Consider a perfectly hemispherical shrub with a radius of 0.7 m. A hemisphere is the simplest because the path lengths for each ring view are identical.
To measure the foliage density of this shrub, access the Distance vectors (MENU > Log Setup > Distances) and set each of the five values to 0.7. The measurement is similar to that for LAI, except that a spatial average under the shrub is now not wanted; we will take only one B reading, directly under the center of the plant. This example is illustrated in Example 6 - A Simple Isolated Canopy.
Isolated Trees
Note: It is best to avoid direct sun when making measurements of isolated canopies. If you do need to make measurements of isolated trees in direct sun, follow the recommendations in Isolated Canopies and Scattering Corrections.
Trees are best measured using the 180° or smaller view cap, and placing the sensor next to the trunk below the crown for B readings. The view cap prevents the sensor from seeing the trunk of the tree. Usually, you will put the sensor above or below the largest branches in the crown because it is important to avoid having these branches dominate the sensor’s view. Place the sensor just above the low branches (Method 1) or place it well beneath them out of the canopy (Method 2). Both techniques are illustrated here:
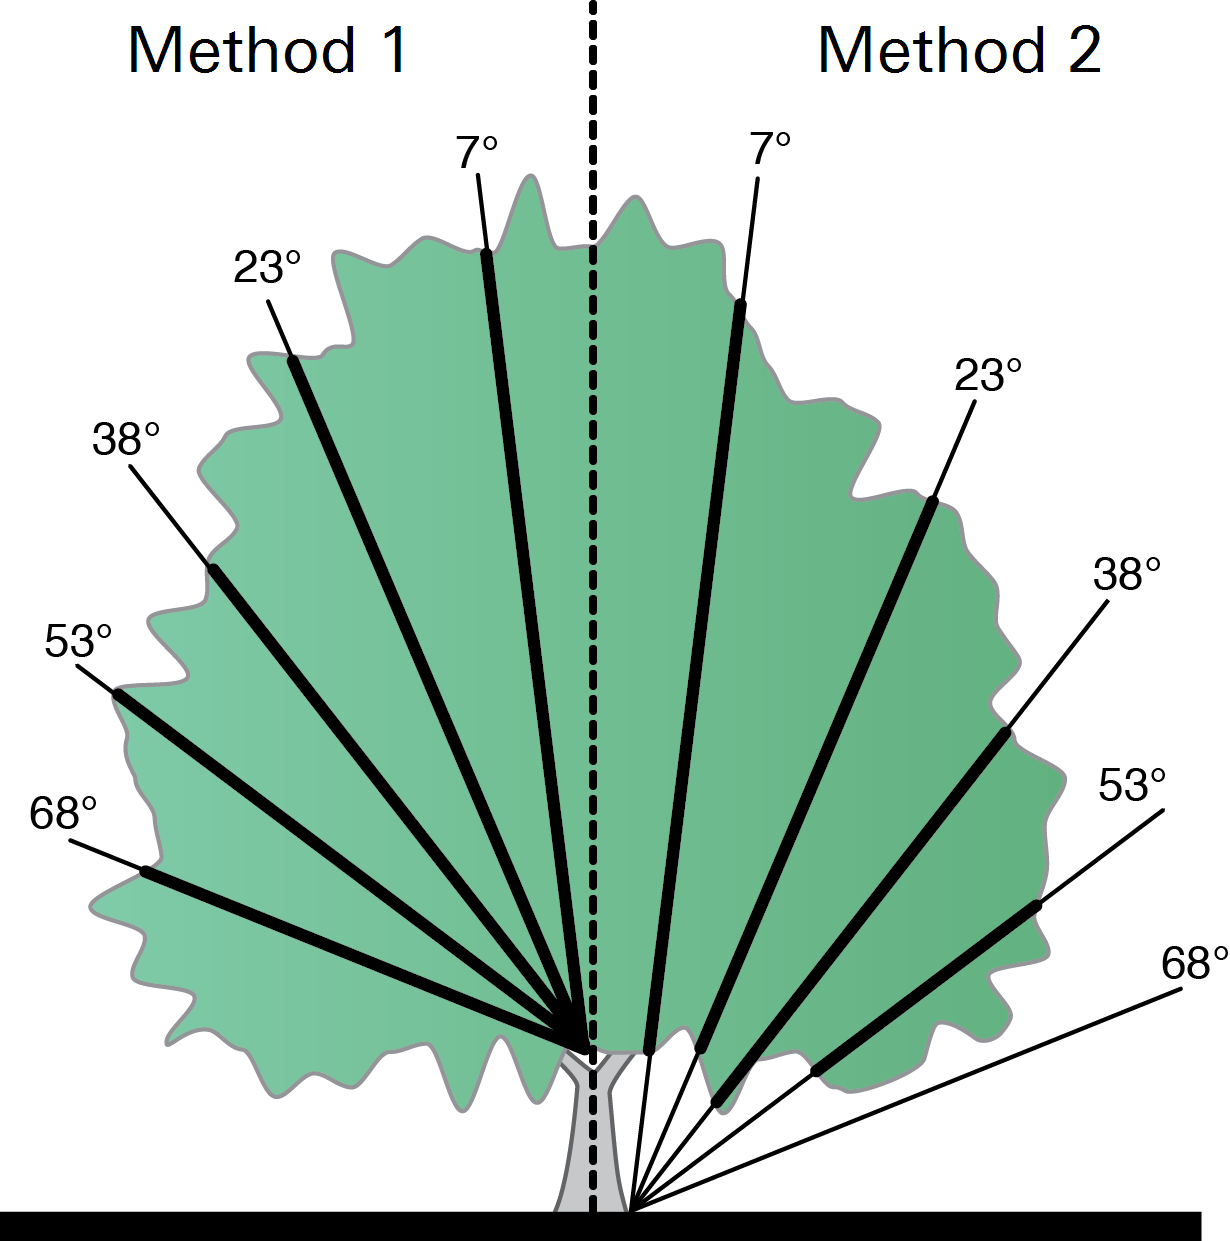
The thick segments of the diagonal lines in this figure indicate the distances each ring sees through the canopy. Note that sometimes a ring will see no foliage, as with the 68° ring in Method 2 above. A ring that sees no foliage should be masked. A 90° or 45° view cap can be used to further reduce the size of the canopy that is sampled. The view cap and view directions should be chosen to avoid including neighboring trees in the measurement.
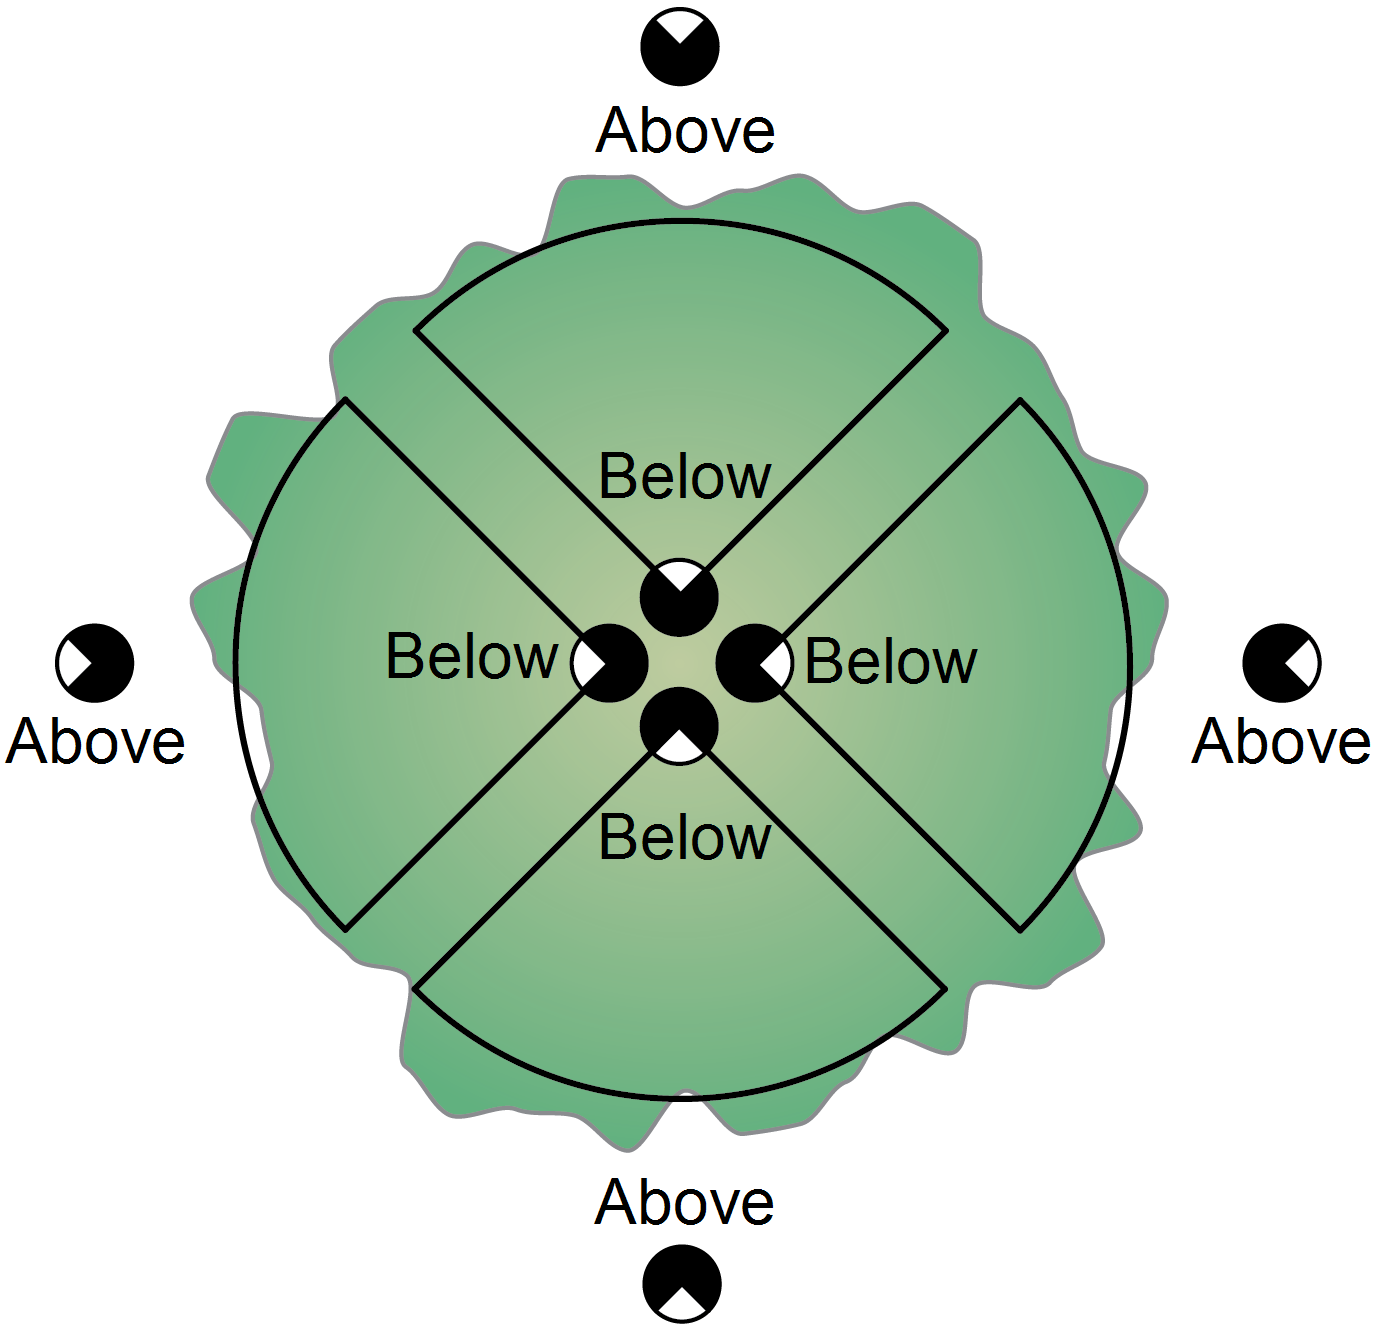
If a tree is symmetric and well isolated, several B readings can be taken in different directions. The figure below illustrates measuring a tree with 4 B readings 90° apart, but a better average could be obtained with 12 B readings 30° apart, for example.
Note: all associated above and below readings must be viewing the same portion of the sky.
If a tree is asymmetric, then the path lengths through the tree (and thus the distance vector) will depend on azimuthal direction. Since only one distance vector is associated with a file, asymmetric trees should be measured using several files. Average foliage density is then computed by averaging the foliage densities from each of the files.
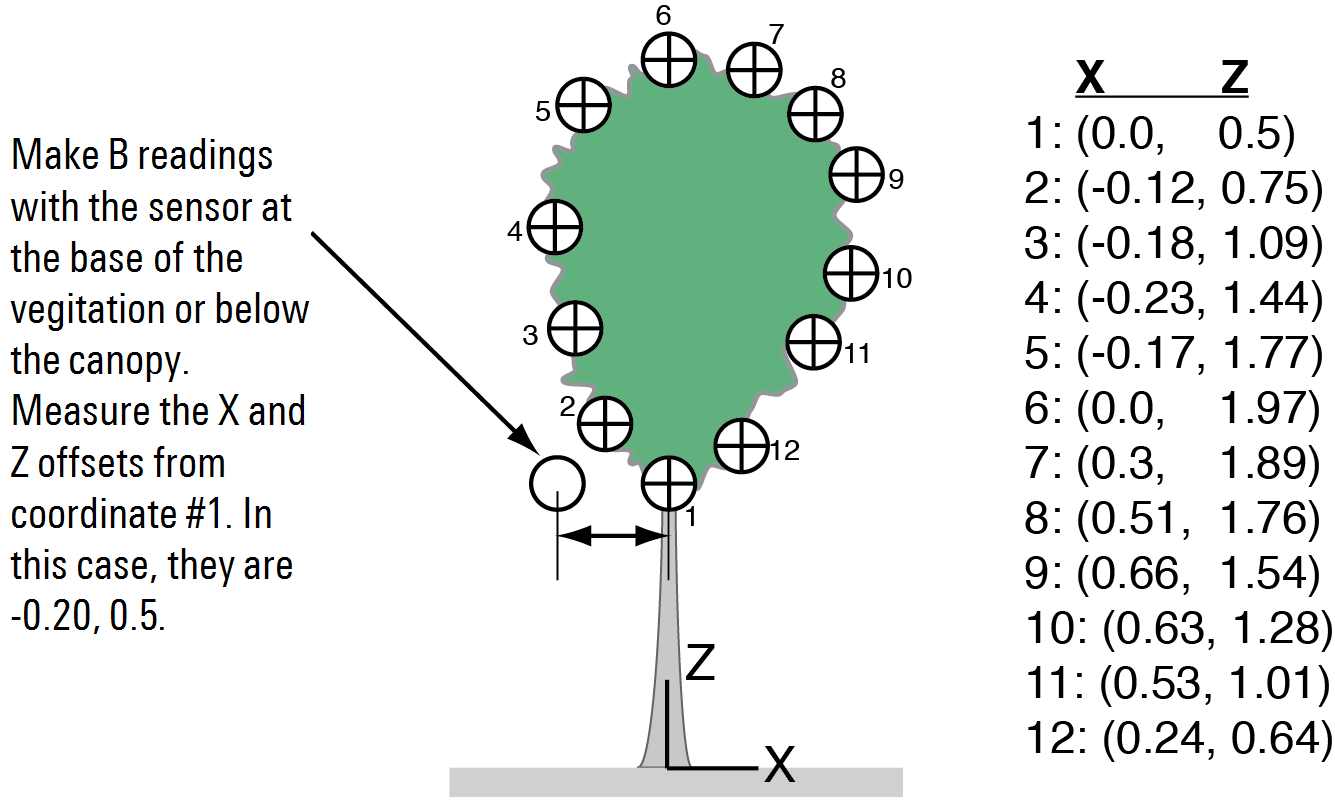
A simple method for computing path lengths and canopy volumes is provided in the FV2200 software. Use a coordinate system centered below the tree, and determine the coordinates of a sufficient number of points to describe the shape of the canopy. Alternatively, a photograph of the tree that includes a meter stick for scale can be used to obtain the tree profile.
An example of the measurements needed to describe a tree crown are shown below:
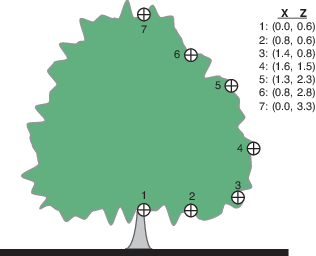
The FV2200 software can use these data to determine path lengths, neglect rings if necessary, and compute canopy volume, foliage density, or dripline LAI.
Refer to the detailed example: Example 7 - Isolated Tree.
Isolated Rows and Hedges
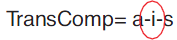
The measurement of individual rows (e.g. hedges, grape vines) is possible with the LAI-2200C. Again, the data should be treated as foliage density. Here we describe two methods for measuring isolated rows or hedges.
Note: It is best to avoid direct sun when making measurements of isolated canopies. If you do need to make measurements of isolated rows or hedges in direct sun, follow the recommendations in Isolated Canopies and Scattering Corrections.
Method 1
The measurement of isolated rows, such as a hedge or the rows in a vineyard, is similar to measuring isolated trees. With this method, the above and below measurements are taken along the length of the row.
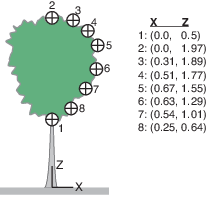
For the below-canopy readings, place the sensor near the row center and orient the view cap so that the sensor looks away from the center. Keep it close to the lowest vegetation, but far enough away from any leaves to ensure that individual leaves do not block the view (see Measuring Isolated Plants).
Next, characterize the canopy shape by measuring a number of X, Z coordinates. The number of coordinates required will vary, depending on the complexity of the canopy shape. If the canopy is asymmetrical, characterize each side with X, Z coordinates. Measure or estimate the row ratio for the hedge (the length Y over width X). These values are used by FV2200 software to compute the foliage density or dripline LAI.
For asymmetrical canopies, LAI needs to be computed for each side of the canopy. LAI for the hedge is the average of LAI for both sides. A complete example, including sample data is presented in Example 7 - Isolated Tree.
Method 2
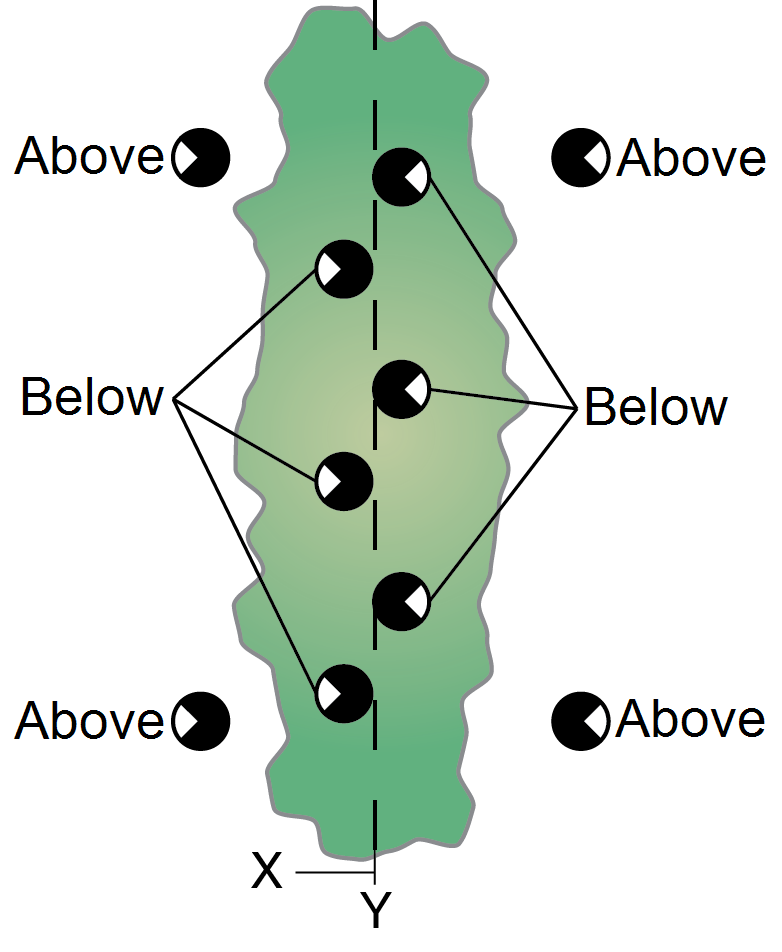
A simple way to measure LAI in a hedge is to take an A reading viewing the sky. Take a number of B readings on one side of the row or the other, making sure that the sensor “sees” through the hedge, as shown below. It is useful for both symmetrical and asymmetrical canopies.
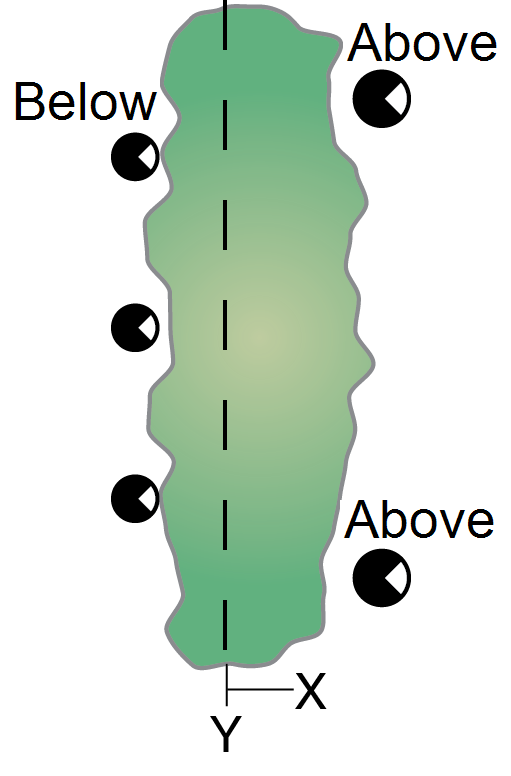
In addition to the above and below-canopy readings, measure X, Z coordinates to characterize the shape of the entire canopy, measure the distance between the sensor and the hedge centerline, (the X offset in meters), and the distance between the sensor and the bottom of the canopy, (the Z offset in meters). Measure or estimate the row ratio for the hedge (the length Y over width X). This information will be used in the FV2200 software to compute distances and LAI for the shrub. In the figure below, the sensor was held at the base of the canopy, resulting in a Z offset of 0.
This example is illustrated in Example 6 - A Simple Isolated Canopy.
Isolated Canopies and Scattering Corrections
The model used to do the scattering corrections in FV2200 ver. 2.0 is one-dimensional, while the geometry for an isolated canopy is clearly two or three-dimensional. That discrepancy is not a major issue for determining scattering from diffuse radiation. However, when Fbeam > 0 (i.e. when the sun is out), it can be a serious issue, since the actual path length for sunlight to reach the foliage along the path of a ring's view through the canopy is potentially much different in reality versus the model (see Figure E‑2).
Therefore, if it is possible to avoid direct sun when measuring isolated canopies (single tree, single row, etc.), then that is the best approach. If you do need to make measurements in direct sun, then the following steps should be taken to minimize the error in the scattering adjustment:
- Measure with the sun as high in the sky as possible.
- Work with the sun to the side or slightly in front of the sensor's view, while keeping the sun OUT of the sensor's field of view (see Figure E‑3)
- If you are measuring a canopy from the outside looking through (across a row, for example), have the sensor looking toward the shaded side of the canopy, not the sunlit side.