Theory of operation
The LI-600 is equipped to measure two different aspects of leaf photosynthesis. The porometer uses a mass balance for water vapor flux from the leaf to compute stomatal conductance. The fluorometer uses optical techniques to probe the quantum yield of photosystem II.
The LI-600 also has a GPS receiver and an accelerometer/magnetometer that measures the pitch, roll, and heading of a leaf. Those measurements, along with GPS information, are used by the LI-600 software to calculate a leaf's angle of incidence.
This section describes the theory and equations behind these measurements and provides an overview of other sensors in the LI-600.
Leaf porometer
The LI-600 porometer is a steady-state open flow-through gas exchange system. Stomatal conductance is computed from apparent transpiration measured in the leaf cuvette and leaf temperature. Apparent transpiration is computed from the water vapor differential across the leaf cuvette and the molar flow rate of air through it (Figure 9‑1).
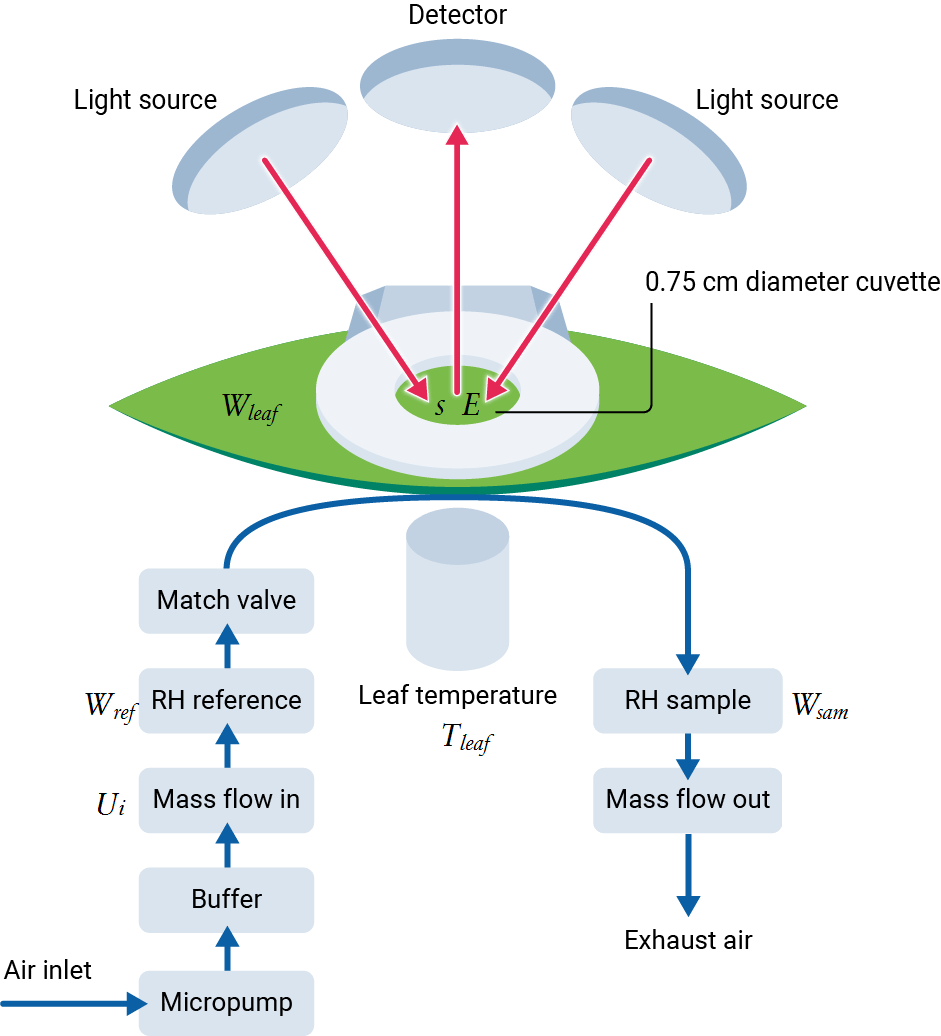
Relative humidity (RH) sensors on either side of the cuvette measure the air stream before and after it interacts with a leaf or needle. Flow rates are measured before and after passing through the cuvette, though only the flow rate of air entering the cuvette is used in the calculation of apparent transpiration. Leaf temperature is measured in the cuvette via a non-contact infrared thermometer (IRT).
Derivation of equations
Apparent transpiration and stomatal conductance from the LI-600 are both expressed on a per unit area basis and as such the sampled leaf area (sa) in the cuvette must be known. Other calculations in the instrument are dependent on leaf width (sw). Both leaf area and leaf width therefore must be known to make a measurement. Either leaf area or leaf width, not both, may be input by the user (see Measurement Settings), and the other is calculated:
9‑1

9‑2

Where aw is a ratio relating leaf width to projected area for a leaf crossing the full length of the cuvette.
| Symbol | Label | LI-600 | Units |
|---|---|---|---|
| aw | aw | 0.05890480 | dimensionless |
| sa | Leaf_area | 0.44178600 | cm2 |
| sw | Leaf_width | 7.50 | mm |
The mass balance of water vapor in an open system at steady state is given by:

where S is leaf area (m2), E is apparent transpiration (mol m-2 s-1), Mr and Ms (mol s-1) are molar flow rates into and out of the leaf cuvette, respectively, and Wr and Ws are water vapor mole fractions into and out of the leaf cuvette (mol H2O mol air-1).
Flow out of the cuvette (sample flow) in the LI-600 is not measured with sufficient precision to be used in the water vapor mass balance, and is accounted for by noting that:


Solving 9‑5 for E gives the mass balance used on the LI-600:

It is important to note here that the units in 9‑6 for most variables are different than the measurement units on board the instrument. Water vapor mole fractions in the LI-600 (wx) are reported in mmol H2O mol air-1, not mol H2O mol air-1 (wx = Wx 103), flow (μr) is reported in μmol s-1, not mol s-1 (μr = Mr 106), and area (sa) is in cm2, not m2 (sa = S 104).
Total conductance to water vapor (gtw, mol m-2 s-1) is given by:
9‑7

Where Wl (mol H2O mol air-1) is the mole fraction of water vapor in the leaf’s intercellular air space. Wl is calculated from saturated vapor pressure (e(T), kPa) at the leaf temperature (T = Tl, C) following Buck (1981):

9‑9

And atmospheric pressure (P, kPa):
9‑10

Calculation of stomatal conductance (gsw, mol m-2 s-1) from gtw requires separating boundary layer conductance (gblw, mol m-2 s-1):
9‑11

Boundary layer conductance
Boundary layer conductance in the LI-600 is characterized as a function of flow rate through the cuvette (μr, μmol s-1) using a temperature controlled water source where gblw is assumed to be the only limitation to E.
9‑12

| Symbol | Label | LI-600 | Units |
|---|---|---|---|
| Bla | Bla | 0.0 | dimensionless |
| Blb | Blb | 0.02923020 | dimensionless |
| Blc | Blc | 0.0 | dimensionless |
| Bld | Bld | 0.0 | dimensionless |
| Ble | Ble | -0.00006755 | dimensionless |
Water vapor sensors
Water vapor measurements in the LI-600 are made using a pair of relative humidity (RH) sensors. Voltage output from each of these sensors is related to relative humidity (rhx, %) through a unique polynomial fit determined at the factory:

9‑14

Where arhx, brhx, crhx, and drhx are the factory calibration coefficients of the polynomial fit, Tref is the reference temperature measured by a thermistor embedded in the block adjacent to the RH sensors and yrhx is the sensor voltage (Vrhx, volts) corrected for zero (Zrhx) and span (Srhx) offsets:
9‑15

9‑16

Initial values for both the zero and span offsets (both nominally 1.0) are determined at the factory but can be adjusted by user calibration (see Calibrating the sensors).
There is a residual temperature dependence in the zero adjustment that is calculated from a linear fit to Tref using two additional factory determined coefficients (mx and bx):
9‑17

9‑18

To reduce errors in the mass balance a cross-calibration, known as matching, is done between the reference and sample RH measurements. Match adjustment (rhadj, %) is calculated as the mean difference between the reference and sample RH measurements when the instrument is in match mode:
9‑19

This adjustment is applied to the raw, uncorrected, sample RH measurement (rhsraw) to get the sample RH (rhs) reported by the instrument (see Match mode):
9‑20

Water vapor mole fraction (wx, mmol H2O mol air-1) in the reference and sample air streams is calculated by first converting the measured RH to vapor pressure (Pvx, kPa):
9‑21

9‑22

Where e(Tref) is the saturation vapor pressure at Tref calculated following 9‑8 (T = Tref). Mole fraction is then given from the ratio of the vapor pressure to atmospheric pressure (P, kPa):
9‑23

9‑24

Flow sensors
Flow in the LI-600 is determined using a pair of flow sensors positioned to measure flow entering the cuvette (μr, μmol s-1) and that exiting it (μs, μmol s-1). Voltage output from each of these sensors is related to molar flow rate through a unique polynomial fit determined at the factory:
9‑25

9‑26

Where aμx, bμx, cμx, and dμx are the factory calibration coefficients of the polynomial fit and yμx is the flow sensor voltage (Vμx, volts) corrected for zero (Zμx) and span (Sμx) offsets:


Initial values for the zero (nominally 0.6) and span (nominally 1.0) offsets are determined at the factory but can be adjusted by user calibration (see Flow sensors).
Leaf temperature sensor
Leaf temperature (Tl, C) is computed from Tref and the IRT voltage (Vl, volts) using a set of factory determined calibration coefficients (aTl to gTl):
9‑29

PAR sensor
Photosynthetically active radiation (Qamb, μmol photons m-2 s-1) is measured with a photodiode. Voltage output by the photodiode (VQ, volts) is related to Qamb using a single factory determined calibration coefficient (Qcoeff) and a user-settable zero adjustment (ZQ):
9‑30

Vapor pressure deficit
Vapor pressure deficit (VPD, kPa) is calculated as the difference between the saturation vapor pressure in the leaf (e(Tl) and the vapor pressure in the cuvette (Pvs):
9‑31

Leak rate
The cuvette leak rate (L, %) is calculated from the difference in flow across the cuvette:
9‑32

Note that due to the difference in accuracy between the reference and sample flow sensors, the reported leak rate at times may be greater than 100% when the cuvette is open or empty, and less than 0% when sealed. This behavior does not impact quality of any measured parameter.
Stability criteria
A measurement is considered stable based on monitoring changes over time to both the computed stomatal conductance gsw, and the de-modulated fluorescence signal F. In a given configuration, a user selects which variables to monitor (gsw, F or both) and a stability limit, and the periods over which to calculate the change. Since the LI-600 is designed for rapid survey measurements, the time period is limited to 1, 2, or 4 seconds.
The LI-600 retains up to 4 seconds of 2 Hz data to calculate stability criteria as follows:
9‑33

9‑34

9‑35

where X is either the computed stomatal conductance gsw, or the de-modulated fluorescence signal F if a fluorometer is used, and t is the time for a given measurement.
Since a limited number of data points (2, 4 or 8) are used, the stability criteria is not a regression slope, but represents the amount of change in the parameter over the selected time period. When two consecutive data points are below the threshold of the slope limit, then the measurement is considered stable.
User calibration procedures
Users can adjust calibrations for the flow sensors (zero only) and the RH sensors (zero and 1-point span). See also Calibrating the sensors.
RH sensor zero
Resetting the zero set-point on an RH sensor will alter the offset parameter for a given sensor. A prerequisite to starting a calibration is access to tank air or a column of chemical to scrub H2O from the airstream. Ensure dry conditions prior to resetting a zero, which can take 30 minutes or more of flowing dry air across the sensors.
Upon initiation, the calibration routine averages 10 seconds of data for Tref and Vx and then recalculate the zero intercept:
9‑36

After calculating bxnew, the user must confirm the new setpoint. The new value will then stored to memory.
RH sensor span
Resetting the span setpoint is an adjustment of the parameter Sx. A prerequisite to starting a calibration is access to a known H2O source, such as a dewpoint generator. The known quantity might be in a dewpoint temperature, or potentially in mole fraction units. The software will accept either unit and convert to the correct relative humidity at the sensor, with Press coming from the LI-600 pressure sensor and Tref coming from the LI-600 reference thermistor.
The span setting requires all calibration parameters for a given sensor, as well as rhtrue, current reference temperature Tref and the voltage of the sensor Vx.
Upon initiation, the calibration routine averages 10 seconds of data for Tref and Vx and then re-calculate the span
9‑37

where Tref and Vx are the current values read by the RH and temperature sensors, and mx and other parameters are the current calibration values for the sensor. After calculating Sxnew, the new value is stored to memory.
Flow sensors zero
Resetting the zero setpoint on a flow sensor will alter the offset parameter for a given sensor (Zμx in 9‑27 and 9‑28). If you select the option to zero the flow sensors, the software powers down the pump and the blower before resetting the zero. The calibration routine averages 10 seconds of data for Vμx to determine the new zero:
9‑38

9‑39

Fluorometer
The LI-600 fluorometer is a Pulse-Amplitude Modulated (PAM) fluorometer with a measuring beam provided by two LEDs focused on the portion of leaf in the porometer cuvette. Fluorescence is detected via a single detector located between the LED measuring beams, filtered by a 740 ± 40 nm band-pass filter. Fluorescence is detected then from ~700 to 780 nm, which gathers the majority of fluorescence from PSII but is also contaminated with PSI fluorescence in a similar fashion to the LI-6800 Portable Photosynthesis System fluorometer (Genty et al., 1989, Pfundel et al., 2013).
Actinic light is not provided by the LI-600 fluorometer but rather by ambient light which could be natural sunlight or any number of artificial light sources. The two LEDs are both modulated at a constant frequency and provide both the measuring beam and saturating flash. One unique aspect of the design is that the saturating flash is not delivered as a constant output but is modulated at high frequencies to achieve the necessary high light intensity. The use of both LEDs for providing the measuring beam and saturating flash has a few advantages over using a single LED for each purpose, including improved light uniformity from light reaching the leaf from multiple angles and increased peak intensity for the measuring beam, leading to 3) improved signal-to-noise ratio.
Maximum fluorescence and saturating flashes
The LI-600 can perform two types of saturating flashes, either a traditional rectangular flash to measure Fm or Fm’, or a MultiPhase Flash™ (MPF) to measure Fm’. MPF is typically used in situations where achievable flash intensities are either too low to be saturating or may be damaging to the leaf (see Loriaux et al., 2013). MPF is the flash type in the pre-loaded factory default configurations.
A rectangular flash is of a single fixed intensity (Qflash, μmol photons m-2 s-1) held for a single fixed duration. Fm or Fm’ is taken as the maximum de-modulated fluorescence signal (F, dimensionless) observed during the flash.
An MPF is split into three phases, each of an independent duration. The first and third phases are similar to a traditional rectangular flash and are both of a fixed intensity. Fm’ is calculated using only fluorescence observed during the second phase. During the second phase a linear ramp, of a user specified depth, is applied to the flash intensity. Fm’ is calculated from the intercept of a linear regression of F over 1/Qflash during the linear ramp in flash intensity.
While the target Qflash is a user specified parameter in the configuration, reported values are calculated from the modulation rate (f, Hz) and the width of each modulated pulse:

Where τ is a cuvette specific transmission factor (1.0 for the LI-600) and Qpeak (μmol photons m-2 s-1) is the combined output of the LEDs:
9‑41

Qx is calculated from each LED’s digital to analog converter setpoint (VDACx) and calibration factor (Qcoeffx), both determined at the factory:
9‑42

9‑43

Modulation rate during the flash is calculated from the target Qflash specified in the instrument configuration as:
9‑44

Minimum and steady-state fluorescence
Minimum fluorescence in the dark (Fo) and steady-state fluorescence in the light (Fs) are measured when only a low frequency (4 to 8 Hz) modulated light is applied to the leaf. Logged values for both are taken as the last value of the de-modulated fluorescence signal before the saturating flash is initiated. The light intensity during the modulation is calculated from the user specified modulation frequency analogously to the intensity during the flash (9‑40).
The de-modulated fluorescence signal (F, dimensionless) used to determine Fo and Fs can be subject to measurement biases that arise from imperfect discrimination of the fluorescence signal and noise from the measurement circuitry. A user settable zero adjustment (ZF) is applied to the raw voltage from the fluorescence detector (VF) compensate for this:
9‑45

Fluorescence output parameters
The LI-600 calculates one of two fluorescence yields depending on the instrument configuration. Because the LI-600 uses ambient light as its actinic source, the instrument must be told by the user whether the fluorescence measurements will be light- or dark-adapted and measurements must be made in a light environment that matches the instrument configuration (e.g., don’t try to make dark-adapted measurements at mid-day outside, or light-adapted measurements at night).
When configured for dark-adapted measurements the LI-600 reports the maximum quantum yield (Fv/Fm, dimensionless):
9‑46

And when configured for light-adapted measurements, it reports the operating efficiency of PSII (ΦPSII, dimensionless):
9‑47

Additionally, when configured for light-adapted measurements the LI-600 will make an estimate of linear electron flow (ETR, μmol electrons m-2 s-1) from ΦPSII:
9‑48

Where α (dimensionless) is light absorption by the leaf under the measurement (actinic) lighting and pPSII/PSI (effectively dimensionless) is a proportioning coefficient that describe the partitioning of absorbed photons between PSII and PSI. On the LI-600, α is set by default to 0.8, but can (and should) be adjusted by the user for their specific plant material and light source. pPSII/PSI is set by default to 0.5. Where the user has a more appropriate value, it too can be adjusted.