LCF Reference
Programming Commands
The commands listed in Table 27‑14 can be used in LPL programs (such as AutoPrograms) to perform fluorescence related tasks. For control commands, see Leaf Chamber Fluorometer Control on page 25-21 and LCF Control Functions on page 25-30 in the instruction manual.
Fluorescence Compute List
The default LCF compute list is named “Std Flr Comp_6.1”, and is listed below
##”/User/Configs/Comps/StdComps_6.1”
##”/User/Configs/comps/FlrOnly”
It essentially links two other compute lists together (this ability is new to OPEN 4.0). The first file, StdComps_6.1, is listed in The Default ComputeList on page 15-38 in the instruction manual. The second file Flr Only adds the fluorescence variables, and it is listed below.
##4201F1 “Fv” “Fm-Fo”
“ flr_m - flr_o “
##4202F3 “Fv/Fm” “Fv/Fm”
“ #4201 / flr_m “
##4205F3 “BlueAbs” “Leaf abs in blue”
“ UCON(0.85) “
##4206F3 “RedAbs” “Leaf abs in red”
“ UCON(0.85) “
##4207F3 “LeafAbs” “Leaf absorptance”
“ (bluePct * #4205 + (100 - bluePct) * #4206)/100 “
##4208F1 “PARabs” “Absorbed PAR” “ parIn_um * #4207 “
##4210F1 “Fv’” “Fm’ - Fo’”
“ flr_mp - flr_op “
##4211F3 “Fv’/Fm’” “Fv’/Fm’”
“ #4210 / flr_mp “
##4212F3 “PhiPS2” “(Fm’-Fs)/Fm’”
“ (flr_mp - flr_s)/flr_mp “
##4213 “Adark” “Dark photo value”
“ UCON(-1) “
##4215F3 “PhiCO2” “(A-Ao)/(aQ)”
“ (#30 - #4213)/(#4208) “
##4216F3 “qP” “(Fm’-Fs)/(Fm’-Fo’)”
“ (flr_mp - flr_s)/(flr_mp - flr_op) “
##4220F3 “qN” “(Fm-Fm’)/(Fm-Fo’)”
“ (flr_m - flr_mp)/(flr_m - flr_op) “
##4221F3 “NPQ” “(Fm-Fm’)/Fm’”
“ (flr_m - flr_mp)/flr_mp “
##4222 “PS2/1” “Photosystem Distribution Factor”
“ UCON(.5) “
##4223F3 “ETR” “Electron Transport Rate”
“ #4212 * #4222 * #4207 * parIn_fs”
##4231F3 “qP_Fo” “(Fm’-Fs)/(Fm’-Fo)”
“ (flr_mp - flr_s)/(flr_mp - flr_o) “
##4232F3 “qN_Fo” “(Fm-Fm’)/(Fm-Fo)”
“ (flr_m - flr_mp)/(flr_m - flr_o) “
Leaf Absorptance
The standard fluorescence ComputeList (Fluorescence Compute List) allows leaf absorptance to be a function of the fraction of blue light. Therefore, two user constants are defined (RedAbs and BlueAbs), and the LeafAbs variable computed from

where α is effective leaf absorptance, αblue and αred are absorptances in the blue and red, and B is the percentage (0-100) of incident light is that is blue. Table 27‑15 shows some a sampling of absorptances. The blue tends to be a bit higher than the red. The values in the table are computed by integrating the product of the spectral irradiance S(λ) of the LED with the spectral absorptivity of the leaf α(λ), and dividing by the integrated spectral irradiance.
27‑19

| Species | αblue | αred |
|---|---|---|
| Maize | 0.90 | 0.85 |
| Bean | 0.91 | 0.83 |
| Jasmine | 0.92 | 0.87 |
| Orange | 0.94 | 0.93 |
The leaf absorptance variable is used in computing electron transport rate ETR (equation 27‑12) and ΦCO2 (Equation 27‑11.
To set the values of RedAbs and BlueAbs, do one of the following:
- Config Menu|View/edit, navigate to the node <FlrSettings> <Constants>, or
- Press Sys&User Consts (f3 level 3) in New Measurements mode, or
- Press Flr Editor (f2 level 8) in New Measurements mode.
LCF Boundary Layer Conductance
The boundary layer information for the LCF is contained in the file “/Sys/Lib/BlcTable_LCF”, which is listed below:
LCF, broadleaves. 7/19/01
BLCTABLE= 0.48 2
0.58 0.14
3.73 1.92
4.65 2.29
5.36 2.94
5.89 3.39
6.46 3.72
For an explanation of the BLCTable format, see Figure 14-5 on page 14-21 in the instruction manual.
Simultaneous Gas Exchange and Fluorescence
The phrase ‘simultaneous gas exchange and fluorescence measurements’ raises a question: What is happening to the gas exchange measurements while fluorescence measurement events (saturating flash and/or dark pulse) are occurring? Obviously, a flash or several seconds of darkness is not going to leave steady state photosynthesis unaffected, so how are these possible interactions accommodated?
The fundamental fluorescence measurement is the raw, real-time signal (mV) coming from the LCF. This is labelled F, and can be found on display line m. It is measured simultaneously with the gas analyzers, temperatures, and other signals that go into the gas exchange measurements and computations. When a fluorescence event comes along, all gas exchange measurements cease for the duration of the event, while the fluorescence measurement (and the ParIn_μm value) continues. At the end of the event, one final computation is done, and if logging is active, all of the gas exchange and fluorescence computations are written to the log file.
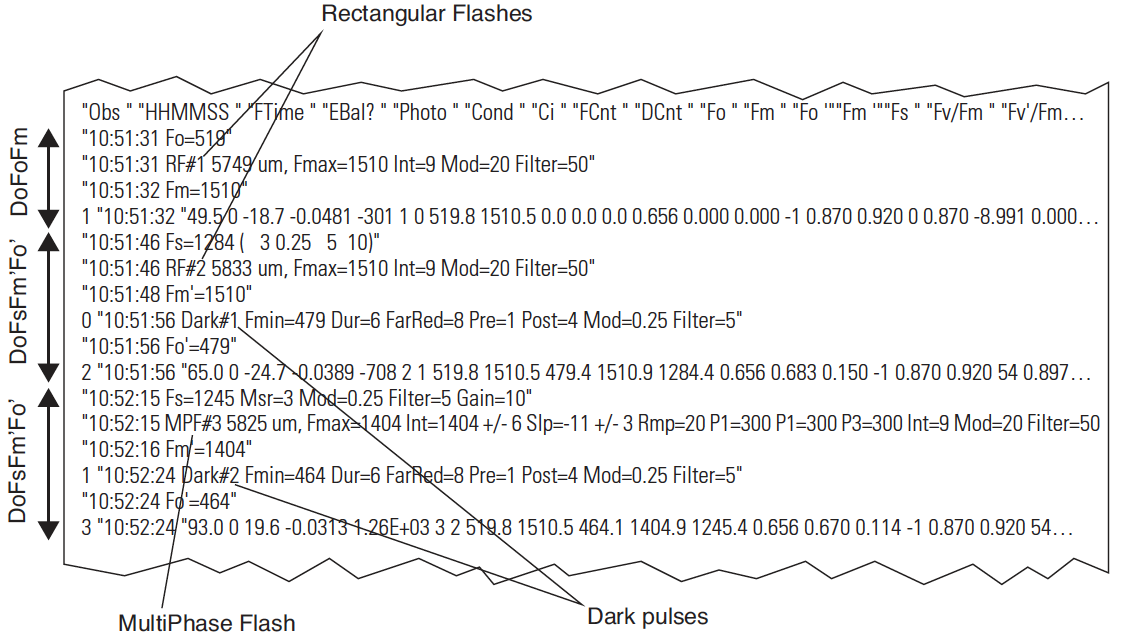
Example: Do Fs Fm’ (f3 level 0)
This keystroke (or the corresponding command in an AutoProgram) is supposed to capture the steady state fluorescence value, the state of the gas exchange parameters, do a saturating flash, and add a data record to the log file (if it is open) that captures all of this information in one line. How does it happen?
Here is the sequence of events:
- Fs is set.
- System variable Fs (display line o) is set to the current value of F.
- Normal events stop
- “Normal events” refers to the updating of new raw readings and system variables every second, and computing user variables every 2 seconds. With the exception of raw fluorescence and the parIn_mV value, no raw readings will update until the end of Do Fs Fm’.
- Saturating Flash
- The system variable Fm’ (display line o) is set to the maximum value of F during the flash.
- Compute and Log
- If a log file is open (not Fluorescence Recording, but normal data logging), user computations are done prior to the data being written to the file. This effectively updates all fluorescence-related quantities, such as PhiPS2. Every item in the compute list is recomputed, including the gas exchange related values. They will not change, however, since the latest gas exchange related readings haven’t changed since Step 2.
- Normal events resume.
- Regular readings and computations resume.
- Figure 27‑73 shows a sample data file in which data was logged by fluorescence events. In this case, the first observation was made on a dark adapted leaf, and was triggered by DoFoFm, which captures the minimal fluorescence value, does a saturating flash, and assigns the maximal fluorescence to Fm. Note that each of these actions puts one or more remarks into the data file indicating what happened. The gas exchange data (e.g. the photosynthetic rate of -0.73) reflect what was happening just prior to the fluorescence event.
Hint: The LCF generates a lot of remarks. If you do not want these intermingled with your data, they can be routed to a separate file. See Log Options on page 9-15 in the instruction manual.