Getting Started
If you are new to fluorescence, read Background Information on page 27-3. To get up and running with the LCF, follow these steps:
- Install the Hardware and Software
- If the LCF has not yet been installed on your LI-6400, follow through Installing the LCF.
- Make sure the LCF is working properly
- Work through the Basic Functionality Test.
- Calibrate the light source
- This is described in Calibrate....
Also note these important sections:
- Operational Summary
- A summary of the controls, displays, and utilities available when configured for the LCF.
- Changing Control Parameters
- A discussion of the various LCF settings, what they mean, and what are right for you.
- Basic Experiments
- A step-by-step guide through some simple experiments, designed to acquaint you with proper operation of the LCF.
Background Information
What is fluorescence?
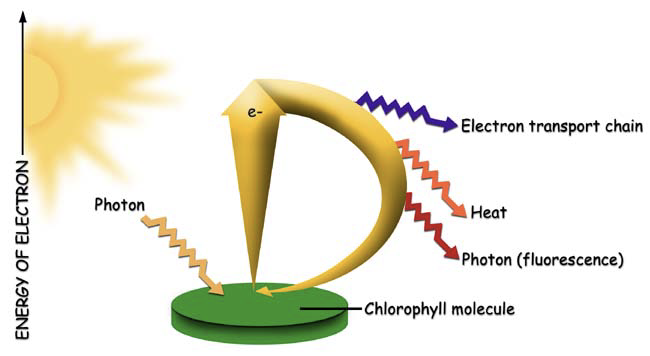
When a quantum of light is absorbed by a molecule of chlorophyll, the whole energy of the quantum is transferred to the valence electrons of the chlorophyll, raising them to an excited state. The electrons return rapidly to their ground level, releasing the absorbed energy in one of three pathways: 1) fluorescence, 2) heat, or 3) electron transport associated with photosynthetic photochemistry (Figure 27‑1).
This relationship can be expressed as:

Where fluorescence (F), heat (H), and photochemistry (P) are each given as a fraction of the total absorbed quanta, which is assumed to be 1. P is also known as quantum yield or efficiency. As the light incident on a leaf increases, P decreases while H and F increase. At a saturating light intensity, there will be no further increase in photochemistry with any further increase in light intensity, so P will be zero. When this occurs, F and H will be at their maximal values, Fm and Hm, respectively. If we assume that all of the de-excitation is through heat and fluorescence, then Equation 27‑1 becomes:

So

If we also assume that the ratio of heat to fluorescence de-excitation does not change during a short saturating flash

Then it follows that:

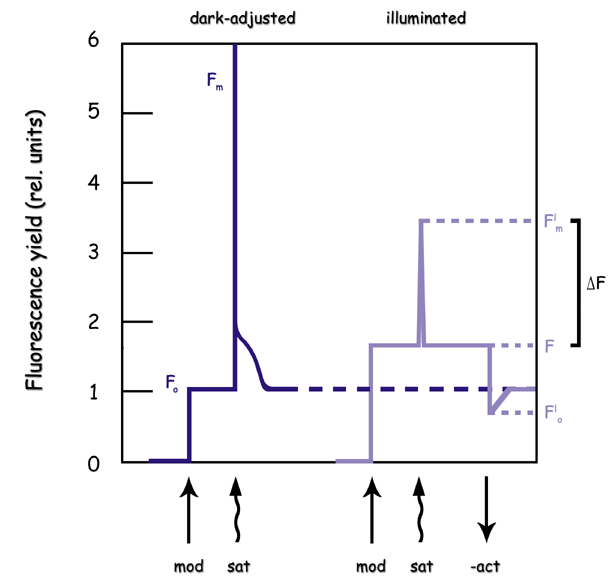
By making two measurements of fluorescence (Figure 27‑2), one (F) in non-saturating light conditions and the other (Fm) under saturating light conditions, we can solve for H in Equation 27‑5) and P in Equation 27‑1.


This simplifies to

If the non-saturating light condition is total darkness, and the leaf is completely adapted to that darkness, Equation 27‑7 takes the form1

where Fo is known as “minimal fluorescence”, or the dark-adapted fluorescence value. Pdark, the fraction of absorbed photons that are used for photochemistry for a dark adapted leaf, is usually written Fv/Fm. For healthy plants, Fv/Fm is between 0.75 and 0.85. Pdark is usually referred to as the maximum or optimal quantum yield.
By contrast, if the non-saturating light is non-zero, and the leaf is completely adapted to it (photosynthesis at steady-state), Equation 27‑6 takes the form

where Fs is “steady-state” fluorescence, and Fm’ is the maximal fluorescence during a saturating light flash. Plight, the fraction of absorbed photons that are used for photochemistry for a light adapted leaf, is usually written or ΔF/Fm’ (Figure 27‑2). Plight is usually referred to as the effective quantum yield.
A similar relationship that is sometimes used is

which is the efficiency of energy harvesting by oxidized (open) PSII reaction centers in the light. It requires Fo’ which is the minimal fluorescence of a light adapted leaf that has momentarily been darkened.
Quantum yield can also be inferred from gas exchange measurements, and is given the symbol ΦCO2

where A is assimilation rate, Adark is dark assimilation rate (both with units of μmol CO2 m-2 s-1), I is incident photon flux density (μmol m-2 s-1), and is leaf absorptance. Adark is the same magnitude, but opposite sign, of dark respiration rate.
The actual flux of photons (μmol m-2 s-1) driving photosystem II (PS II) can be inferred from chlorophyll fluorescence measurements. This is called electron transport rate (ETR), and is given by

f is the fraction of absorbed quanta that is used by PS II, and is typically assumed to be 0.5 for C3 plants, and 0.4 for some C4 plants like maize (Earl and Tollenaar, 1998).
Photochemical quenching qP of fluorescence can be computed from

Photochemical quenching includes photosynthesis and photorespiration, and tends to be largest in low light, since that’s where leaves use light most efficiently. Non-photochemical quenching qN of fluorescence includes mechanisms such as heat dissipation, and is computed from

qN is highest when light intensities are high, perhaps reflecting a plant protection mechanism to avoid over-energization of the thylakoid membranes. A similar measure of non-photochemical quenching that is sometimes reported is

Some researchers prefer to use Fo rather than Fo’ in the calculation of qp and qN.
27‑16

27‑17

The LI-6400 computes these alternative forms as well (starting in OPEN version 5.2), but by default does not display or log them. The user can add or replace them on the display and in the log file as desired. See Display Editor on page 6-6 in the instruction manual, and Determining What is Logged on page 9-9 in the instruction manual.
What is the 6400-40 LCF?
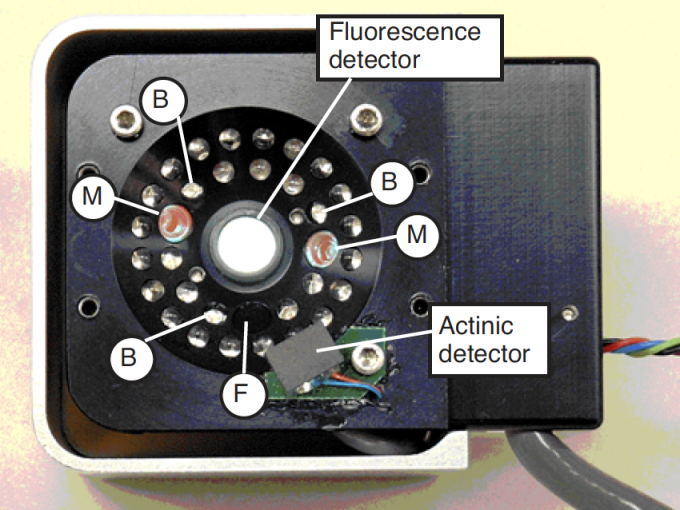
The LCF is an LED based fluorescence/light source attachment for the LI-6400. It contains a variety of LEDs (3 blue, 1 far red, and the rest red) and two detectors (Figure 27‑3). Here is an outline of how it works:
Measuring Fluorescence
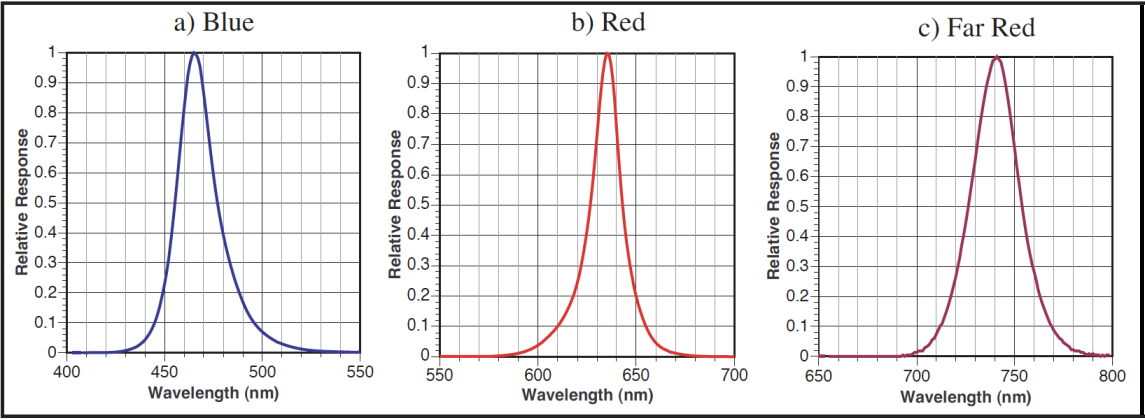
The LCF uses two red LEDs (center wavelength about 630 nm - see Figure 27‑4) and a detector to measure fluorescence. The LEDs are modulated (turned on and off) very rapidly, at your choice of 0.25, 1, 10 or 20 kHz. This modulated red light is referred to as “the measuring light”. The resulting oscillation of incident radiation causes an oscillation in fluorescence which is detected by LCF.
Why the range of modulation frequencies? There is a trade-off: At the lowest frequency, the photosynthetically active radiation being contributed by the measuring beam is much less than at high frequencies, because the LEDs are being turned on relatively infrequently - only 250 times per second. When measuring minimal fluorescence in a dark adapted leaf (Fo in Equation 27‑8), it is important that the measuring light not induce photosynthesis in the leaf. The problem with 250 Hz, however, is that there are only 250 measurements of fluorescence being made each second, so the final fluorescence value is relatively noisy due to the limited number of points in the average. By contrast, during a saturating flash one doesn’t care about contributions of the measuring beam to photosynthesis, so 20 kHz modulation can be used. This provides 20,000 samples per second to work with, and the resulting fluorescence signal is much quieter.
The LCF also has software selectable filtering (averaging) of the fluorescence signal. The choices are bandwidths of 0.5, 1, 5, 10, 20, 50, 100, and 200 Hz. Most of the time, 0.5 or 1 Hz can be used, but during saturating flashes when the fluorescence signal is changing fast, 20 or 50 Hz bandwidths are preferred.
Saturating Flashes
Maximal fluorescence - which is measured during a brief period when the photosystem is light saturated - is a key element of fluorometry, and the LCF achieves these light levels (> 7000 μmol m-2 s-1) by using 27 red LEDs (center wavelength: 630 nm. See Figure 27‑4). PAR levels during saturating flashes are monitored by a calibrated light sensor within the LCF.
Actinic Light
“Actinic” refers to the light provided by the LCF for purposes of driving photosynthesis. The LEDs used for providing actinic radiation are the same ones used for saturating flashes, plus 3 blue LEDs (470 nm). As a light source, the LCF functions much the same as the 6400-02B Red/Blue light source, but with an interesting additional capability: the red and blue are independently controlled. The maximum blue quantum flux achievable is typically about 200 μmol m-2 s-1, so the maximum blue fraction can be about 10% of full sun. The LCF’s built-in light sensor can be used to control in-chamber PAR levels to specified target values.
Rapid Dark Adaptation
Measuring the minimal fluorescence of a light adapted leaf involves turning off the actinic light briefly while using the far red LED (center wavelength at 740 - see C in Figure 27‑4). We refer to this event as a “dark pulse”. The far red radiation drives PS I momentarily to help drain PS II of electrons.
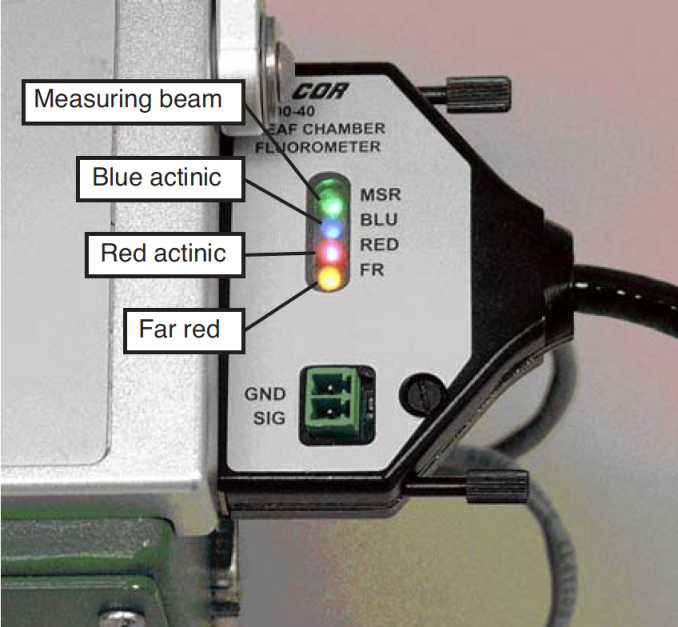
Status LEDs
The 37-pin connector for the LCF has 4 status LEDs that light up when the corresponding LEDs in the LCF are illuminated. The exception to this is during a saturating flash, when all 4 LEDs are illuminated. Also, just before and after a flash, the 4 status LEDs briefly flicker.