
Operational Summary
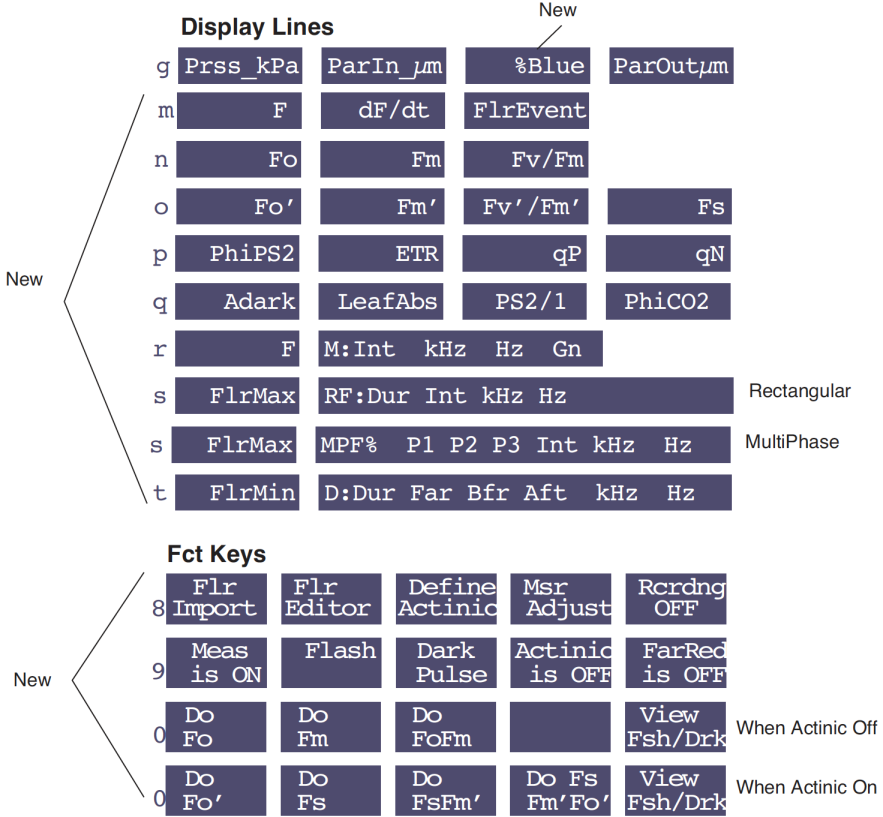
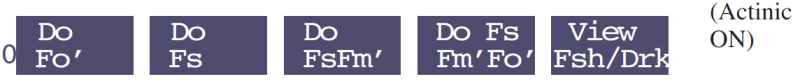
Figure 27‑17 summarizes the changes to the New Measurements Mode displays and function keys associated with the LCF.
The LCF as a Light Source
Note: The light source control options described here are available whenever the LI-6400 is configured for operating the LCF. That is, when the light source is specified as the 6400-40 LCF. If you specify the 6400-40 as the light source (via Specifying the Light Source on page 8-4), you are given a choice of using the LCF as a fluorometer, or as a light source only. If you choose the latter, only the light source control options are available in New Measurements mode, and all of the fluorometer controls (function key levels 8, 9, and 0) are hidden.
Caution: Do not operate the LCF by specifying it in the Light Source Control panel as a 6400-02 Red/Blue Source. This configuration will light the LEDs, but no internal light sensor feedback will be measured, and the LCF could operate, unbeknownst to you, for extended periods at full intensity. This will rapidly reduce its maximum flash potential.
The light source control panel in New Measurements (accessed by f5 level 2) also works for the LCF. Red and Blue LEDs are independently controlled, allowing operation with a blue value that is either specified in (μmol m-2 s-1) or as a proportion of the total. In addition, there is a function key that immediately turns the lamp on and off (Actinic is ON/OFF, f4 level 9), and one that pre-sets the desired actinic target without actually turning it on (Define Actinic, f3 level 8). The standard control panel for the light source (described in Light Control on page 7-19 in the instruction manual) looks slightly different when the LCF is selected as the light source (Figure 27‑18).
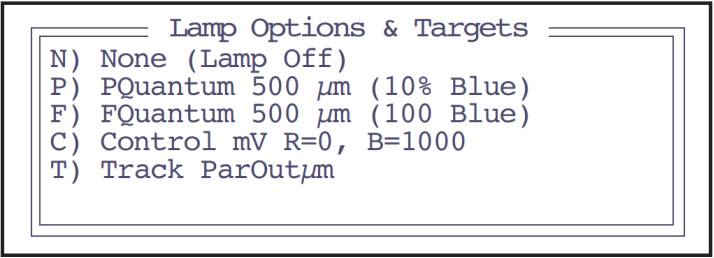
The 5 options presented in the control panel are described in Table 27‑1.


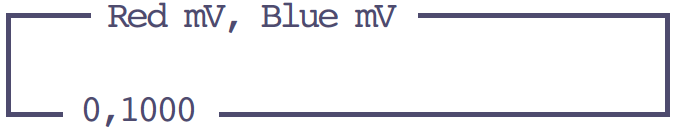
Three of the control options (P, F, and C) have two target values. One can enter both of these values, separated by a space or comma, to set both targets. If only one number is entered, it is taken to be the first target (total, or red). If the entry is a comma followed by one value, that value is used for the second target (blue) (Table 27‑2).
| Entry | Total (P and F), or Red (C) | Blue Target |
|---|---|---|
| 500, 50 | 500 | 50 |
| 800 100 | 800 | 100 |
| 1000 | 1000 | unchanged |
| ,80 | unchanged | 80 |
The Tracking option (T) gets the target value from an external sensor or user defined channel. Normally, one would choose the external quantum sensor for the target, but if one wanted the light value to be two times larger than ambient, for example, one could set up a user defined variable that computes and tracks that variable. Tracking mode sets the light source in proportional blue mode, and the user specifies the desired blue fraction.
Measuring Fluorescence
When the fluorescence measuring beam is turned on (f1 level 9), the raw fluorescence signal can be viewed on display line m, under the label F.
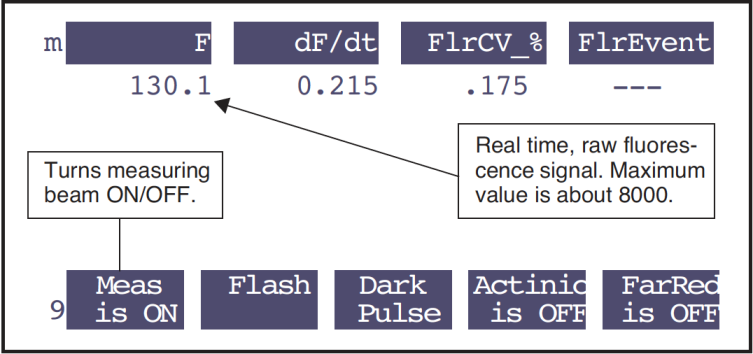
When the chamber is empty, or when the measuring beam is turned off, F should be near 0 (say, +/- 5). If it is not, the zeroing routine should be executed (Zero Fluorescence Signal). The maximum value that F can be is typically about 8000. (Technical aside: The raw output is generally about -3000mV, and is being measured on a -5V to +5V channel, hence the 8000 maximum. The final F value is the raw signal plus an offset.)
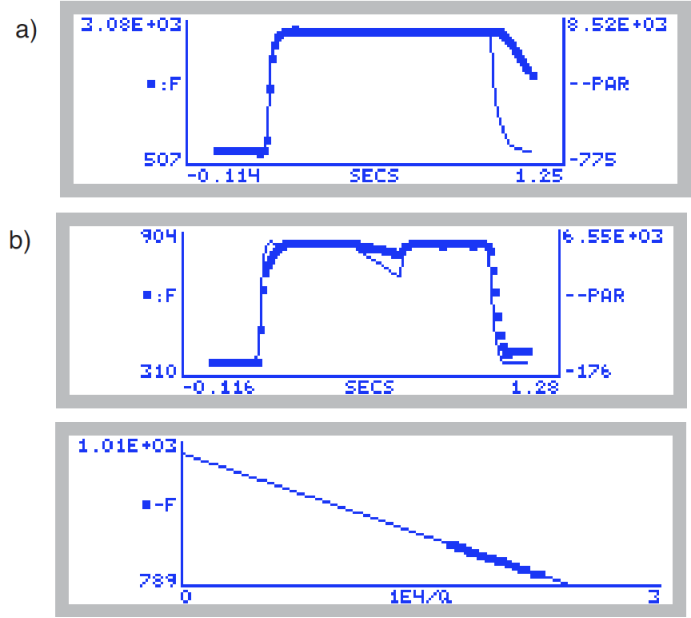
Saturating Flashes
The LI-6400 (version 6.0 and above) supports two types of saturating flash: rectangular and multiphase (Figure 27‑20). A rectangular flash provides a saturating pulse of light for a short duration, and the software looks for the maximum value of fluorescence during that pulse. With this method, one assumes that the pulse is strong enough to actually saturate, although this is testable with a simple experiment (see Optimum Flash Intensity). The multiphase flash uses three different intensities during the flash, and computes the fluorescence at saturation from the y-intercept of a plot of fluorescence vs. 1/intensity. There is a careful procedure that goes along with using the multiphase flash: see Using the MultiPhase Flash Protocol.
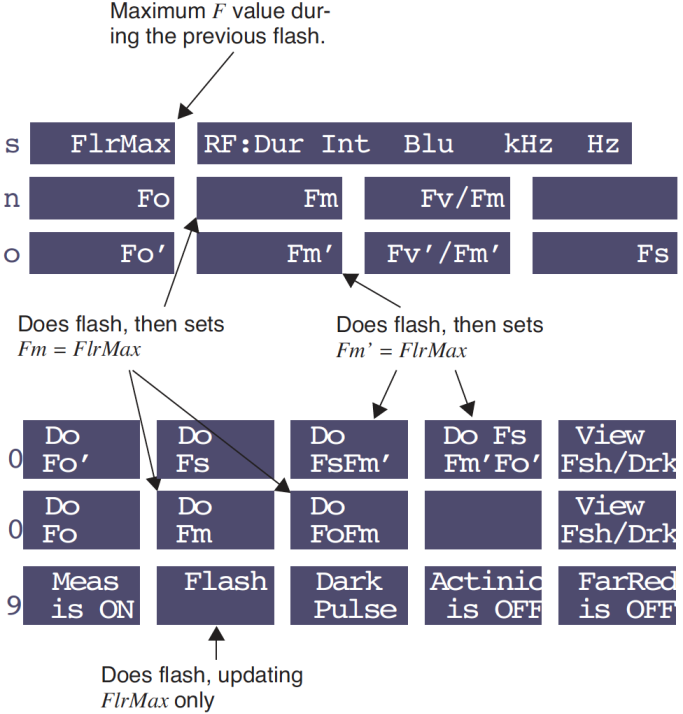
There are several ways to trigger a saturating flash (Figure 27‑21). If the leaf is dark adapted and you wish to get a new value for the system variable Fm (maximal fluorescence for a dark adapted leaf), press Do Fm or Do FoFm (f2 or f3 level 0). If the leaf is light adapted and you wish to set the value of system variable Fm’ (maximal fluorescence of a light adapted leaf), press Do FsFm’ or Do FsFm’Fo’ (f3 or f4 level 0). To do a flash without assigning any values, press Flash (f2 level 9).
WARNING: Saturating flashes can be extremely bright, and harmful to the eye if the LEDs are viewed directly.
Dark Pulses
A “dark pulse” (brief dark period) is designed to measure Fo’ on a light adapted leaf. Figure 27‑22 illustrates the timing parameters.
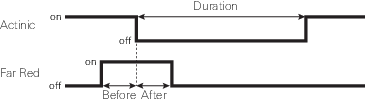
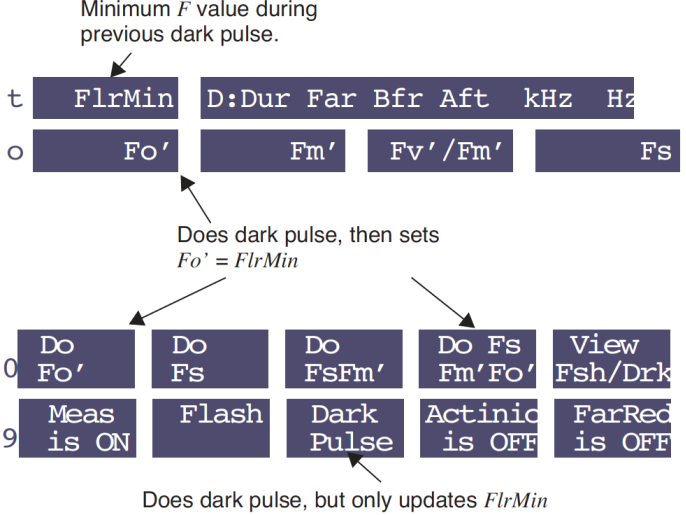
Figure 27‑23 illustrates how to trigger a dark pulse.
Viewing Flash and Dark Pulse Details
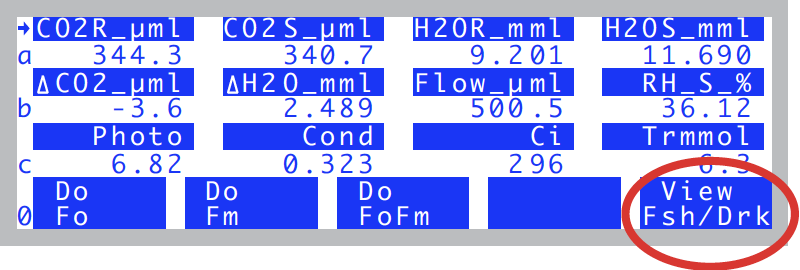
Once a saturating flash or dark pulse has been applied, you may view the flash shape and details via View Fsh/Drk, f5 level 0 ().
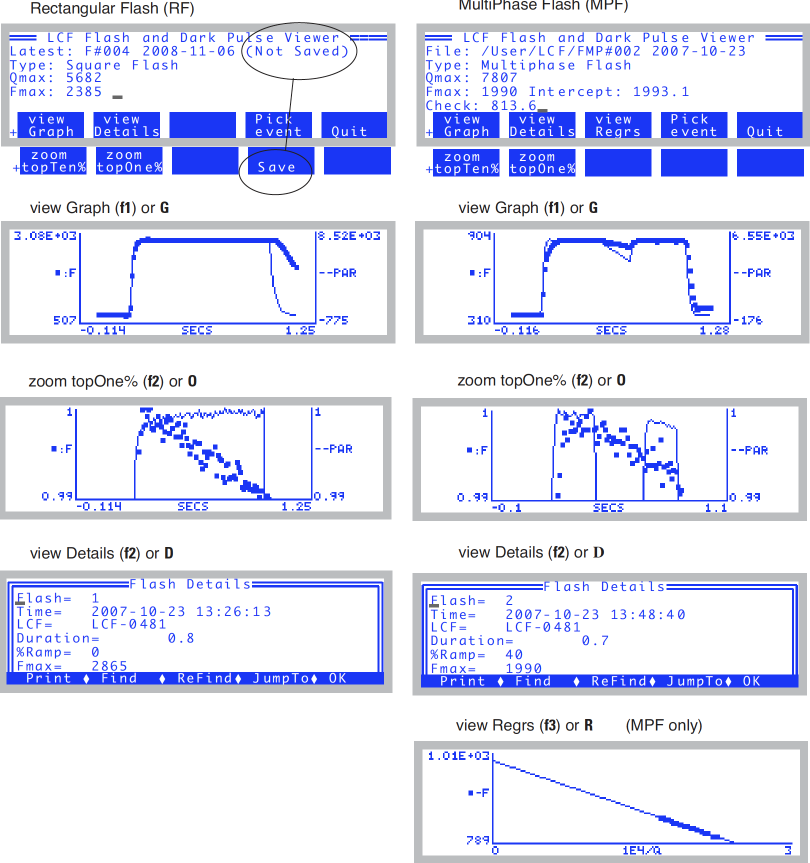
A summary of the flash viewer functions is shown in Figure 27‑25. The flash viewer screen shows the saturating flash file name, which includes the flash number, type (RF= rectangular, MPF= multiphase), the maximum light intensity (Qmax) and maximum fluorescence (Fmax) during the flash. If an MPF flash is viewed, a Check value is also displayed. This value is the difference between the maximum fluorescence reached during the third phase of the MPF flash, with what would be predicted using the second phase's regression. If the flash settings are appropriate, this value should be within several mV of zero. If a dark pulse is viewed, Fmin is the min value of fluorescence.
view Graph: To view the entire flash, press G (the shortcut for the view Graph key, f1). To view the top ten percent of the graph, escape back to the viewer, and press T (the shortcut key for the zoom topTen% key, f1 level 2). For an even closer view, press O (the letter) from the viewer, the short cut for zoom topOne%, f2, level2).
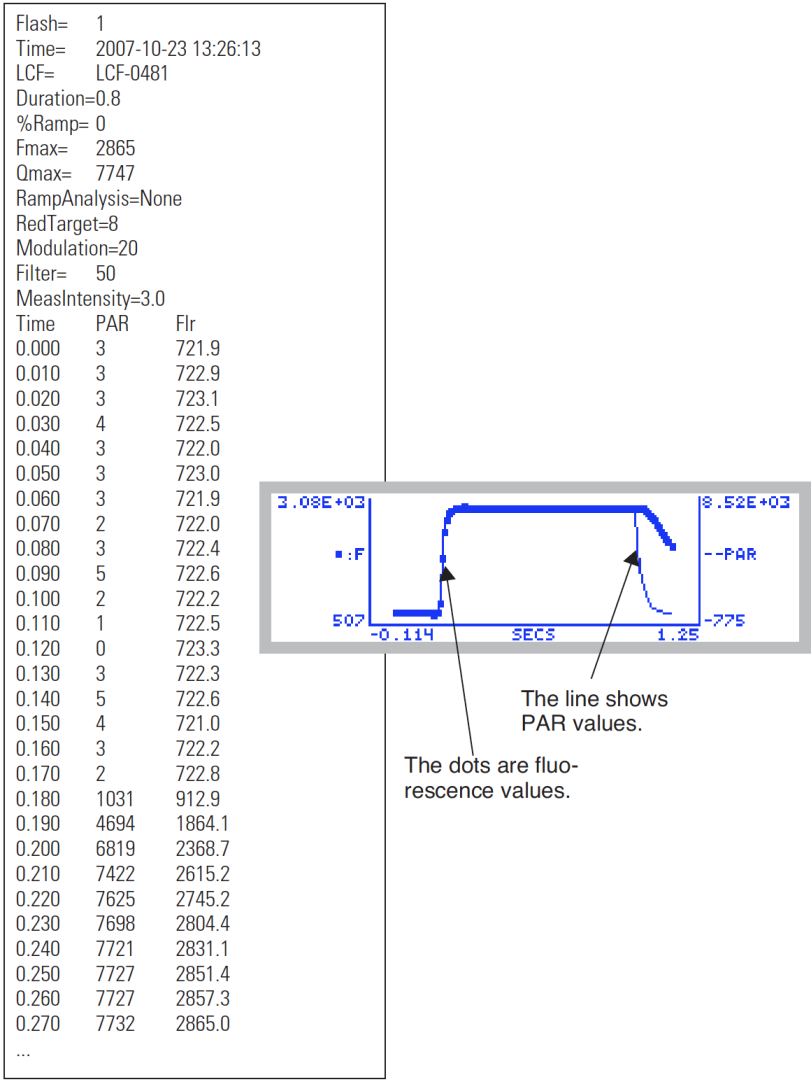
view Details: The saturating flash summary details and data can be viewed by pressing D, (for view Details, f2).
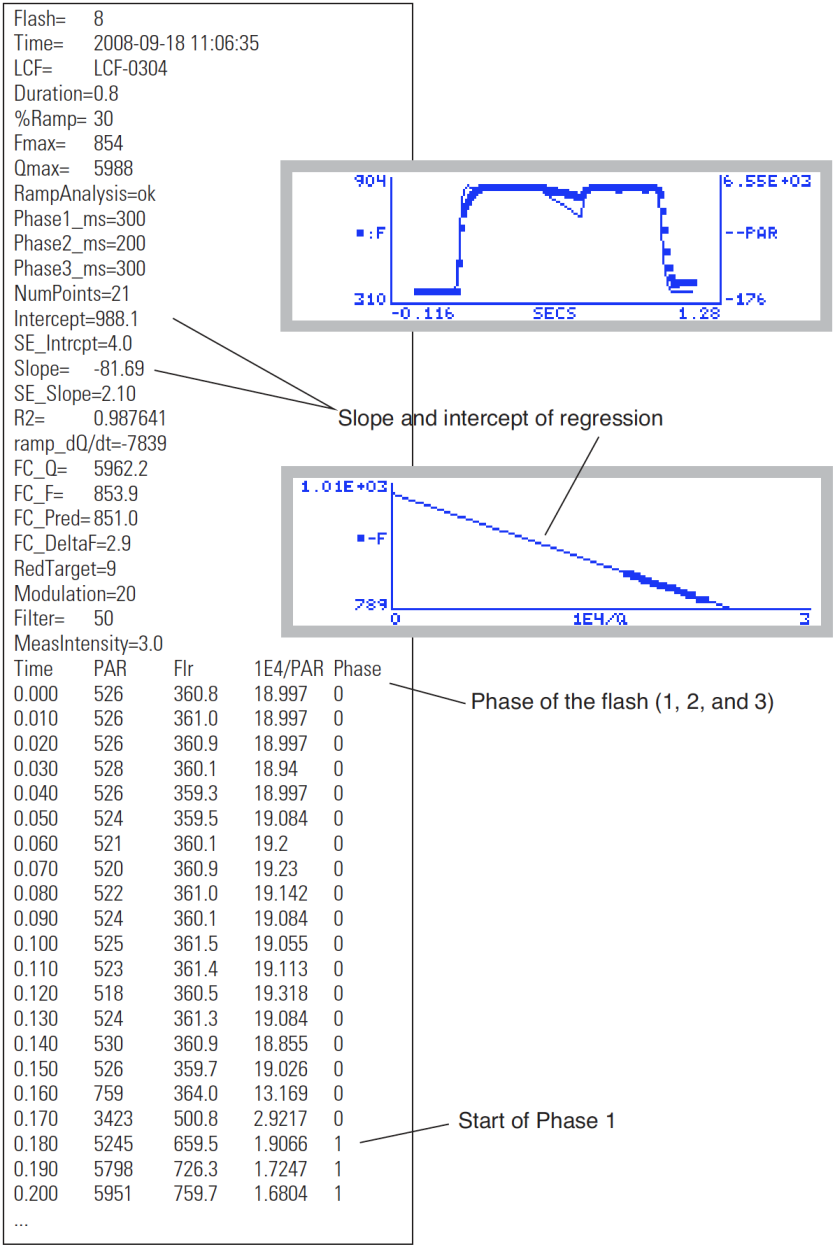
view Regrs: The phase 2 regression of the MPF can be viewed by pressing R, the short cut for the view Regrs key, f3.
Save: The flash or dark pulse details and data may be saved (if they haven't been already) by pressing S (short cut for Save, f4 level 2). These files are saved by flash number, date, and time stamp in the /User/LCF directory.
Pick event: You may load in previously saved flashes or dark pulses by pressing P, the short cut for Pick event, f4.
Display Summary
Table 27‑3 summarizes the New Measurements display groups added by the display configuration file “Std Flr Disp”. Also, the default display grouping defined by “Std Flr Disp” is:
| Key | Displays |
|---|---|
| home | a, b, c |
| end | k, e, i |
| pgup | m, o, p |
| pgdn | g, h, d |
| Label | Description | ID # |
|---|---|---|

|
||
| %Blue | An estimate of the percentage of ParIn_μm coming from the blue actinic LEDs. | -81 |

|
||
| F | Fluorescence intensity. Measured continually. | -80 |
| dF/dt | The rate of change (per minute) of the fluorescence signal over the past 20 readings. | -98 |
| FlrEvent | Indicates the last action performed or variable that was set. | -91 |

|
||
| Fo | Minimal fluorescence (dark). This value is set by pressing Do Fo or Do FoFm (f1 or f3 level 0). | -86 |
| Fm | Maximal fluorescence (dark). Set by pressing Do Fm or Do FoFm (f2 or f3 level 0). | -88 |
| Fv/Fm | Maximum PSII efficiency. Variable to maximal fluorescence (dark). Equation 27‑8. | 4202 |

|
||
| Fo' | Minimal fluorescence (light). This value is set by pressing Do Fo’ or Do FsFm’Fo’ (f3 or f4 level 0). | -87 |
| Fm' | Maximal fluorescence (light). This value is set by pressing Do FsFm’ or Do FsFm’Fo’ (f3 or f4 level 0). | -89 |
| Fv'/Fm' | Variable to maximal fluorescence (light). Equation 27‑10. | |
| fs | Steady-state fluorescence. Set by pressing Do FsFm’ or Do FsFm’Fo’ (f3 or f4 level 0). | 4211 |

|
||
| PhiPS2 | PS II efficiency. Equation 27‑9. | 4212 |
| ETR | Electron transport rate. Equation 27‑12. | 4223 |
| qP | Photochemical quenching. Equation 27‑13. | 4216 |
| qN | Non-photochemical quenching. Equation 27‑14. | 4220 |

|
||
| Adark | Dark photosynthetic rate (μmol CO2 m-2 s-1). (Sign convention: a value less than 0 indicates respiration). Set by pressing Prompt All (f5 level 3), or Flr Editor (f2 level 8). | 4213 |
| Leaf Abs | Leaf Absorptance. Computed based on the fraction of blue light, and two user-entered (Prompt All or Flr Editor) absorptances: one for blue, and one for red. Equation 27‑18. | 4207 |
| PS2/1 | Photosystem distribution factor. Set by pressing Prompt All(f5 level 3). This is f in Equation 27‑12. | 4222 |
| PhiCO2 | Equation 27‑11. | 4215 |

|
||
| F | Fluorescence intensity. Measured continually. | -80 |
| M: Int … Gn | Measuring beam parameters: intensity, modulation, filter, gain. See Table 27‑6. | -92 |

|
||
| FlrMax | Maximal fluorescence obtained during the previous saturating flash. | -82 |
| RF: Dur … Hz MPF% ... Hz |
Saturation flash parameters (Table 27‑7): duration (for RF) or percent and phase timing (for MPF), plus intensity, modulation, and filter. | -93 |

|
||
| FlrMin | Minimum fluorescence value during the previous dark pulse. | -95 |
| D: Dur … Hz | Dark pulse parameters (Table 27‑8): duration, pre-time, post-time, modulation, filter. | -94 |
| Other variables available for display | ||
| FPeak_μm | Maximum quantum flux generated by the previous saturating flash, in μmol m-2 s-1. | -83 |
| FCnt | Number of saturating flashes performed since power on. | -84 |
| Fzero | The fluorescence value achieved with the measuring intensity set to 0. This is used as an offset to compute F from the actual measured value. To set this, see Zero Fluorescence Signal. | -85 |
| ParIn@Fs | The measured value of ParIn_μm when Fs was last set. This is used to keep the electron transport computation from changing because of subsequent changes in ParIn_μm before Fs is measured again. | -96 |
| BlueAbs | Leaf absorptance at 460 nm. User entered constant. See Leaf Absorptance. | 4205 |
| RedAbs | Leaf absorptance at 640 nm. User entered constant. See Leaf Absorptance. | 4206 |
| PARAbs | Absorbed PAR. ParIn_μm * LeafAbs. | 4208 |
| NPQ | Alternative non-photochemical quenching. Equation 27‑15. | 4221 |
Function Key Summary
Table 27‑4 summarizes the New Measurements function keys enabled when the light source is set to “6400-40 LCF”.
| Label | Description |
|---|---|

|
|
| Flr Import | Brings up a list of files with saved fluorometer settings. Selecting one of those files implements the settings in that file. |
| FlrEditor | Allows measurement, flash, and dark pulse settings to be viewed, stored, recalled, etc. See Flr Editor. |
| Define Actinic | Set actinic light, without turning on the LEDs. See The LCF as a Light Source. |
| FlrAdjust | Allows measurement, flash, and dark pulse settings to be changed on the fly, without interrupting measurements. See Flr Adjust. |
| Rcrding ON/OFF | Toggles recording of F and time to a data file on/ off. This is independent of normal data logging (f1 level 1). See Fluorescence Recording. |

|
|
| Meas is ON/OFF | Toggles the measuring LEDs on/ off. |
| Flash | Triggers a saturating flash, but only updates FlrMax. |
| Dark Pulse | Triggers dark pulse routine, but does NOT set Fo or Fo’. |
| Actinic | Toggles actinic light on/ off. |
| Far Red is ON/OFF | Toggles far red light on/ off. |
|
|
| Do Fo' | Does dark pulse, and sets Fo’, then logs (if data file open). |
| Do Fs | Sets Fs to the current value of F and logs (if data file open). |
| Do FsFm’ | Sets Fs, then does a flash to get Fm’ then logs (if data file open) |
| Do Fs Fm’Fo’ | Sets Fs, then does a flash to get Fm’, then a dark pulse to get Fo’, then logs (if data file open). |
| View Fsh/Drk | Allows user to view and/ or save last flash, ParIn during flash, or dark pulse. See Viewing Flash and Dark Pulse Details. |
|
|
| Do Fo | Sets Fo to the current value of F, then logs (if data file open). |
| Do Fm | Does flash and sets Fm, then logs (if data file open). |
| Do FoFm | Sets Fo to the current value of F, does flash, then sets Fm, and logs (if data file open). |
Logging Considerations
Normal Data Logging
1) Log files are opened by pressing f1 level 1, or by launching an AutoProgram (f1 level 5).
2) The user has control over what parameters are stored in the log file (see Determining What is Logged on page 9-9 in the instruction manual).
3) Logging occurs automatically with an AutoProgram or manually by pressing Log (f1 level 1).
When the LCF is installed, there are some additional capabilities:
- There are 4 additional keys that will trigger a Log
- The “Do...” keys on level 0 all trigger logging if a log file is open. For example, Do FoFm will log a data record - just like pressing Log (f1 level 1) - but it is done after setting Fo, doing a flash, and setting Fm.
- If you are wondering what happens to the gas exchange values when a saturating flash or dark pulse occurs, and how meaningful values of both can be logged simultaneously, then you’ll want to read Simultaneous Gas Exchange and Fluorescence.
- Fluorescence events log remarks
- When a log file is open, a remark is logged whenever some fluorescence event occurs, either due to an AutoProgram or manually. These events are summarized in Table 27‑5.
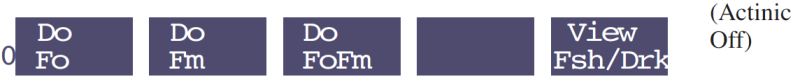
Fluorescence Recording
Often it is convenient to record fluorescence as a function of time over the course of an experiment. Fluorescence recording is toggled on and off by Rcrding On/Off (F5 level 8). When Fluorescence recording is first turned on, you are prompted for a destination file. While recording remains on, the file records the raw fluorescence signal and times while you are in New Measurements mode. The data is typically spaced every second or two, except during saturating flashes and parts of dark events, when the spacing is 0.01 seconds (see next paragraph). There will be gaps in the data during those times in New Measurements mode when you are being prompted for input from the keyboard, such as when launching an AutoProgram, or changing leaf area.
To save the detailed fluorescence data from saturating flashes and/or dark pulses separately (whether fluorescence recording is on or not), use the <Flash> <autosave> and <DarkPulse> <autosave> nodes in the <FlrParams> configuration tree (Flr Editor, f2 level 8). Otherwise, you can save it manually in the Flash / Dark Pulse Viewer, View Fsh/drk (f5 level 0).
Changing Control Parameters
The 6400-40 LCF has a number of control parameters, such as measuring beam intensity, flash intensity, and dark pulse duration. They are summarized in Table 27‑6. There are three groups of parameters:
- Measuring
- The intensity and modulation frequency of the measuring beam are user controlled. The resulting fluorescence signal coming back from the leaf is averaged with a user defined bandwidth.
- Flash
- Saturating flashes are performed with the red actinic LEDs. The intensity and duration of the flash are user defined, as well as the fluorescence modulation and measuring filter used during the flash.
- Dark
- The dark pulse is designed to provide a brief interruption of actinic light to a light equilibrated leaf, in order to measure Fo’. The timing and measuring parameters are user defined, and illustrated in Figure 27‑22.
There are several ways to adjust these control parameters from the keyboard:
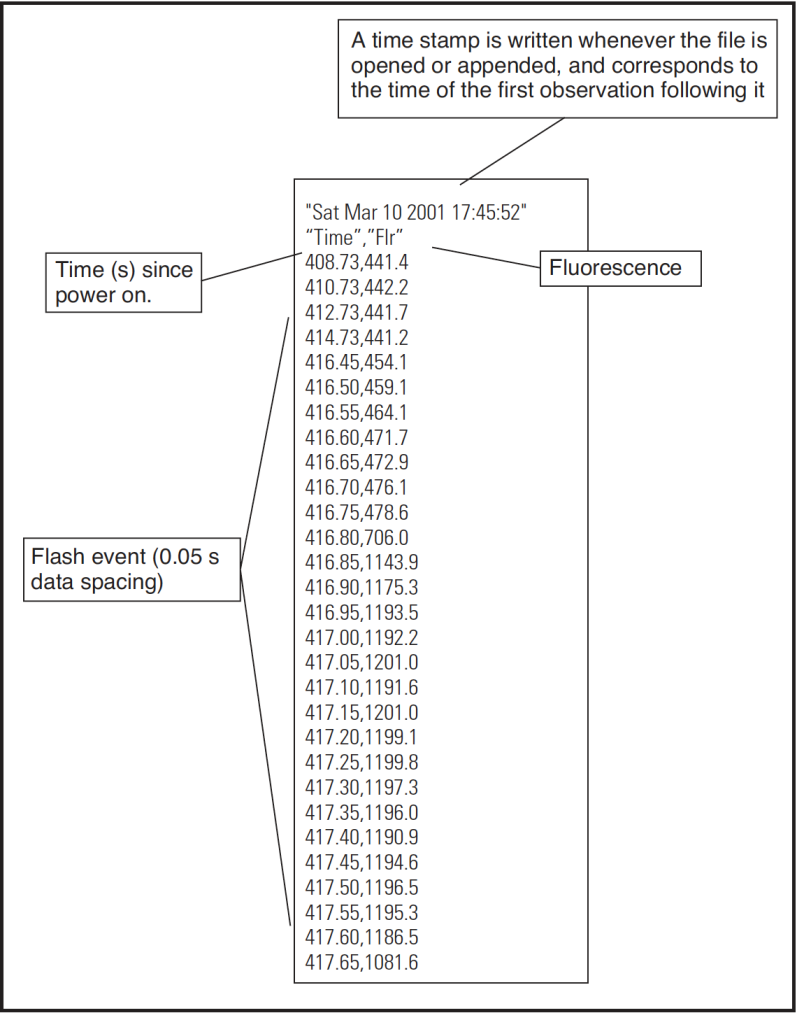
Flr Editor
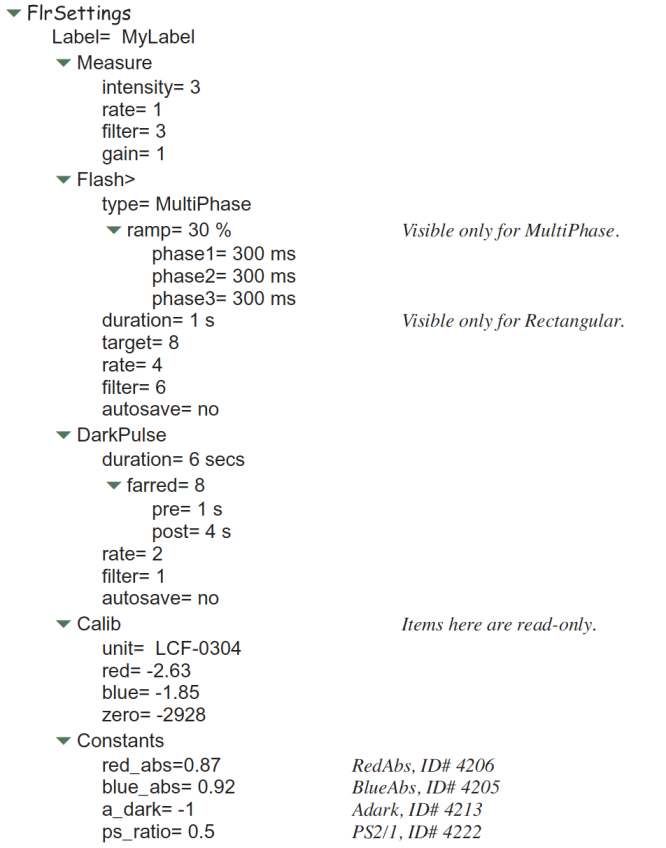
The Flr Editor (Figure 27‑29) is accessed via f2 level 8. It allows any of the fluorescence configuration parameters to be edited, all in one dialog box. No changes take effect until the dialog box is exited by pressing OK. The entire collection of parameters can be stored as a named file. Also, previously stored files can be read and edited.
The complete fluorescence configuration tree is shown below.
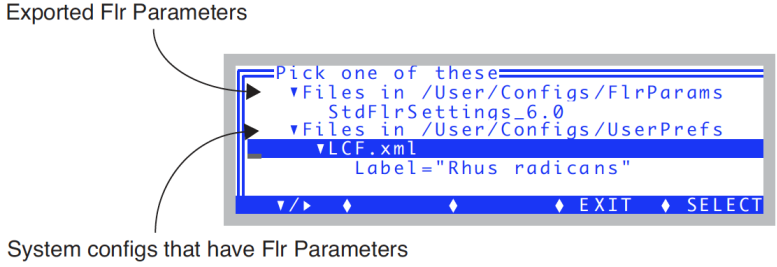
Flr Import
Flr Import is accessed via f1 level 8. It presents two sources of fluorescence parameters: any that have been previously exported (stored in /User/Configs/FlrParams), and any system configuration files that happen to include Flr parameters (stored in /User/Configs/UserPrefs).
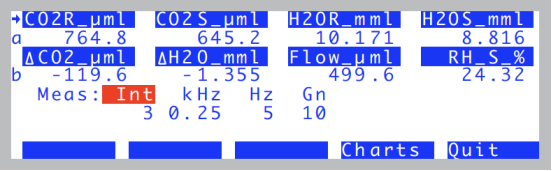
Flr Adjust
Flr Adjust (Figure 27‑31) is accessed via f4 level 8. The advantage of Flr Adjust is that it allows measuring fluorescence parameters to be adjusted without interrupting data collection and measurements. HINT: Before entering Flr Adjust, put display line m on the top line, so you can immediately see the effect of changes to measuring parameters. Also, if you have real time graphics showing F as a function of time, you can view that display with one keystroke, Charts (f4). To return to the Flr Adjust display from graphics, press escape.
| Editor Label | Description |
|---|---|
| duration | Length of dark interval. Typically < 5 secs. |
| farred | Intensity of far red. (Setting of 10 is typically about 5 μmol m-2 s-1). |
| pre post |
Far red LED timing. See Figure 27‑22. |
| rate | Fluorescence modulation to use during the dark pulse. |
| filter | Averaging to use during the dark pulse. 1 Hz is typical. |
| autosave | Save the dark pulse results to a file in the /User/LCF folder. |