Measuring PI response with a Background Program
Previously we measured the irradiance response using a simple program. The same measurement can be accomplished using a Background Program. While a program allows control of a single parameter over time, a Background program can control nearly every parameter in the instrument and multiple parameters simultaneously. Multiple background programs can run simultaneously. Background programs are to create programs for complex measurements. Background programs are written in the Python programming language, but can be created through the LI-6800 graphical interface as well. Full documentation for background programs is available in Using Background Programs.
Here we offer a brief tutorial. We'll create a background program that makes a dark-adapted measurement with a blue pretreatment, followed by a light response curve. In this exercise, you are using the fluorometer as a full fluorometer, rather than the basic light source (Start Up > Chamber set up > Fluorometer functions as: select Full fluorometer).
- Prepare the chamber.
- Do the things relevant to you in Preparing for measurements.
- Remove the pre-equilibrated media from the chamber and load 15 mL of newly re-suspended algae sample into the chamber. Install the chamber top plug.
- Install the light sensor aperture on chamber to ensure that the sample is in dark conditions. Let the sample acclimate to the darkness.
- While it acclimates, match the IRGAs. Tap Match IRGAs > Auto to initiate the automatic match. Review the adjustments and close the Matching screen.
- Open a log file or create a new one.
- Under the Programs tab, select Program Builder.
- Tap New BP.
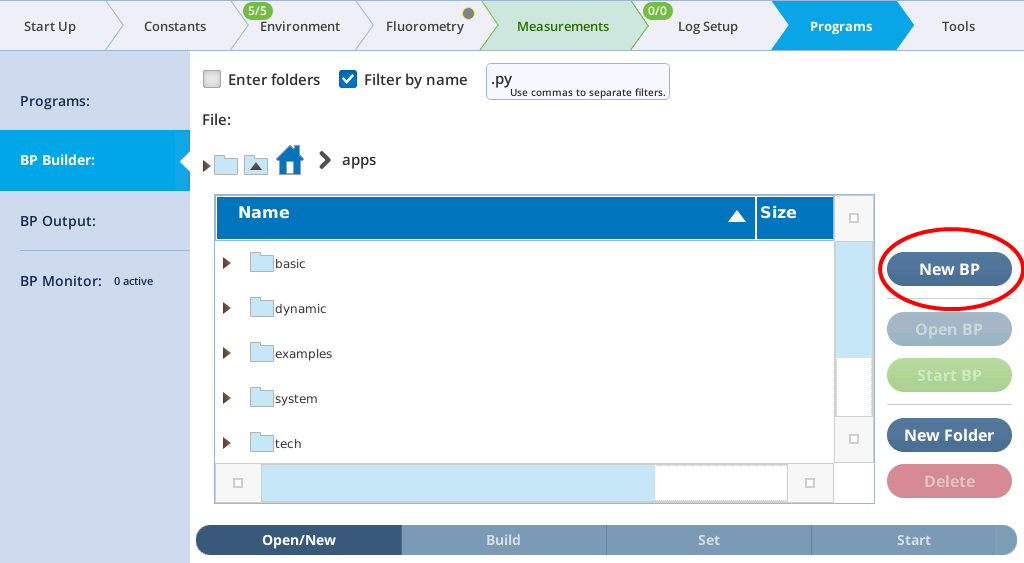
- Save the background program with a memorable file name.
- Under the Build tab, select commands listed on the left (under Statements and Prog Flow Control) and insert them into the section on the right...
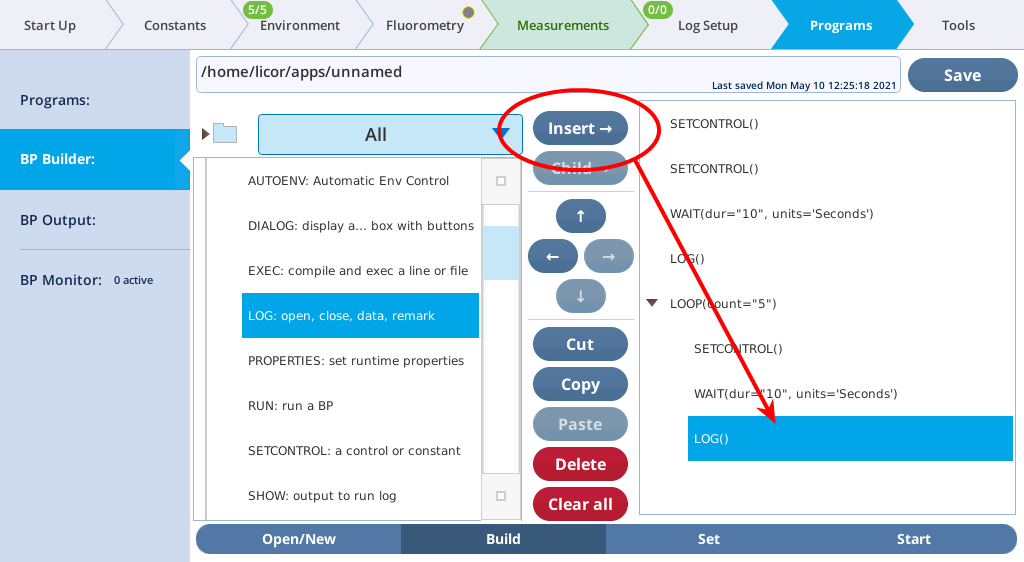
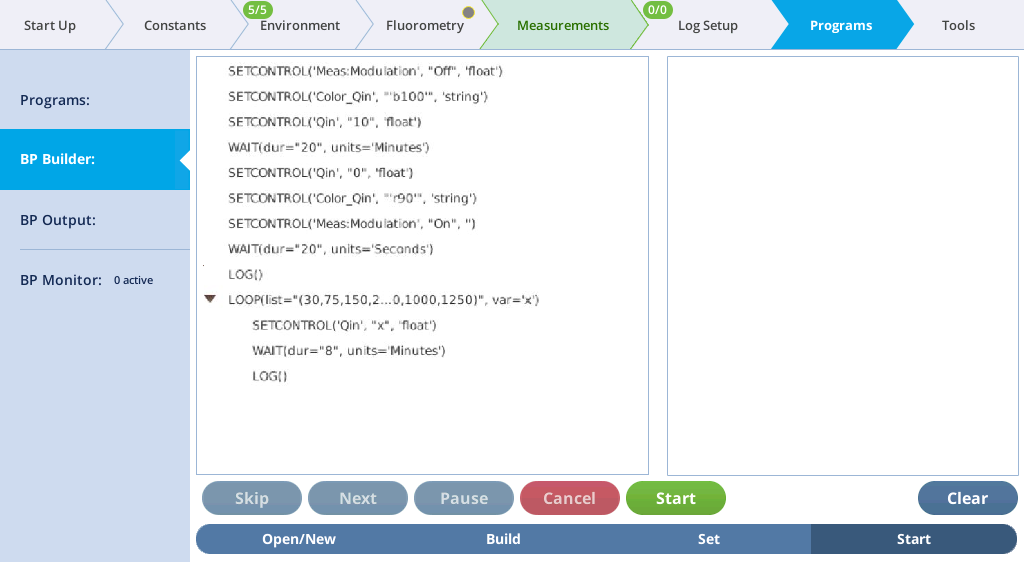
- ...to create the following, as viewed under the Start tab:
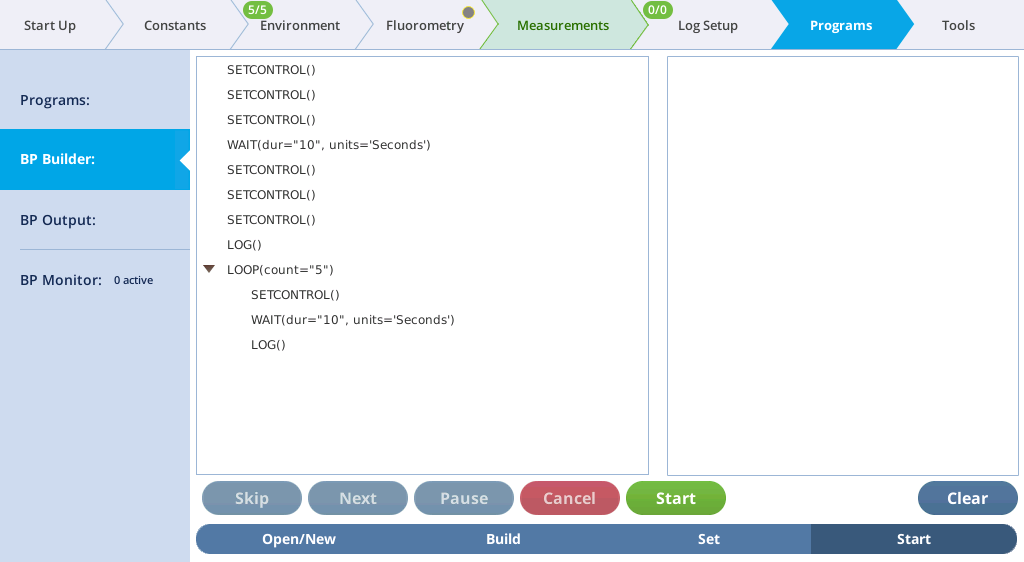
- Once all the building blocks have been added to the program, go to the Set tab and edit each entry...
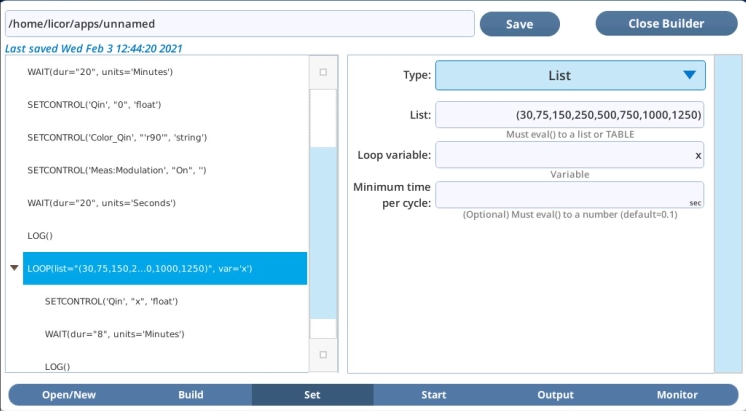
- ...so that it looks like this:
- The settings are described in Table 10‑3.
- Save the program and tap Close Builder.
- Enter the sample constants.
- Under Constants > Gas Exchange, enter the sample volume, cell density, chlorophyll density, or mass density. These parameters will be adjusted later, so don't worry if they are inexact at this time.
- Start the program.
- Go back to Programs > BP Builder > Open/New and tap Start. You can observe the measurements on the Measurements tab (chart G) as the program proceeds.
- After the measurement is complete, measure cell density and the chlorophyll density from the sample in the chamber.
- Transfer the logs file from the instrument to your computer. Files are stored as plain text and an identical Excel with equations (see Transferring files to a computer).
- In the Excel file, identify columns for the cell density (Dcell), chlorophyll density (Dchl), and mass density (Dmass). Enter these parameters into the columns. The Excel file maintains the photosynthesis equations; the final flux results will be recomputed automatically when these parameters are entered.
The next time you want to use the program or modify it, access Programs > Program Builder > Open/New. Highlight the program you want to run or edit and tap Start BP or Open BP, respectively.
| Command | Setting | Description |
|---|---|---|
| SETCONTROL() | "Meas:Modulation", "Off","" |
Turns the modulated beam off. |
| SETCONTROL() | "Color_Qin","'b100'", "string" |
Sets the color into the chamber to 100% blue |
| SETCONTROL() | "Qin","10","float" | Sets Qin a setpoint of 10 μmol m-2 s-1. |
| WAIT() | dur="20", units="Minutes" |
Specifies a 20 minute wait after the blue light to allow the LHCs to migrate away from PSI to PSII. |
| SETCONTROL() | 'Qin',"0",'float' | To get the sample ready for an Fv/Fm measurement and light curve, these commands turn the actinic light off and set the color mix back to 90% red and 10% blue light, a color mix that is common for photosynthetic measurements. |
| SETCONTROL() | 'Color_Qin',"'r90'", 'string' |
|
| SETCONTROL() | 'Meas:Modulation', "On", '' |
Turns the modulated beam on. If the modulation beam is kept on during the pre-treatment, there will be a small addition of red light. This may be negligible at low blue light but depends on the frequency of the Light mod rate. |
| WAIT() | dur="20", units='seconds' |
The second wait is 20 seconds, which allows QA to approach 0 if photochemistry occurred during the blue pre-treatment. |
| LOG() | Logs a data point as configured under the Log Files > Fluorometer Options. Be sure the Flr Action at Log is set to 1: do FoFm (dark) or FsFm’ (light).1 | |
| LOOP() | list="(30,75,150, 250,500,750, 1000,1250)", var="x", steps=( |
Whatever is contained inside the LOOP statement will occur as many times as is specified by the LOOP. Here the LOOP is set for a list of variables. The program will loop through a list of light setpoints, 30 to 1,250 μmol m-2 s-1, where each light setpoint will be represented by the variable x. |
| SETCONTROL() | 'Qin',"x", 'float' |
Sets Qin to x; the first time through the loop x = 30, the second time x = 75, and so on until it reaches the end of the list and exits the loop. |
| WAIT() | dur="8", units="Minutes" |
Specifies a wait time of 8 minutes. The sample may stabilize in less time, but 8 minutes assures stability for most samples. |
| LOG() | Logs another data point.1 |
Listing 10‑1. Python code and comments to execute the program described above. By going through the tutorial, you are writing this program.
from bpdefs import SETCONTROL, WAIT, LOG, LOOP, Nothing, CheckBox, Text, Button, DropDown, RadioBtns, EditBox, DataDict

steps=[
# Set a control: SETCONTROL('target', 'value', 'eval' [,opt_target=''])
SETCONTROL("Meas:Modulation","Off",""),
# Set a control: SETCONTROL('target', 'value', 'eval' [,opt_target=''])
SETCONTROL("Color_Qin","'b100'","string"),
# Set a control: SETCONTROL('target', 'value', 'eval' [,opt_target=''])
SETCONTROL("Qin","10","float"),
# Wait for a time duration: WAIT(dur="float" [,units='Seconds' (Seconds|Minutes|Hours)])
WAIT(dur="20",units="Minutes"),
# Set a control: SETCONTROL('target', 'value', 'eval' [,opt_target=''])
SETCONTROL("Qin","0","float"),
# Set a control: SETCONTROL('target', 'value', 'eval' [,opt_target=''])
SETCONTROL("Color_Qin","'r90'","string"),
# Set a control: SETCONTROL('target', 'value', 'eval' [,opt_target=''])
SETCONTROL("Meas:Modulation","On",""),
# Wait for a time duration: WAIT(dur="float" [,units='Seconds' (Seconds|Minutes|Hours)])
WAIT(dur="20",units="Seconds"),
# Log a data record: LOG([avg='Default'] [,match='Default'] [,matchH2O='Default'] [,flr='Default'] [flash='Default'])
LOG(),
# Loop through a list: LOOP(list=itemList [,var=varname] [,mininc=''])
LOOP(list="(30,75,150,250,500,750,1000,1250)",
    var="x",
    steps=(
        # Set a control: SETCONTROL('target', 'value', 'eval' [,opt_target=''])
        SETCONTROL("Qin","x","float"),
        # Wait for a time duration: WAIT(dur="float" [,units='Seconds' (Seconds|Minutes|Hours)])
        WAIT(dur="8",units="Minutes"),
        # Log a data record: LOG([avg='Default'] [,match='Default'] [,matchH2O='Default'] [,flr='Default'] [flash='Default'])
        LOG(),
    )
),
]