Fluorometry > Settings screens
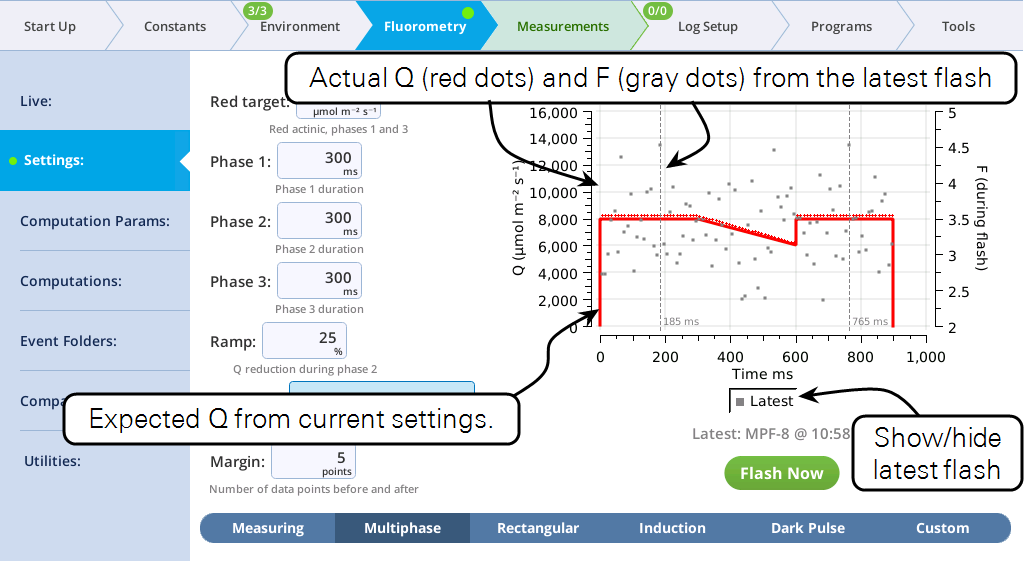
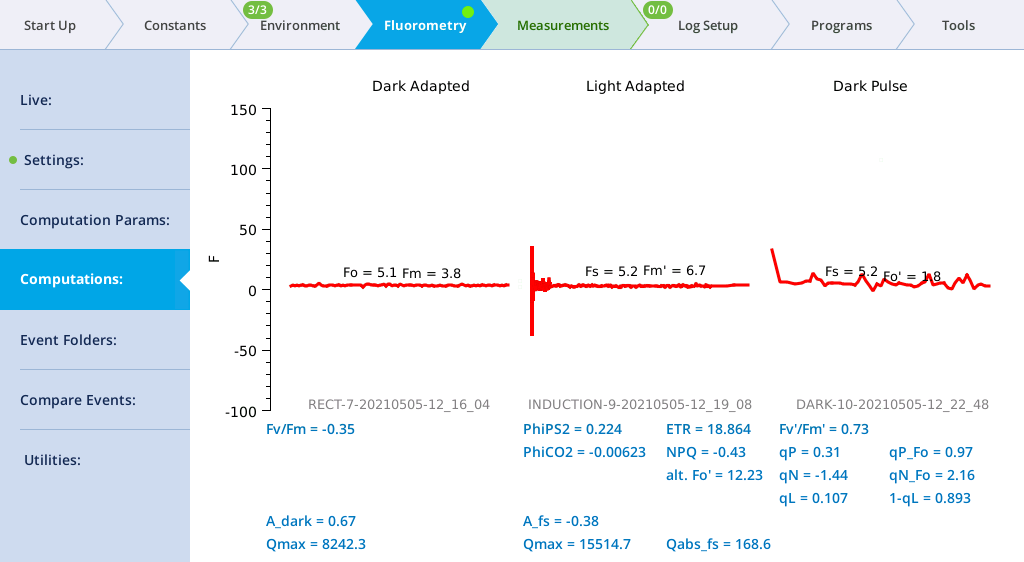
Each setup screen has a graph that shows the current settings, and also the results of the last event of that type that was made. The time of the fluorescence peak (or minimum, for a dark pulse) is called out on the graph, to aid in setting proper duration times. For flash events, the displayed F data are only those points during the flash. This has the effect of zooming in on the upper part of the response. (For more controlled zooming and other options for fluorescence plots, see the Files tab.)
Actinic light settings
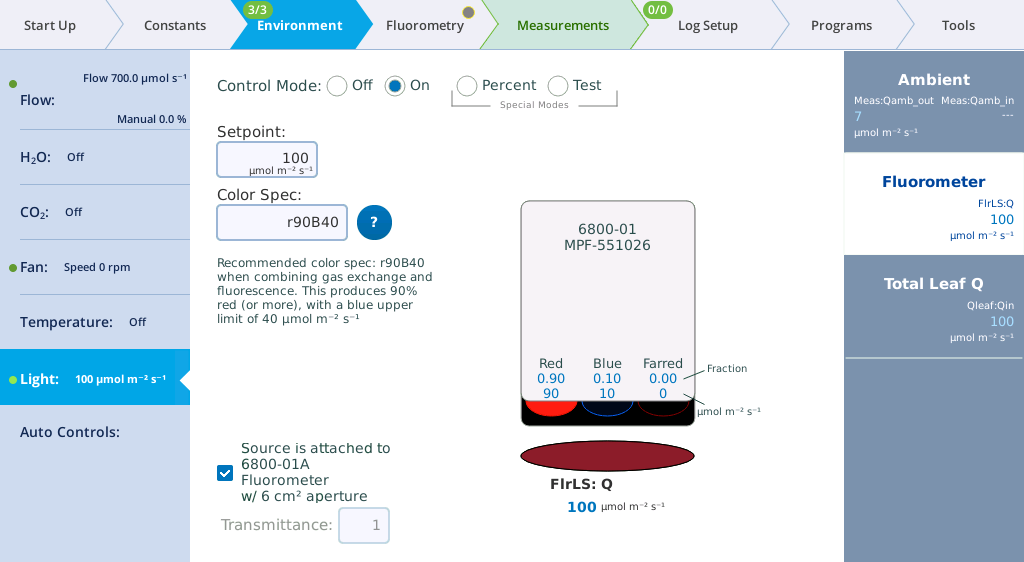
Under Environment > Light > Fluorometer you can set the actinic light by setting the Control Mode. Actinic refers to continuous light for purposes of driving photosynthesis, and it can be set to Off, On, Percent, and Test. The LEDs that provide actinic irradiance are the same ones used for saturating flashes, plus several blue LEDs (475 nm). You control the light in one of two ways: Selecting and entering a Setpoint and Color Spec, or selecting and entering the Percents. The options for Color Spec are given in Color spec.
This tutorial steps you through actinic light controls. Open the fluorometer chamber so you can see light shining out of it.
- Set the Control Mode to On and then configure the Color Spec:
-
- Setpoint: 100 µmol m-2 s-1
- Color Spec: r90b10
- Observe the light shining out of the chamber (never look directly into the chamber). Now look at the measured values for Red, Blue, and Farred.
- Change the Color Spec to r90b40.
- Observe the light. It is now 69% red and 31% blue. Check the measured values on the display.
- Set the Color Spec to r90B40.
- With this setting, the LI-6800 provides 90% red with a maximum of 40 µmol m-2 s‑1 blue. This is a typical ratio for combined gas exchange and fluorescence measurements.
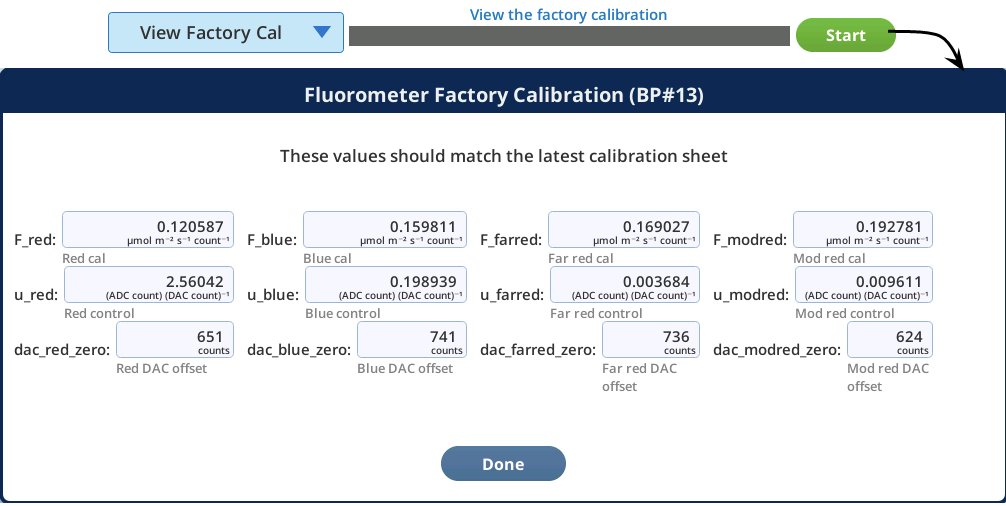
The View Factory Cal option under Fluorometry > Utilities gives access to factory default settings and calibration data for the fluorometer. The information in this tab is for diagnostic purposes. Do not change it unless in consultation with technical support.
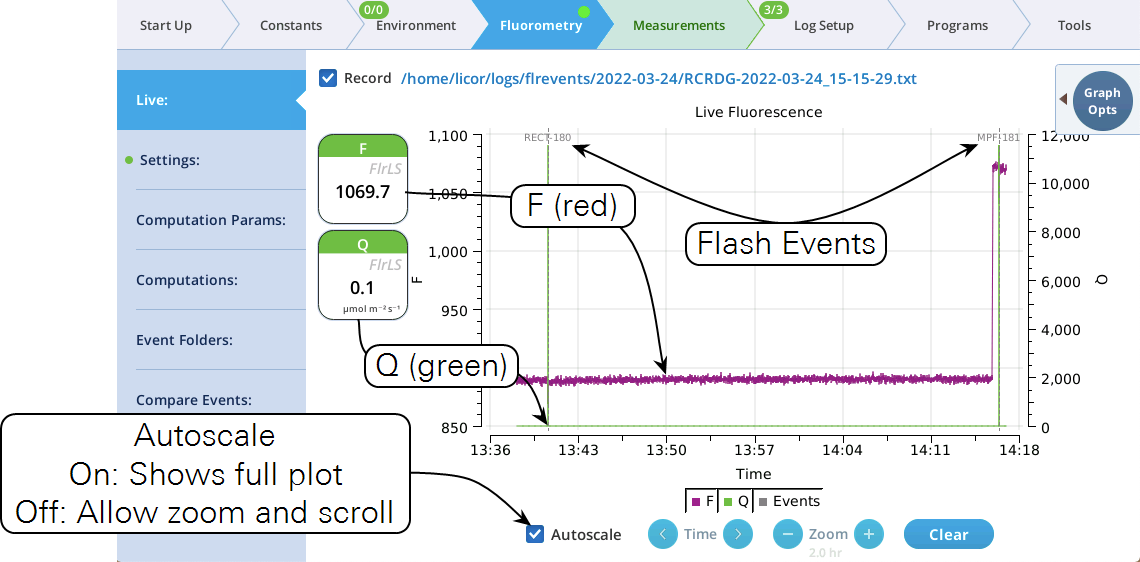
The Live screen
Version 2.1 adds a Live screen for monitoring fluorescence. The graph uses a time-of-day bottom axis, and plots modulated fluorescence F and actinic light Q for up to 8 hours. Fluorescence events (saturating flashes, dark pulses) are also marked on this graph as they happen.
Operational tips:
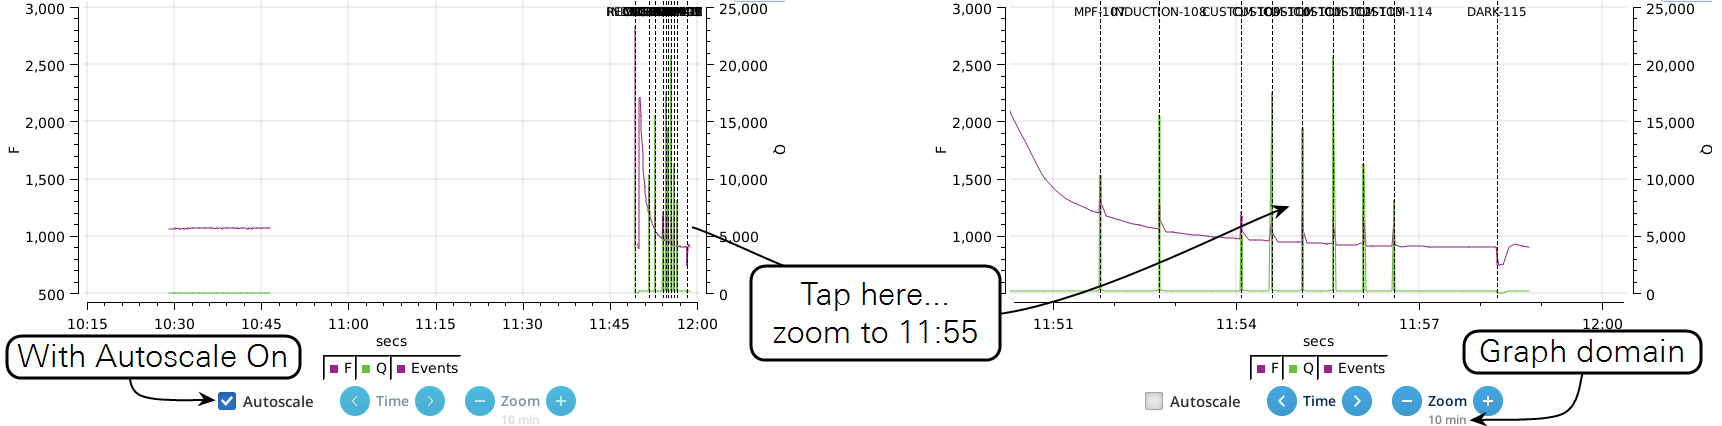
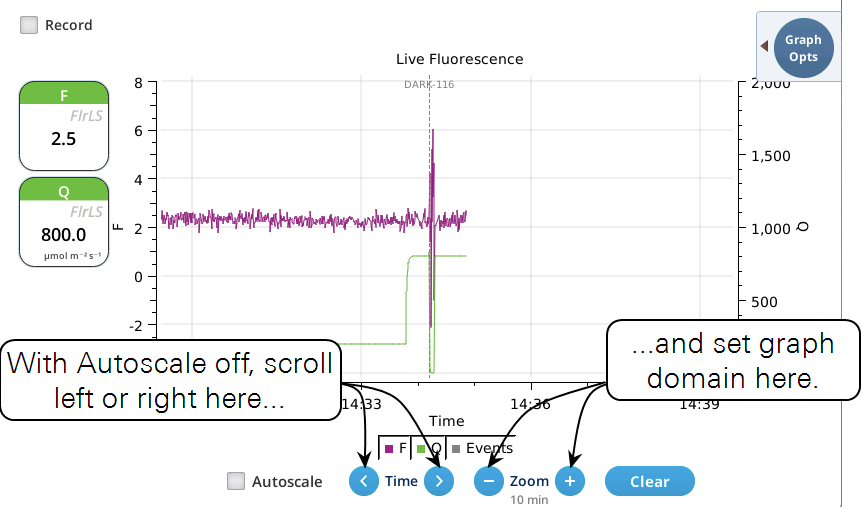
- While the Autoscale box is checked, you can quickly zoom in on a part of the graph by simply tapping the graph at that location. The graph will automatically turn Autoscale off and center itself at the tapped time, with the range of the displayed data set by the current Zoom setting. Subsequent left/right shifting and zooming in/out is done by the Time and Zoom buttons. To get back to the full view, check the Autoscale box.
- While Autoscale is unchecked, the graph will remain unchanged if the newest incoming data is not on screen. If the present time is visible, the graph will automatically scroll left each time the incoming data reaches the right edge, keeping the latest x minutes (x = whatever the zoom is set to) visible on screen.
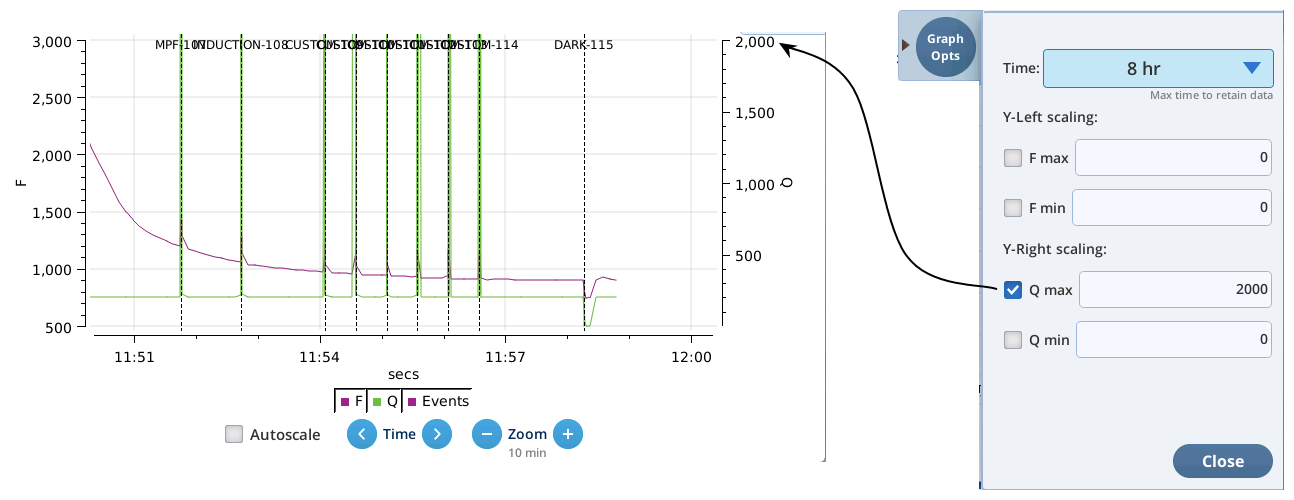
- The Q plot is easily dominated by saturating flashes (e.g., max values of 15,000). To maintain a normal actinic scale, open the Graph Opts panel, set Q max to 2000 and check the Q max box.
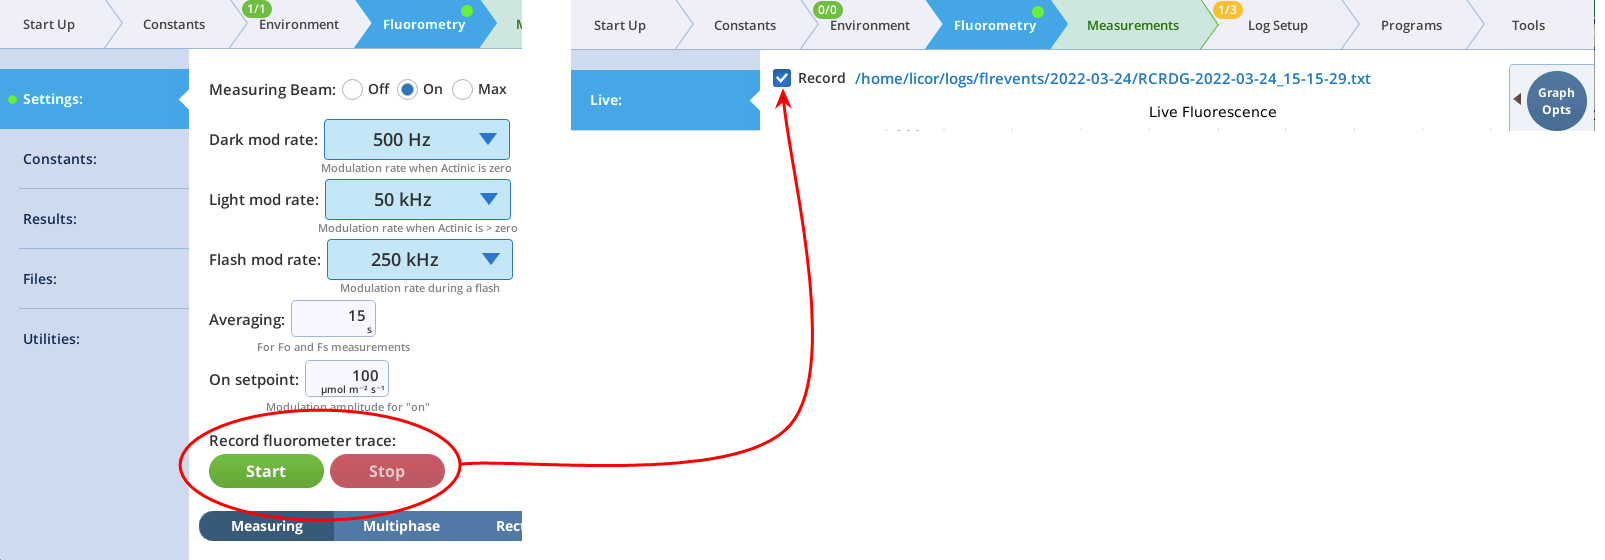
- The Record checkbox replaces the Start/Stop buttons that used to reside on the Measuring Settings page (Figure 8‑11). Record has no influence on the real-time graph, which keeps going no matter what (unless you put the instrument to sleep).
The Settings > Measuring screen
The Measuring tab presents options for the measuring beam pulse amplitude modulation (PAM) rate and intensity. You can control the following:
- Dark mod rate: Dark modulation rate, the modulation rate when actinic light is zero. It can be set to 50 Hz, 100 Hz, 200 Hz, 500 Hz, 1 kHz, 2 kHz, and 5 kHz.
- Light mod rate: Light modulation rate, the modulation rate when actinic light is greater than zero. Light modulation rates are 1, 2, 5, 10, 20, and 50 kHz.
- Flash mod rate: Flash modulation rate, is the modulation rate during a flash.
- Averaging: The averaging period for Fo (minimal fluorescence) and Fs (steady-state fluorescence). The default averaging time is 15 seconds.
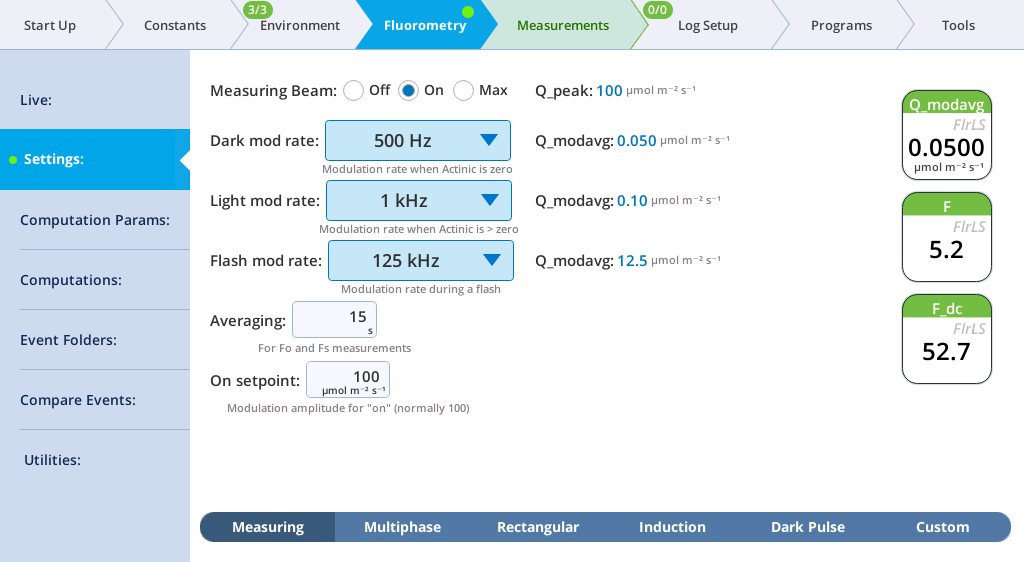
The displayed variables are:
- Q_modavg: The contribution to Q from the modulated light. This value will be non-zero when the measuring light is on.
- F: Demodulated fluorescence signal.
- F_dc: DC fluorescence.
Note: You can continuously record the fluorescence data into a file by tapping Start under Record fluorescence trace. This resulting data file is described in The continuous fluorescence trace.
This tutorial steps you through the Light and Measuring light controls. It will show how the modulation rate affects F and the light contributed by the fluorometer. The chamber can be open or closed for this exercise.
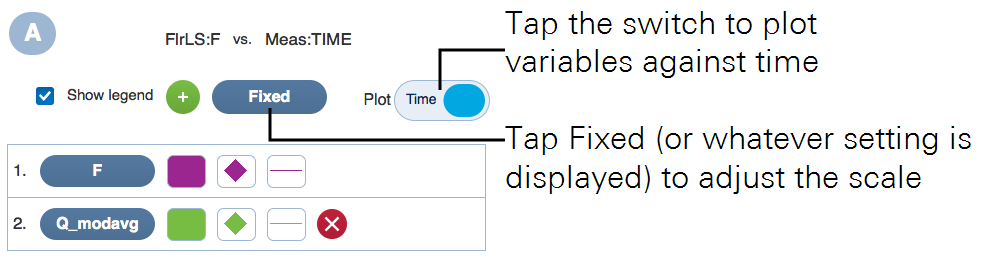
- Set up a graph that shows the variable F on the left axis and Q_modavg on the right, with Time as the horizontal axis.
- Under the Measurements tab, select graph F to make it easy to remember. Tap Edit graphs, then change the first variable to F (under FlrLS). Plot it on the left axis, scaled from -10 to 10. Add a second variable, Q_modavg, and plot it on the right axis, scaled from 0 to 5.
- Under Environment > Light > Fluorometer, turn Control Mode off.
- Under Fluorometry > Settings, turn the Measuring Beam to On and configure the fluorometer:
-
- Dark mod rate: 50 Hz
- Light mod rate: 1 kHz
- Flash mod rate: 250 kHz
- Averaging: 15 s
- Observe the graph of F and Q_modavg. Expect to see a noisy fluorescence signal and Q_modavg near 0.
- Change the Dark mod rate to 500 Hz.
- Observe the graph. F will become less noisy and Q_modavg will increase.
- Change the Dark mod rate to 5 kHz.
- Observe the graph. Again, F will become less noisy and Q_modavg will increase.
- Turn the Measuring beam off.
- Under Environment > Light, set Control Mode to On and enter 200 µmol m‑2 s‑1.
- This establishes an actinic light level of 200 µmol m‑2 s‑1.
- Under Fluorometry > Settings, change the measuring beam settings:
-
- Dark mod rate: 50 Hz
- Light mod rate: 1 kHz
- Flash mod rate: 250 kHz
- Averaging: 15 s
- Observe the graph. F will be noisier than before and Q_modavg will return to 0.
- Change the Light mod rate to 10 kHz.
- Observe the graph. F will become less noisy and Q_modavg will remain 0.
- Change the Light mod rate to 50 kHz.
- Observe the graph. F will become less noisy and Q_modavg will remain 0.
- Now you'll view the Measuring and Actinic light together. Turn the Measuring Beam back On and change the Measuring Beam settings:
-
- Dark mod rate: 50 Hz
- Light mod rate: 1 kHz
- Flash mod rate: 250 kHz
- Averaging: 15 s
- Turn both the Measuring beam and Actinic On. Observe the graph. F will be less noisy and Q_modavg will rise to about 0.1.
- Change the Light mod rate to 10 kHz.
- Observe the graph. F will become less noisy and Q_modavg will rise to about 1.
- Change the Light mod rate to 50 kHz.
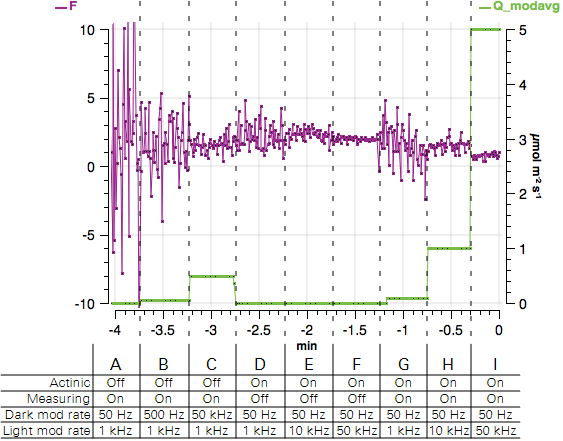
- Observe the graph. F will become less noisy and Q_modavg will rise to about 5. The expected values are shown in Figure 8‑12.
The Settings > MultiPhase screen
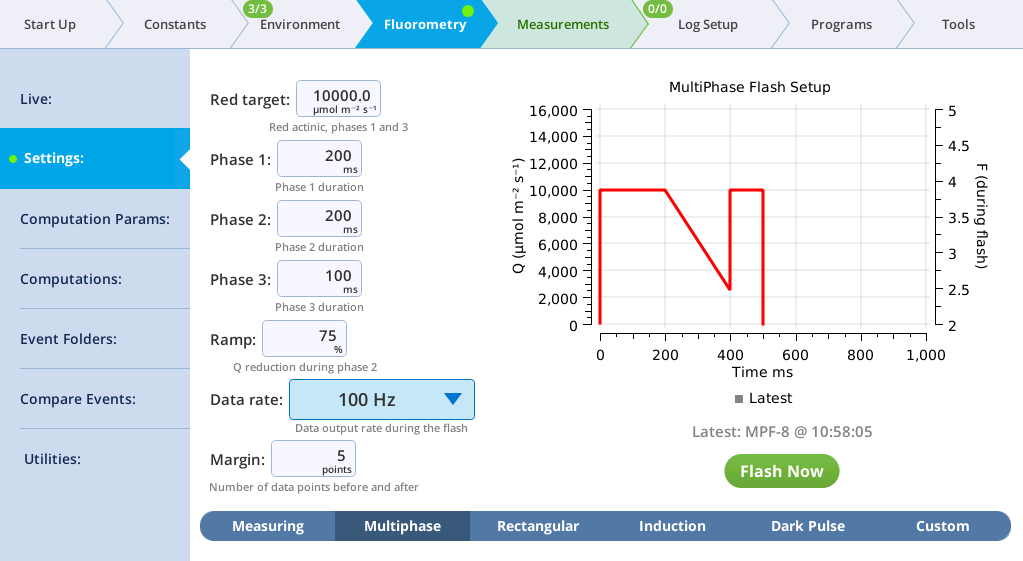
The MultiPhase tab presents options for the multiphase flash.
The fluorometer makes use of varying light intensities during the flash, and computes the fluorescence at saturation from the y-intercept of a plot of fluorescence vs. 1 / intensity. You can control the following:
- Red target is the setpoint for red actinic light during phases 1 and 3.
- Phases 1, 2, and 3 are time (ms) for the initial peak, ramp, and final peak, respectively.
- Ramp is the percentage decrease in flash intensity from the red target value during phase 2.
- Output rate is the data output rate during the flash.
- Margin is the number of points plotted before and after the flash.
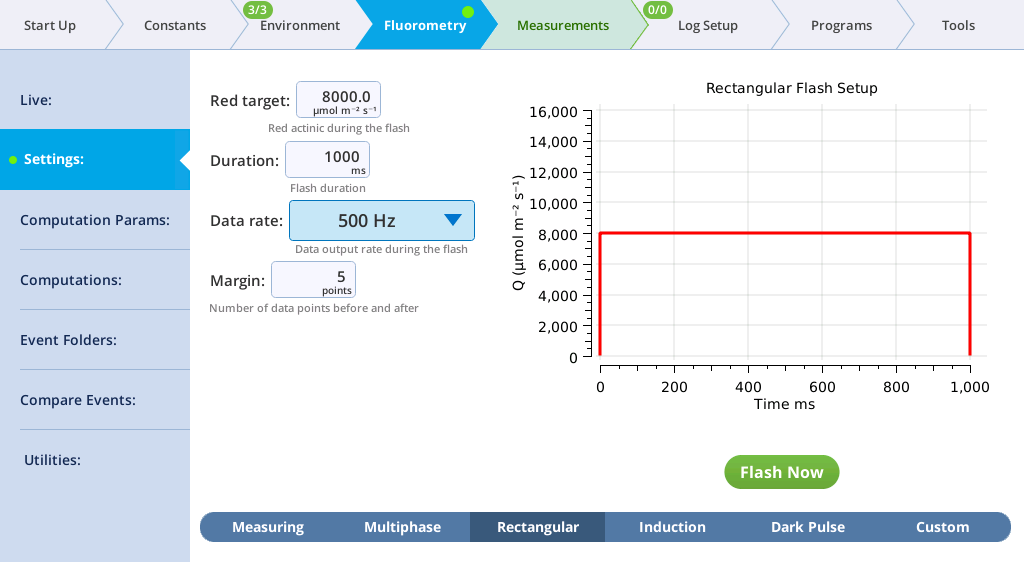
The Settings > Rectangular screen
The next tab, called Rectangular, is where you configure a saturating flash that provides continuous light for the duration of the flash. For learning purposes, you can do this measurement on leaf material or an empty chamber.
- Red target is the setpoint for red light during a flash.
- Duration is the time of the flash, in milliseconds.
- Output rate is the data output rate during a flash, in Hz.
- Margin is the number of data points plotted before and after the flash.
- Make a dark-adapted measurement.
- Under Environment > Light > Fluorometer, set Control Mode to Off. This sets the LI-6800 to measure a dark-adapted leaf. We'll measure a light-adapted leaf in a moment.
- Under Fluorometry > Settings > Measuring, set Measuring Beam to On.
- Set up a rectangular flash under Fluorometry > Settings > Rectangular.
-
- Red target: 8000 µmol m‑2 s‑1
- Duration: 1000 ms
- Output rate: 500 Hz
- Margin: 5 points
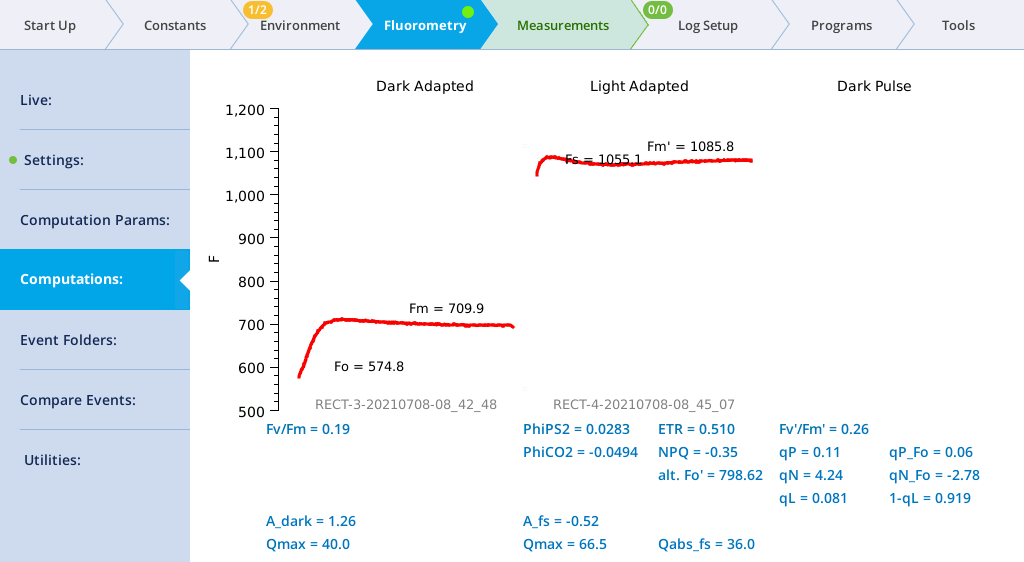
- Close the chamber onto a leaf and tap Flash Now.
- View the Dark-Adapted results.
- Tap Results to see the results from the most recent flash.
- Make a Light-Adapted measurement.
- Under Environment > Light > Fluorometer, set Control Mode to a Setpoint of 200. This sets the LI-6800 to make the Light-Adapted measurement.
- With the same Rectangular Flash settings set previously under Rectangular, tap Flash Now.
- View the results.
- The data may not be ideal (such as that shown below) but are fine for the tour.
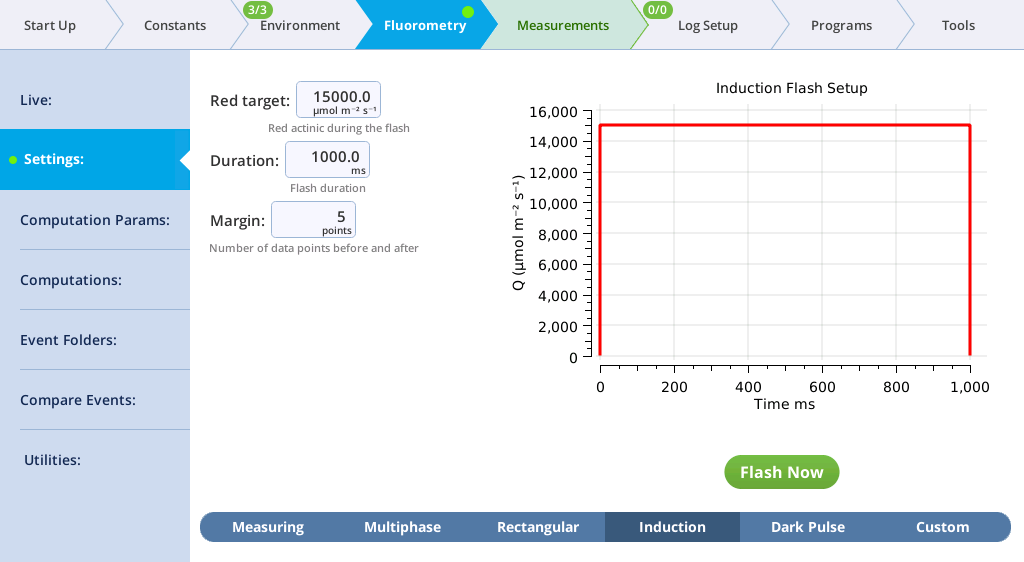
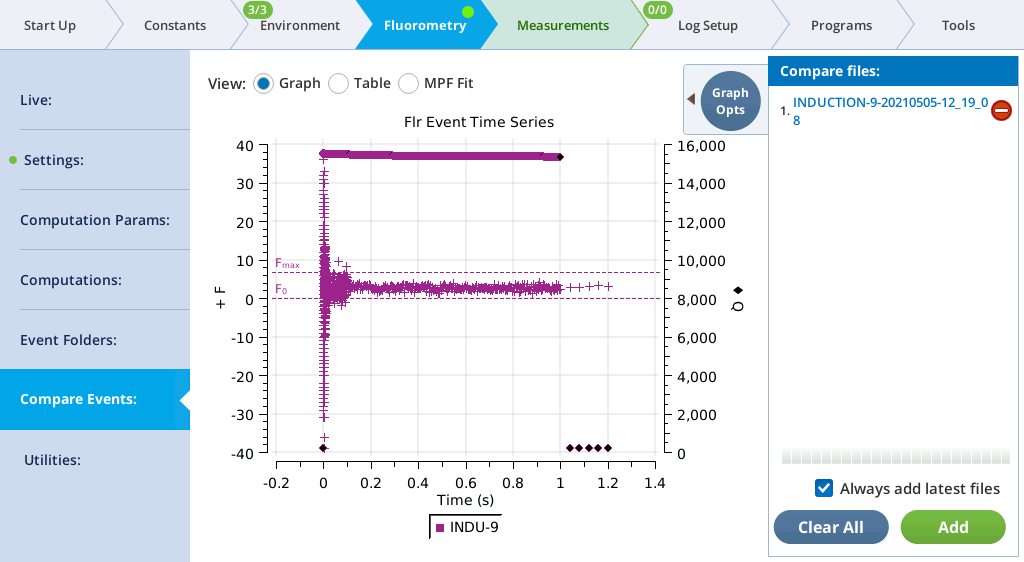
The Settings > Induction screen
On the Induction tab, you can control the following:
- Red target: Red actinic light during the flash.
- Duration: The milliseconds of flash.
- Margin: Number of data points before and after the flash.
- In this example, you'll make a dark-adapted measurement, so turn Actinic light off. (Environment > Light > Fluorometer, set Control Mode to Off.
- Turn the measuring beam on (Fluorometry > Settings > Measuring, Measuring beam On).
- Set up an induction flash (Fluorometry > Settings > Induction). Keep the chamber open.
-
- Red target: 15000 µmol m‑2 s‑1
- Duration: 1000 ms
- Margin: 5 points
- Close the chamber onto a leaf and tap Flash Now.
- View the induction flash results.
- Tap Results to see the results from the most recent flash.
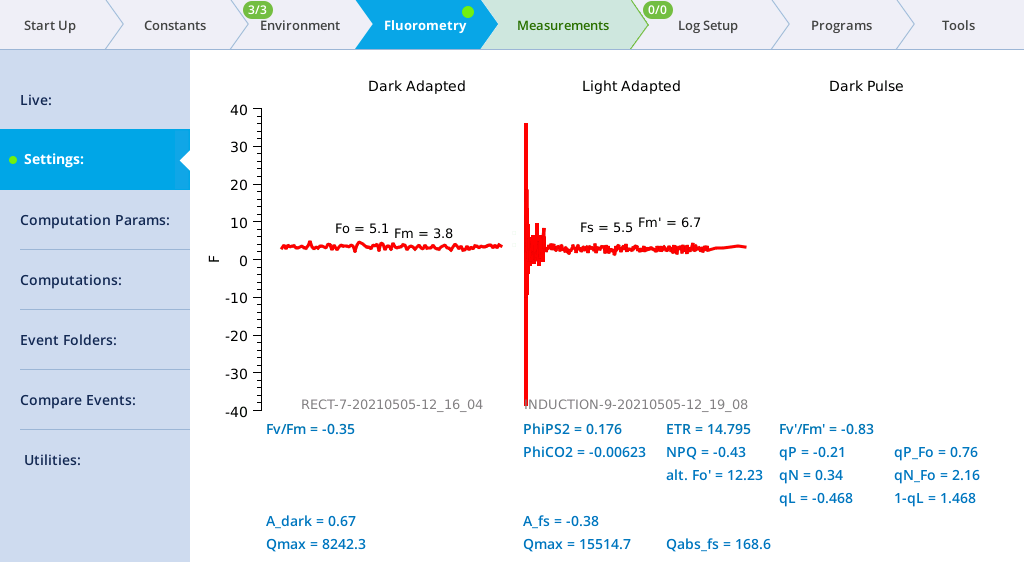
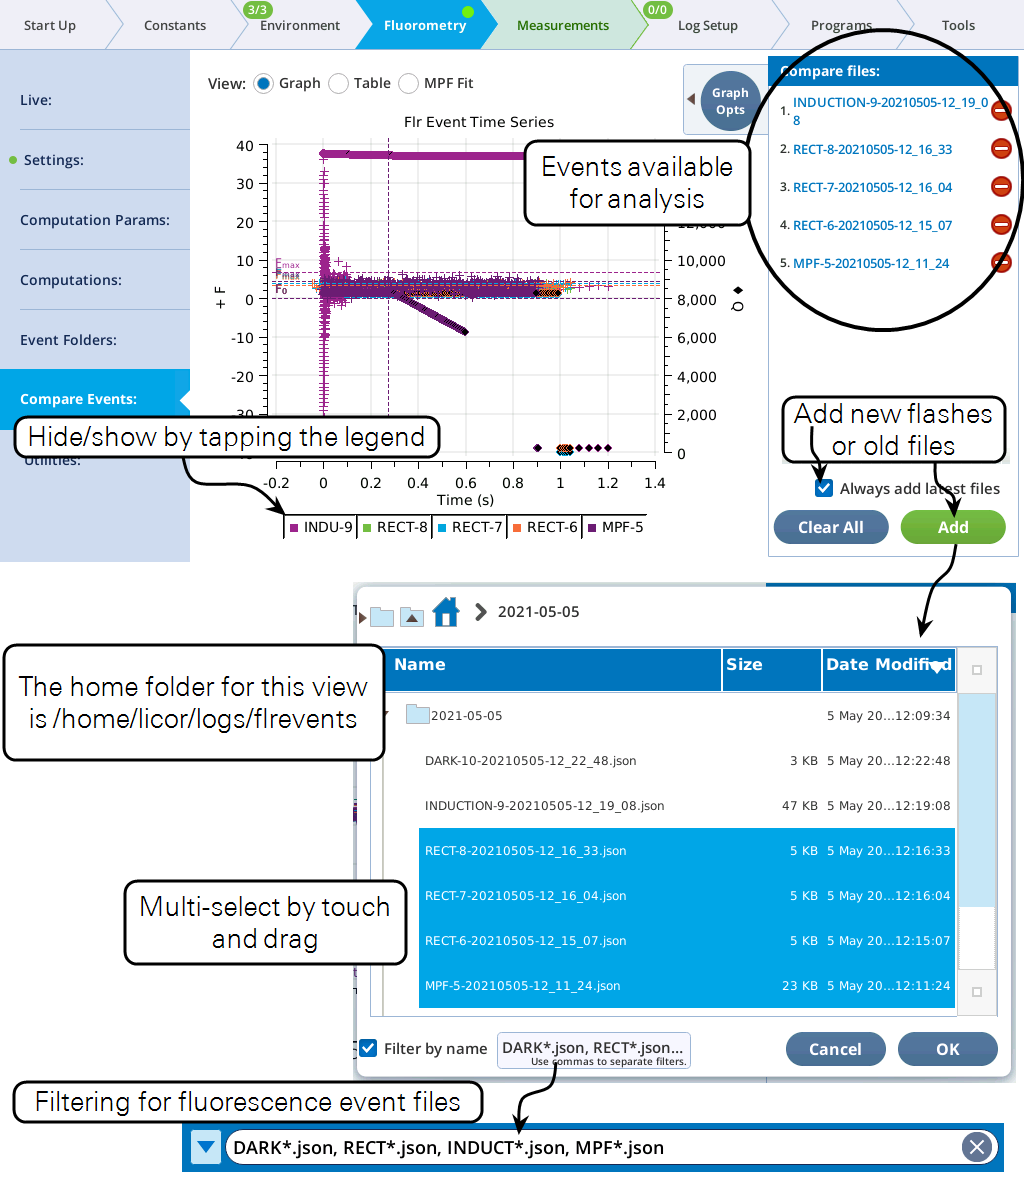
- Tap Files to see the flash data.
- The values for Q represent the instrument's measurement of the flash. The fluorescence data will look meaningless if you did not measure a leaf.
The Settings > Dark Pulse screen
A dark pulse (brief dark period) is designed to measure Fo' on a light-adapted leaf. The timing parameters are shown in Figure 8‑14. You trigger a dark pulse under Fluorometry > Settings > Dark Pulse.

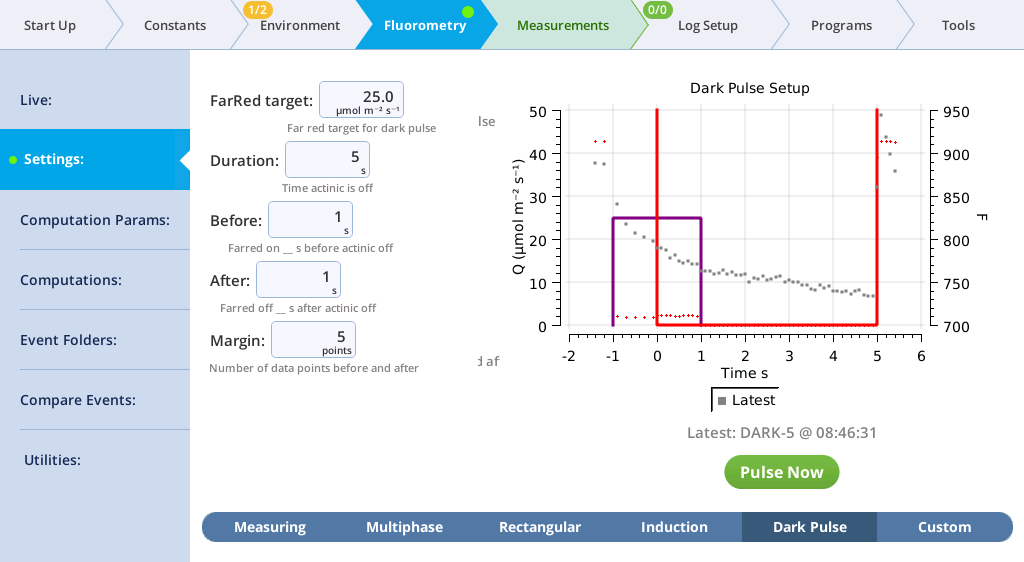
You can control the following:
- FarRed target: Far red target for the dark pulse (maximum of 25 µmol m‑2 s‑1).
- Duration: The milliseconds of dark pulse.
- Before: The number of seconds the far red is on before the actinic is off.
- After: The number of seconds the far red is off after the actinic is off.
- Margin: Number of data points before and after the flash.
- Turn Actinic light on under Environment > Light > Fluorometer. Set the Control Mode to Setpoint of 200.
- Under Fluorometry > Settings > Measuring, set Measuring Beam to On.
- Under Fluorometry > Settings > Dark Pulse, set up a dark pulse. Keep the chamber open.
-
- FarRed target: 25 µmol m‑2 s‑1
- Duration: 5 s
- Before: 1 s
- After: 1 s
- Margin: 5 points
- Close the chamber onto a leaf and tap Pulse Now.
- You probably won't see the far red, (you might if you do the flash in a dark room) but you will see the actinic light turn off.
- View the dark pulse results.
- Tap Results to see the results from the most recent flash.
- Tap Results to see the flash data.
- The values for Q represent the instrument's measurement of the flash. The fluorescence data will look meaningless if you did not measure a leaf.
The Settings > Custom screen
Custom flash events are new to version 2.1. These are described in Custom flash events
Computation Params
Computation params (formerly known as Constants) are introduced in Computation Parameters.
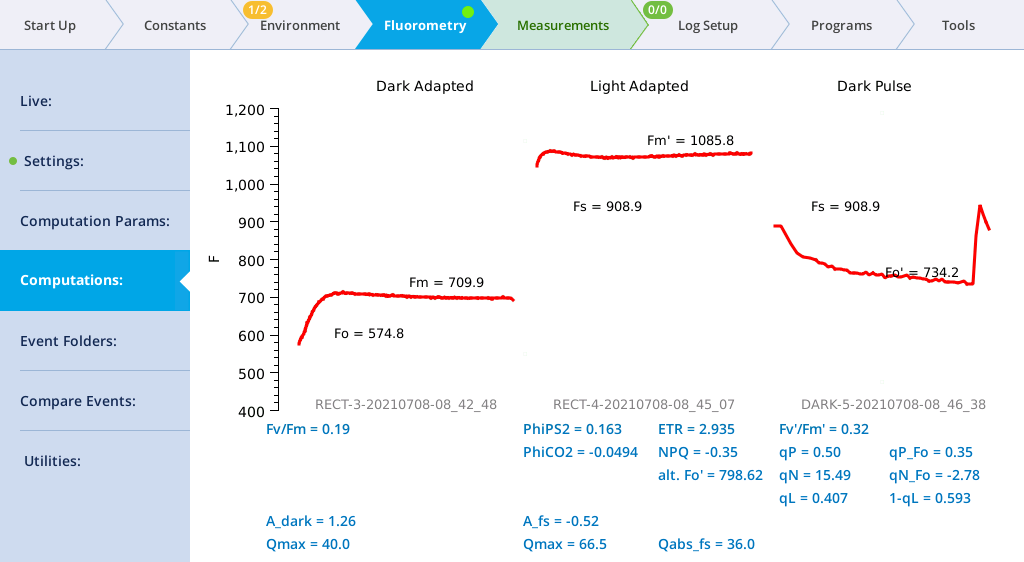
Computations screen
The Computations screen (formerly Results) shows the current state of the fluorescence computations (Group name = Flr), and the dark adapted, light adapted, and dark pulse events on which they are based.
When fluorescence events are triggered manually from their setup pages, the dark adapted, light adapted and dark pulse sections are treated independently. When events are triggered as part of logging to a file, the following rules are followed.
- A log that triggers an FoFm will clear the light adapted and dark pulse sections.
- A log that triggers an FsFm' will update the light adapted, but clear the dark pulse section.
- A log that triggers an FsFm'Fo' will update the light adapted and dark pulse sections.
Light adapted vs dark adapted is determined by the following: A flash is dark adapted if the fluorometer actinic is off, or else the measured Q is less than 1 mol m-2 s‑1 at the time the flash occurred.
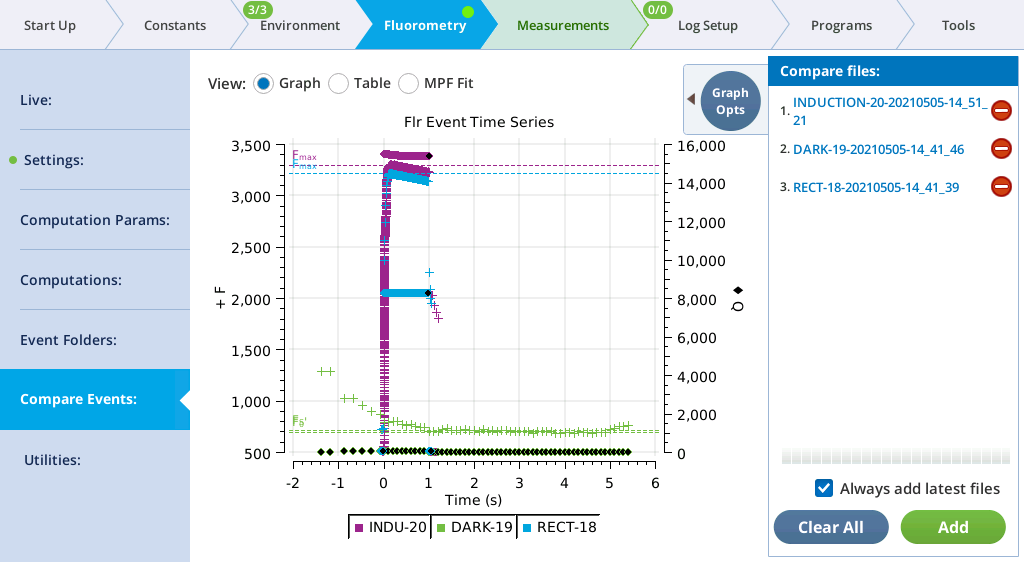
Compare Events
The Compare Events screen (formerly Files) allows you to view and compare up to eight fluorescence events, either by loading them from file, or by capturing when they occur.
Graph
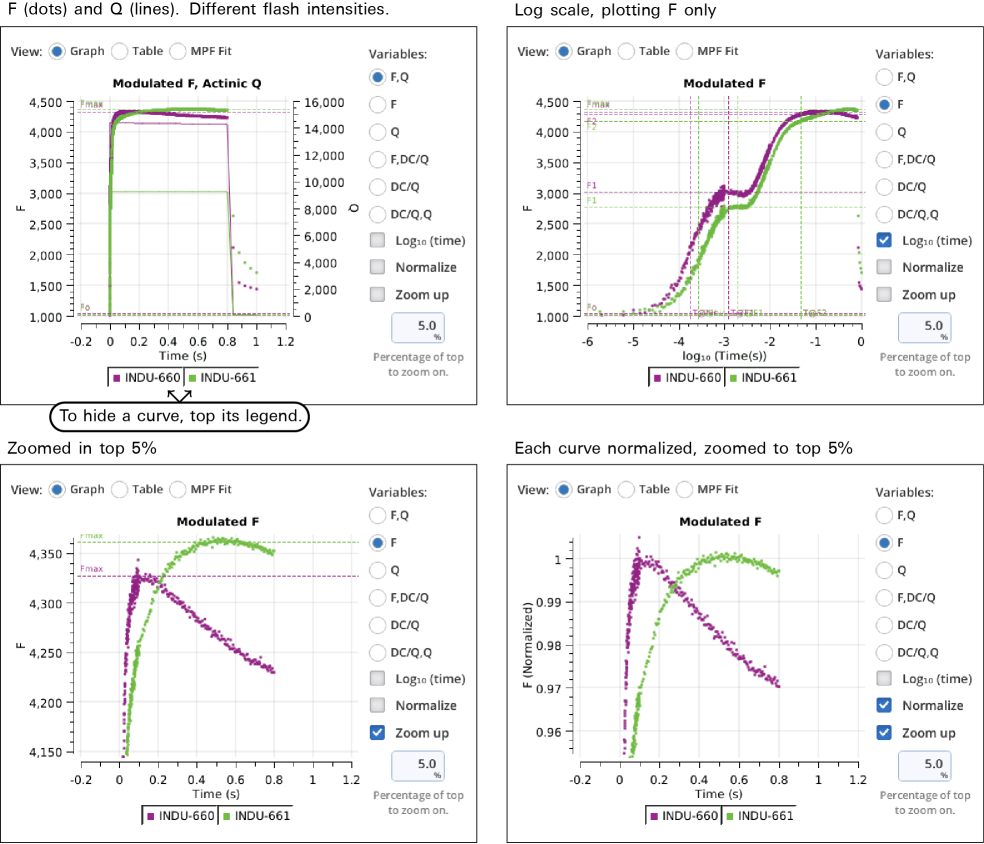
Variables that can be plotted are Q (actinic light), F (modulated fluorescence) and DC/Q (non-modulated fluorescence normalized by non-modulated Q).
- Log10(time) - Apply a log scale to the time axis, which is useful for looking at an induction flash.
- Normalize - Plot each y axis variable as scaled by the maximum value in the data set. In the case of F for a flash event, it is scaled by Fmax.
- Zoom up - Change the scaling of each Y axis so that only the top x% of the data is shown.
Figure 8‑17 illustrates these options.
Using codes
The Filter field in also allows you to specify parts of a flash event to graph. For example, to see a RECT flash without the margin points, specify 3. To plot just the first and third phases on an MPF, specify 4,6. Table 8‑2 shows code value usage.
Code number(s) represent a list of indices. For example, consider a hypothetical flash data set that includes these time series data:
:
"FLUOR":[91, 92, 93, 94, 95, 96, 97, 98, 99, 100]
"CODE": [16, 16, 17, 17, 17, 17, 17, 18, 18, 18]
:
Suppose the filter code is 17. This means the plot will be of data whose 0-based indices (potentially 0 thru 9) are where CODE is 17. The list of indices where this condition is true is
[2, 3, 4, 5, 6]
so whatever is being plotted, it will be only those indices.
Code specifiers can include slice information (using the Python slicing convention), allowing you to further filter the list of indices. The syntax is (no spaces!)
code[start:stop:step]
where code is the code number, start is starting index, defaults to 0, stop is stopping index, defaults to None, and step is the step count, defaults to 1. start and stop can be positive (count from the left end) or negative (count from the right end).
Examples using the above hypothetical flash data are shown in Table 8‑3.
Table
The Table screen shows all events in tabular form. All single-value items from the fluorometer event file are shown in alphabetical order. If more than one type of event file (MPF, Rectangular, Induction, Dark Pulse) is present, some entries will be blank. The summary table in the Files can be filtered, to make it easier to find fields of interest. For example, to see MPF details, clear Induction and Dark, and only MPF fields will appear in the table.
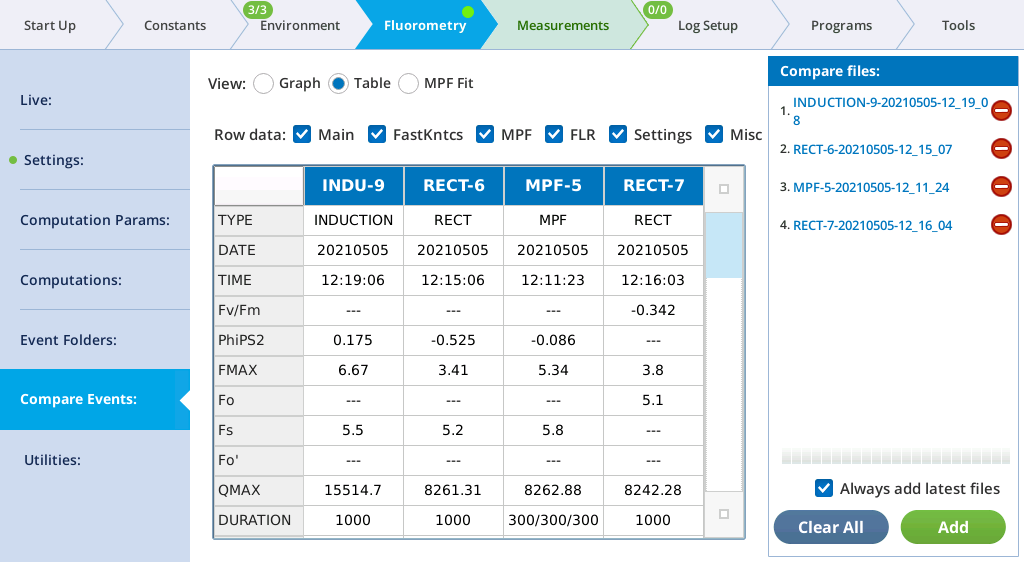
See The Constants tab for a description of what the row labels mean. The last row (VERSION) will show 1 for new files, or 1* for pre-version 1 files. Such files are temporarily converted to version 1 when loaded so will appear in the table with all the new entries filled in.
The Main filter displays the most commonly looked-for variables.

| Label | Comment |
|---|---|
| TYPE | RECT, MPF, INDUCTION, or DARK |
| DATE | Date of event |
| TIME | Time of event |
| PhiPS2 | 1-Fo⁄FMAX (dark adapted) or 1-Fs⁄FMAX (light adapted) |
| FMAX | Fm (dark adapted) or Fm′ (light adapted) |
| Fo | Fo (dark adapted only) |
| Fs | Fs (light adapted only) |
| Fo' | FMIN (dark pulse only) |
| QMAX | Max measured Q during flash |
| DURATION | Event duration (ms). MPF shows 3 values: phase1/phase2/phase3 |
| T@FMAX | Time (ms) of Fmax (Rect and Induction only) |
The Induction filter displays items unique to induction flashes.

| Label | Comments |
|---|---|
| F1 | F at 1st inflection |
| F2 | F at 2nd inflection |
| DCmax | DC max value |
| PhiPS2_dc | PhiPS2 for DC (ϕdc = 1 - DCo/DCmax) |
| DCo | Regression intercept of first few DC points |
| InitSlope | Regression slope of first few DC points |
| T@DCmax | Time (ms) of DCmax |
| T@HIR | Time (ms) to half initial rise (Fo to F1) |
| T@F1 | Time (ms) to F1 |
| T@F2 | Time (ms) to F2 |
The MPF filter displays items unique to multiphase flashes.

| Label | Comments |
|---|---|
| P1 MAXF | Maximum F in phase 1 |
| T@P1 MAXF | Time (ms) of P1 MAXF |
| P1 PREDF | Predicted phase 1 max F |
| P1 DELTAF | P1 PREDF - P1 MAXF |
| P2 INT | Regression intercept phase 2 |
| P2 INT SE | Std error of P2 INT |
| P2 SLP | Regression slope phase 2 |
| P2 SLP SE | Std error of P2 SLP |
| P2 R2 | R squared of phase 2 regression |
| P2 DQDT | Phase 2 ramp change of Q with time |
| P3 MAXF | Max F in phase 3 |
| T@P3 MAXF | Time (ms) to P3 MAXF |
| P3 PREDF | Predicted phase 3 max F |
| P3 DELTAF | P3 PREDF - P3 MAXF |
| Q@P1 MAXF | Q at phase 1 max F |
| Q@P3 MAXF | Q at phase 3 max F |
| RAMP | Ramp (percent) |
The Dark filter displays items unique to dark pulse events.

| Label | Comments |
|---|---|
| BEFORE | Time (s) before start that far red turns on |
| AFTER | Time (s) after start that far red turns off |
| T@FMIN | Time (s) of Fo' |
The Misc filter displays items miscellaneous common items.

| Label | Comments |
|---|---|
| DEVICE | Fluorometer serial number |
| MARGIN | Number of margin points |
| (Far)Red Target | Red target for flashes, far red target for dark pulses |
| MODRATE | Modulation rate (Hz) |
| OUTRATE | Date frequency ({ for Induction, since it varies) |
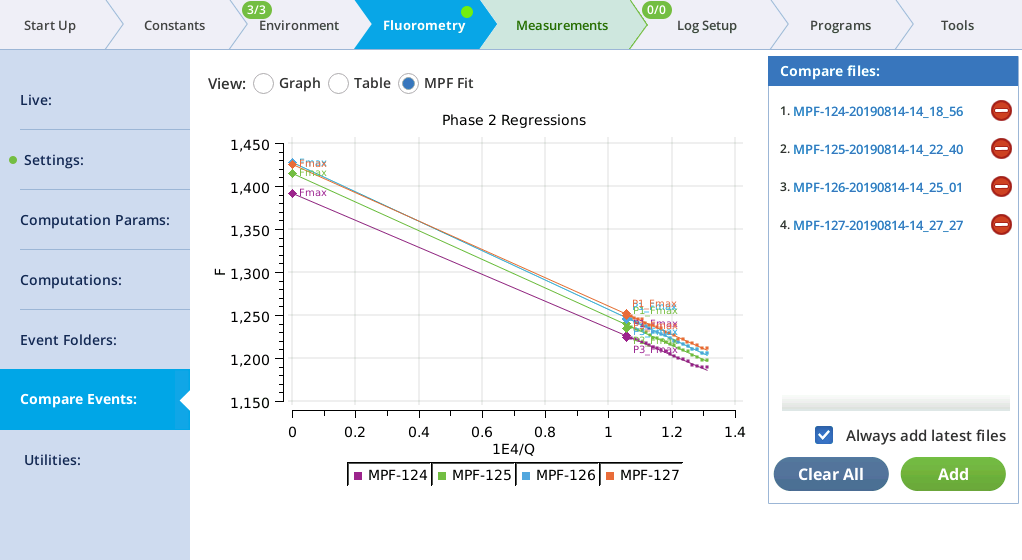
MPF fit
MultiPhase Flash events in the Compare files list will appear on the MPF Fit screen, whose graph shows the Phase 2 regressions. In addition, the Fmax value of the flash is shown (Fmax is whichever is larger: the extrapolated Phase 2 value (P2 INT), or the Phase 1 max (P1 MAXF)). Two validity indicators are also shown, based on the phase 2 regression: the predicted Phase 1 max (P1 PREDF) and the predicted phase 3 max (P3 PREDF). The closer they are to the line the better the phase 2 regression is in predicting phase 1 and phase 3 fluorescence.
Fluorometer event file documentation
Table 8‑6 lists the single-value labels in the four types of fluorometer event files (MPF, RECT, INDUCTION, and DARK), and Table 8‑7 the multi-value entries. Items marked (new) are only present in Version 1 files.
Table 8‑7 lists the time-series data, which is common to all event files. A difference in version 1 files is that the time (SECS) is adjusted by the T_OFFSET value, so that SECS=0 corresponds to the time the flash began (or when the actinic turned off for a dark pulse). In files with no VERSION, the first value of SECS is 0.
Utilities screen
The Fluorometry > Utilities screen is a new feature, and hosts a number of fluorometry related utility programs.
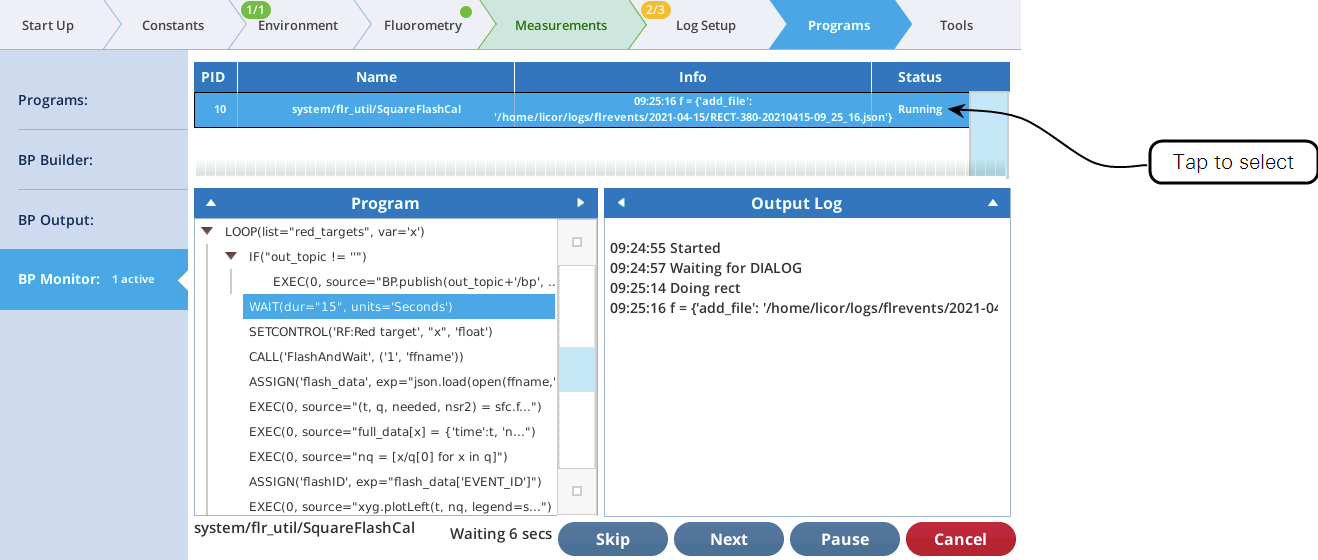
The utility screen layout follows a familiar pattern1: Select a task, tap the Start button, and (if appropriate) watch the results unfold on the table and graph. In all cases, tapping Start launches a BP. If you want a peek behind the scenes to see what the program is doing, tap Programs > BP Monitor, and tap the BP entry:
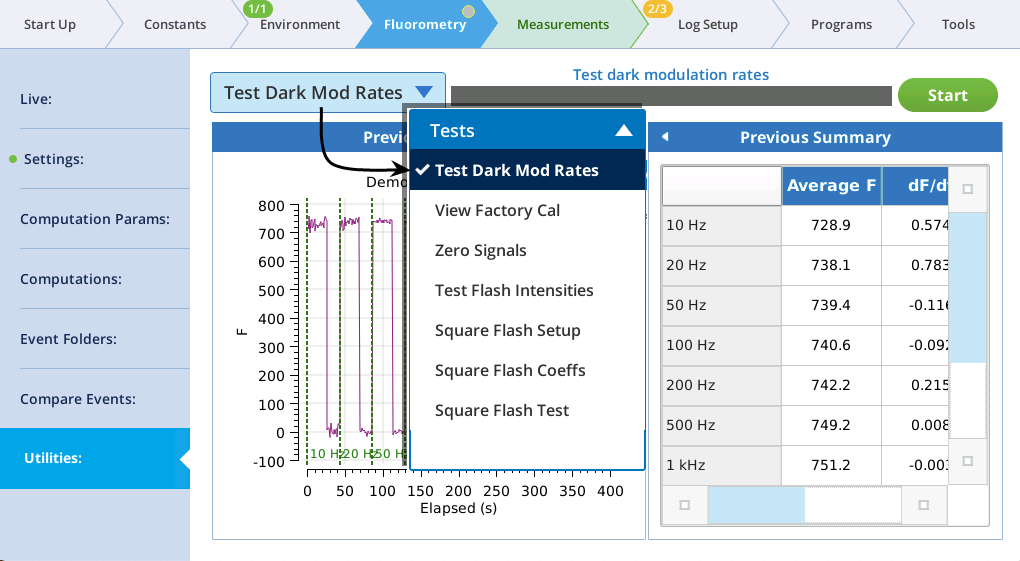
Test Dark Mod Rates
This test is used to find the optimum dark modulation rate, by measuring the tradeoff between increasing frequency (to increase signal-to-noise) at the risk of the integrated light becoming actinic and inducing photochemistry. The test assumes that you are clamped onto a fully dark adapted leaf. The program will increase the dark mod rate while turning the measuring beam on and off to allow fluorescence to relax before going to a new frequency setpoint.
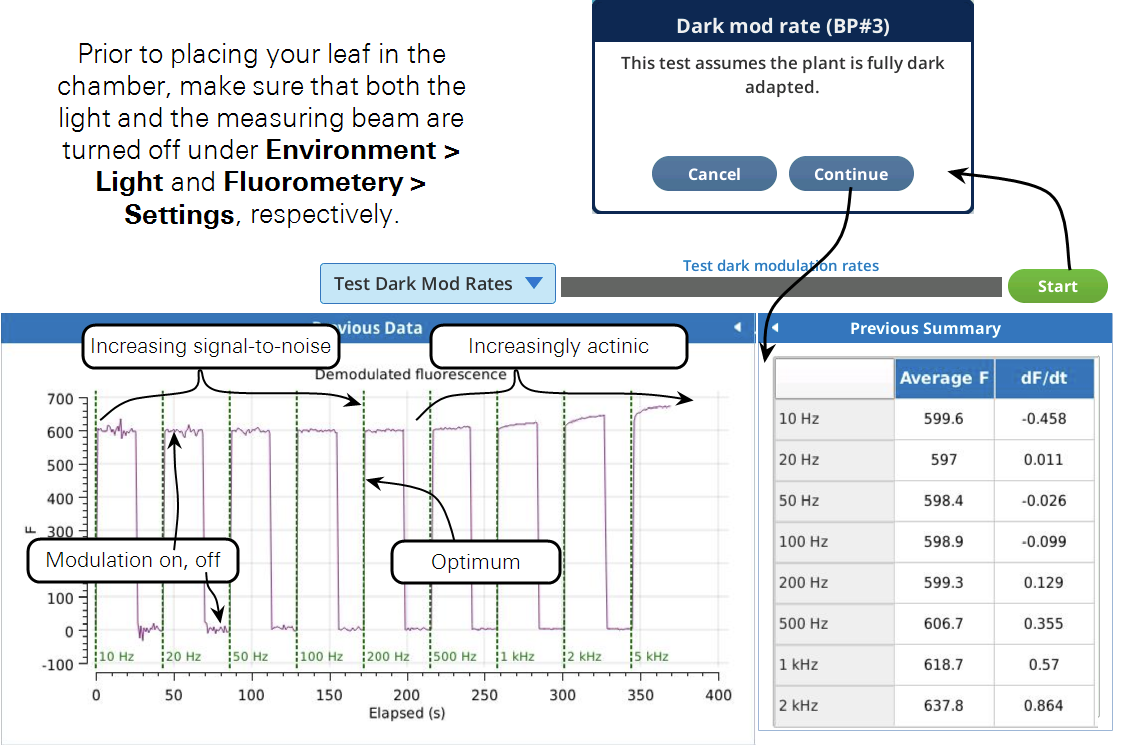
Figure 8‑22 shows a slight increase in fluorescence at 500 Hz which tells us that the integrated light intensity, 0.05 μmol m-2 s-1, is enough to become actinic. For this soybean, a dark modulation rate of 200 Hz would therefore be optimal.
Test Flash Intensities
This test can help you choose optimum flash intensities and durations for a light adapted leaf. It will run through user specified flash intensities, waiting for fluorescence to stabilize prior to each flash. We are interested in the maximal fluorescence recorded during the flash (Fmax), and the time at which FMax occurred (T@Fmax). The program will build a plot of these as a function of flash intensity. When the program is complete, choose the flash intensity from the graph where Fmax does not significantly increase with higher flash intensities. The second thing to consider is the duration of the flash. If doing rectangular flashes, make sure T@Fmax for the flash intensity you picked is shorter than the duration specified during the test setup. If not, rerun the program with a longer duration or pick a higher flash intensity. If you are using this test to optimize your MPF settings, pick the flash intensity the same way, and use the T@Fmax to set your phase 1 duration.
Prior to running this test, clamp onto and light adapt a leaf of interest to the light intensity you will be making your measurements at.
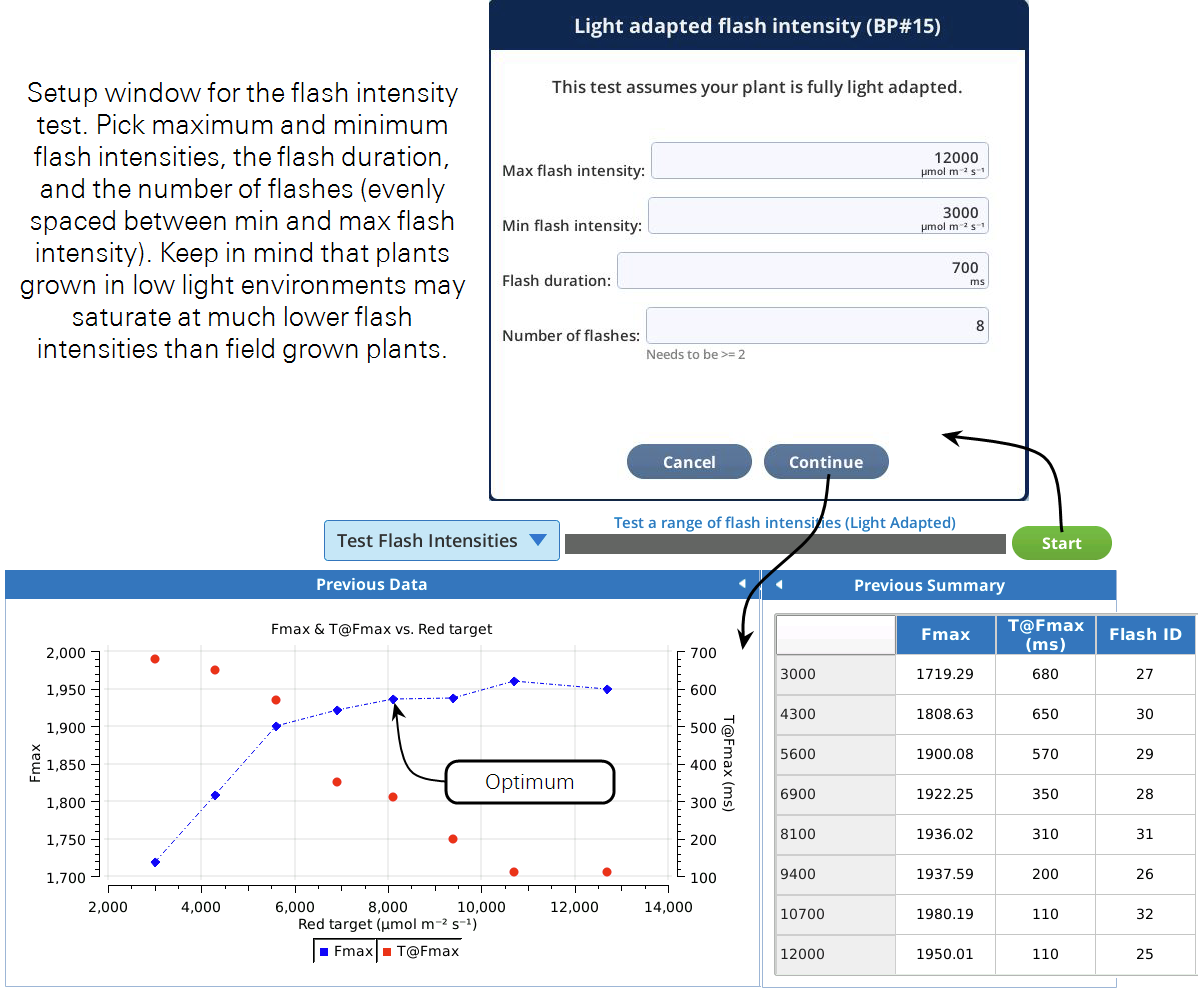
Based on the curve in Figure 8‑23, leveling off around an Fmax of 1950, a red target of 8,000 μmol m-2 s-1 would be a good flash intensity for both the rectangular and MultiPhase flashes. If we did not see the curve reaching a plateau we could either implement an MPF or rerun the test with a higher maximum flash intensity. For the rectangular flash, we can see that T@Fmax occurred at about 300 ms. A duration of 700 ms will then ensure that we capture Fmax during the flash. If we wanted to use the MPF, a good starting point for the phase 1, 2, and 3 durations would be T@Fmax, so about 300 ms each.
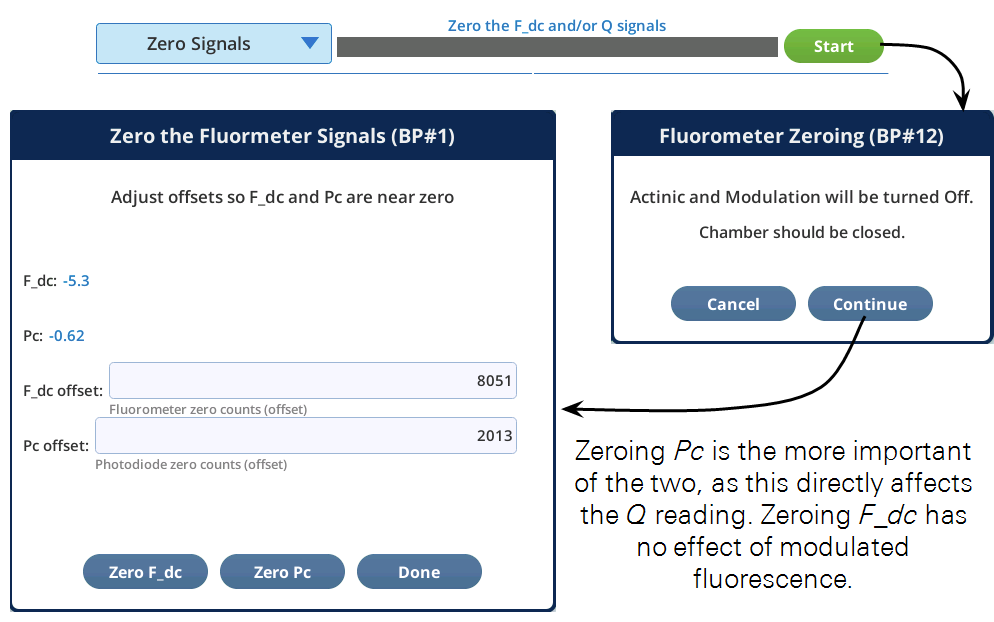
Zero Signals
The fluorometer has two detectors that can be zeroed. Their drift is mostly related to temperature.
View Factory Cal
The View Factory Cal utility lets you view and edit the fluorometer factory calibration coefficients.