
The Log Setup tab is where you create new data files, set criteria related to logging, and configure the log options.
Stability
Stability criteria are used mostly in leaf applications. You can use them for aquatic measurements, but we have found that a specified wait time works well for aquatic measurements.
You can set up stability criteria based on measured and computed variables under the Stability tab. For each variable chosen, stability is based on statistics (a choice of standard deviation, slope, or both) over a time period of your choice.
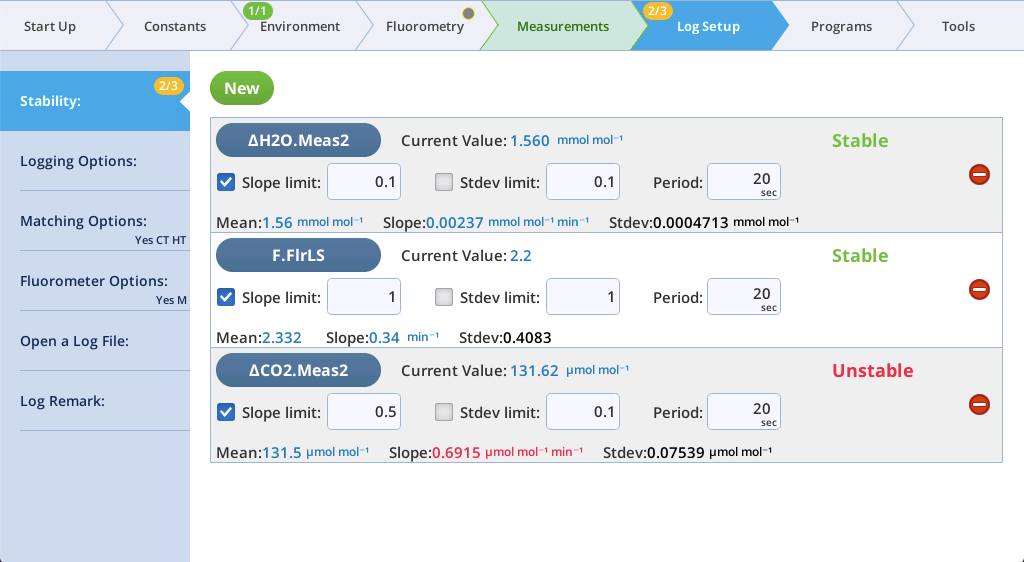
You can add variables (as many or as few as you want) that you will use to define stability criteria. These can be used for casual observation while logging manually, or to specify criteria for triggering an event in a program.
The default settings may or may not be suitable for your application or plants. There are generally two questions researchers ask regarding stability criteria:
- Which variables should I use, and how many?
- Use a variable that you are not controlling, and that makes sense with regards to your research questions. For example, if you are looking at assimilation and controlling on CO2_r, you could use CO2_s, dCO2, or A as the stability criteria.
If you are looking at conductance and controlling on RH_air (directly or dependent on H2O_r and Tair), you could use H2O_r, dH2O, E, or gsw. Any time you are doing fluorescence measurements, add F as a stability criterion.
Typically, use 3 or 4 variables for stability criteria.
- Do I control on slope limit or standard deviation? What value should I use for the slope limit, and how long should my time period be?
- You will never reach complete stability (as in, a slope and standard deviation of 0) because your data will always be affected at some level by noise and plant physiology. It is up to you to decide whether to control on slope or standard deviation.
Use a time Period between 15 and 30 seconds.
To determine the value used for either limit option, the best way is to first select the criteria you want. Next, set a cozy environment for your leaf and clamp on. Set up a graph where you can watch the things you are interested in (A, gsw, F, etc.). When things look stable to you, go back to the Stability screen, and look at the Slope or Standard Deviation value. This will be your “fully stable” value. Edit either the Slope limit or Stdev limit so that it is either equal to or slightly larger than the value you just recorded (note that it is an absolute value, so signs don’t matter). Finally, make sure the limit selection you picked (slope or Stdev) is checked.
Logging options
In its default configuration, the LI-6800 provides a continuous stream of measurements and calculations. You can monitor light levels and photosynthesis rates, for example, while changing those light levels. Over the course of 5 minutes, the instrument will have made hundreds of measurements. The question becomes, which of these will you want to retain for future use?
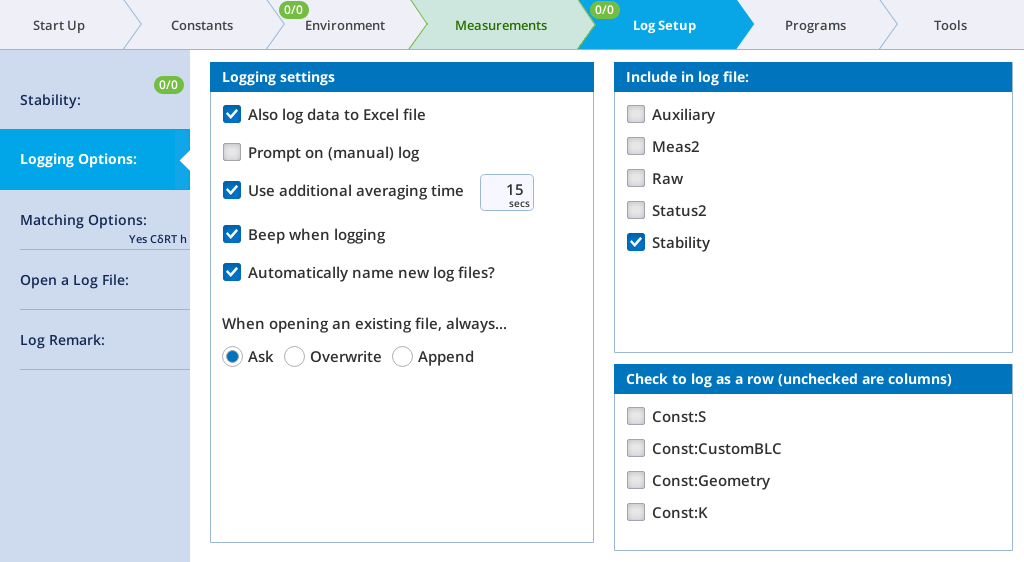
Log settings
- Also Log Data to Excel file: Select this to log all your data values (those you selected, at least) and the equations that are used for computed values into a Microsoft® Excel® file. When you append an existing file (reopen and log more data to it), the instrument will create a new .xlsx file for the appended data.
- Prompt on (manual) log: Select this to open a prompt when logging. Prompts are user-settable questions and system constants that are configured under the Constants tab (see The Constants tab). For example, you may wish to open the prompt so you can enter the leaf area for each sample, or to record the species in your data file. When this option is enabled and a data point is logged, the data will be temporarily stored until you tap Continue or Cancel. If you tap Continue, the instrument writes the data to the log file. If you tap Cancel it discards the data. As soon as the prompt window shows up you can unclamp from the leaf. You can wait on the prompt screen however long is needed as the data is already temporary stored.
- Use Additional Averaging Time: The logged data reflects a potentially longer average time than the 4 second default that is used without extra averaging.
- Beep when logging: Turns the beep on or off.
- Automatically name new log files? Log files will be named with date and time stamp as the file name. Clear the check box to create new log files without the automatic name.
- When opening an existing file, always...
- Ask will give you the choice to overwrite or append the file.
- Overwrite will automatically delete all the data in that file and write new data to the file.
- Append will add the new data after any other data in the file.
Include in log file
You have choices about the groups data to include. These include Meas2, Raw, Stability, FastKntcs, and MPF. We recommend logging all optional variables—data storage is cheap, but good data is expensive. See Summary of symbols for information about these groups.
Check to log as a row
Variables that are rarely changed do not need to be logged as columns, and can be logged as a row in the top of a file. Note that if a group is checked, every time a variable in that group is changed, a new row will be added in the data file indicating the updated variable.
Matching options
The match options available when logging allow independent control of CO2 and H2O matching (Figure 4‑1). These settings only pertain to whether or not a match is triggered and performed as part of a log event; they do not apply to matching initiated by tapping Auto or Manual in the match screen.
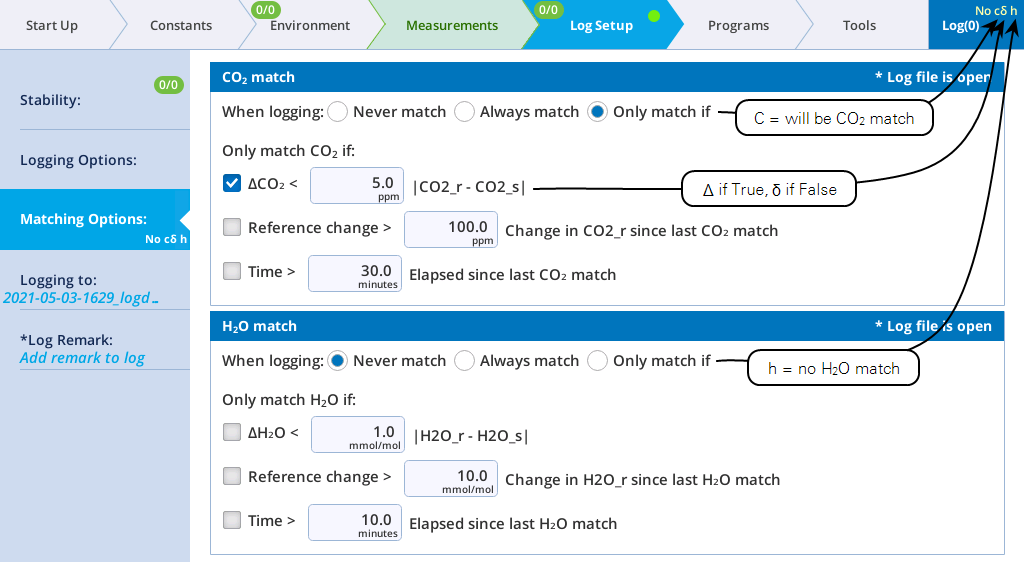
When a log file is open, the bottom line of the Log button indicates if a match will happen at the next log (Yes or No). C or c indicates if CO2 will be matched (C is yes, c is no), and H (yes) or h (no) indicates if an H2O match will occur. If conditional matching (Match only if) is enabled, there will be up to three code letters following the C/c and H/h, one for each item checked. Δ for ΔCO2 or ΔH2O if true (δ if false), R for reference if true (r if false), and T for time if true (t if false). Examples:
No c h - No match is happening, because both CO2 and H2O are set to Never match.
Yes C h - A CO2 match will occur, because it is set to Always match.
Yes CΔt hδ - CO2 is conditional on ΔCO2 (true) and time (false). H2O is conditional on ΔH2O (false).
Yes cδrt HδRt - Both CO2 and H2O are conditional based on all three options. There will be an H2O match, triggered by the reference change (R).
When a match is triggered because of only one gas (CO2 or H2O), only that gas will be matched.
The protocol for matching is described in Matching the IRGAs.
Fluorometer options
Under Log Files > Fluorometer Options, you specify what the fluorometer should do when a data point is logged (either by pressing the log button or automatically with a program or Background Program).
From the Flr Action at Log: menu, you can select from the following: 0: Nothing, 1: FoFm (dark) or FsFm' (light), and 2: FoFm (dark) or FsFm'Fo' (light). The second menu, Flash Type, presents four options: Auto: RF or MPF, Rectangular, MultiPhase, or Induction. Regarding the computation of Fo’, if you chose FsFm’ there will still be an Fo’ in the data and it will be computed using the last dark adapted measurement following the method of Baker and Oxborough, 1997 (1). If you choose FsFm’Fo’ then we use far-red light to measure Fo’.
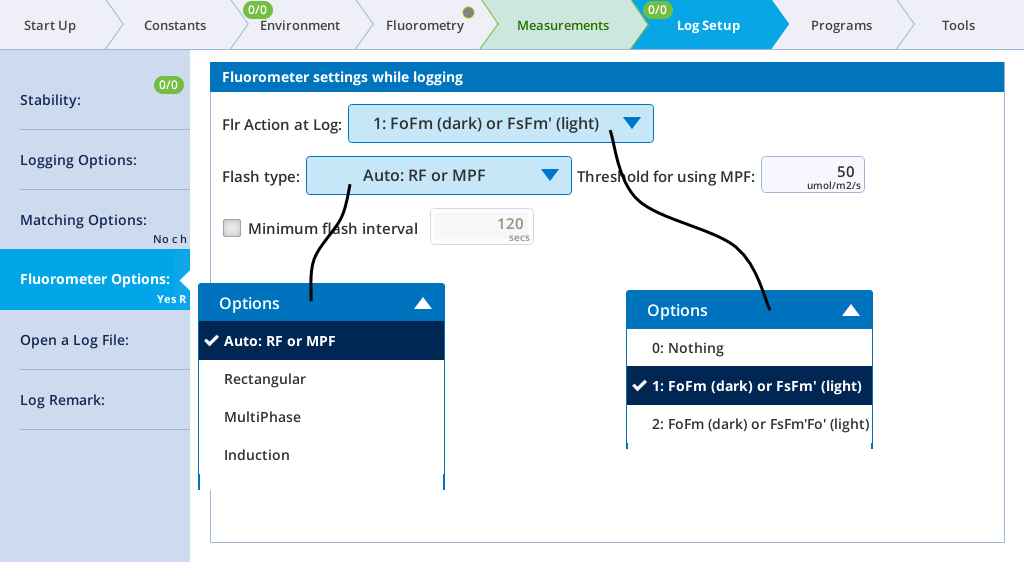
The Auto: RF or MPF option lets the system decide between a rectangular flash (RF) and a multiphase (MPF) for the logged flash event. The decision is based on the fluorometer's Q value (Q in group FlrLS) at the time of the log event. At low light levels, it is best to use the rectangular flash rather than the multiphase flash.
The option for Minimum flash interval allows frequent logging with occasional fluorescence events. The LI-6800 keeps track of the time since previous flash (TSPF), and if a log event happens with a TSPF less than the specified value, the Flr Action for that log event will in effect be 0: Nothing but just for that event. Thus, you can log every 10 seconds, for example, but only have fluorescence events every 2 minutes. This applies to manual and automatic logging. Also, the "previous flash" on which the timing is based is just that. It doesn't matter if that flash was triggered manually or automatically by a log event.
Open a log file
A log file is required to store measurements. You can either create a new file or append an existing file. You can also create a folder structure for your files and assign each log file a name. To create new file, tap Log Files > Open a Log File. Tap New File. Or, edit an existing file by selecting a file and then tapping Open.
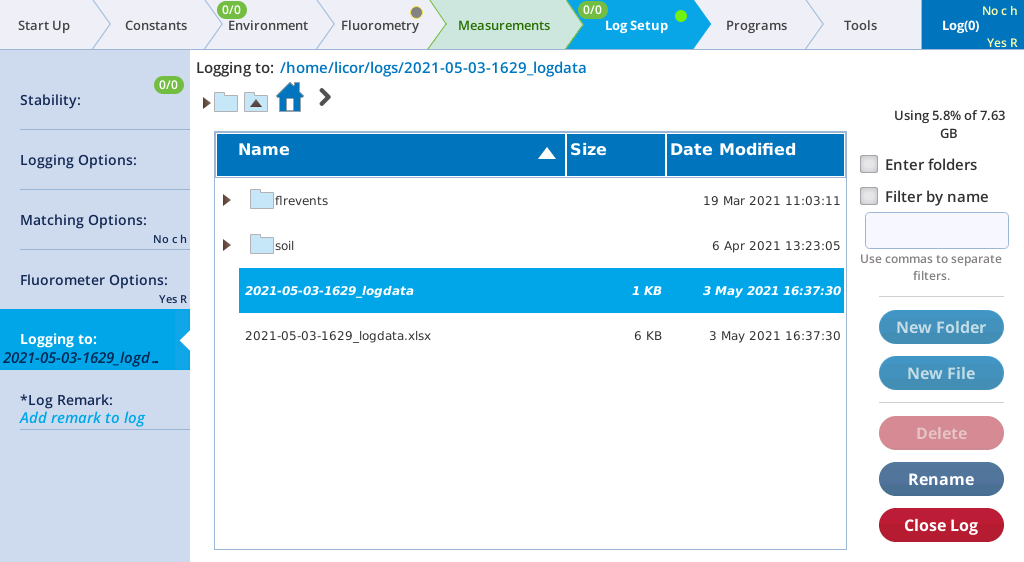
Once a log file is opened, the Log button at the top right of the display will be displayed.
Observations can be logged by pressing the Log (0) button on the screen or the log button on the sensor head. A short tap (<¼ second) is all that is required to log a measurement to the file. A successful log is indicated by the Log (#) incrementing with each new log (and a beep, if Beep when logging is enabled). Observations can be logged automatically with either an Auto Program or Program.
You will not be allowed to open a new log file if the file system is greater than 99.9% full (<4.67 MB available). The instrument will notify you of the issue.
When the measurement and log event are underway, the instrument will show **Log pending** in the upper right of the display.
Log remark
This option is active when a log file is open. Remarks are free form text rows saved in the data file to help you understand a particular measurement. For example, "Wow, this plant looks terrible," or "Apparently, deer do eat sotol." For plant # or treatment ID, consider adding a User Constant (see User). When you enter a remark, it will be saved in the log file with the time stamp.
- Where are the remarks logged?
- In text data files: Remarks are recorded in the text data file, either in the header information or inline with the other measurements. Remarks will always include the time stamp.
- In Excel files: Remarks are in a separate tab from the measurements, one called Remarks. Here again, remarks will always include the time stamp.