Click on the LI-840A program icon to start the program. The LI-840A Main Window appears. Select Connect from the File menu, or click on the connect icon on the toolbar, beneath the File menu. You are asked to select the serial port to which the LI-840A is connected, and the output interval at which data are output (0.5 to 20 seconds, in 0.5 second increments).
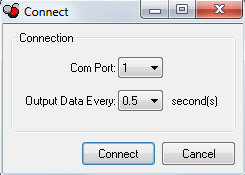
Choose a COM port and the output interval and click Connect. If the instrument is connected properly, data will begin to appear in the Main window (below):
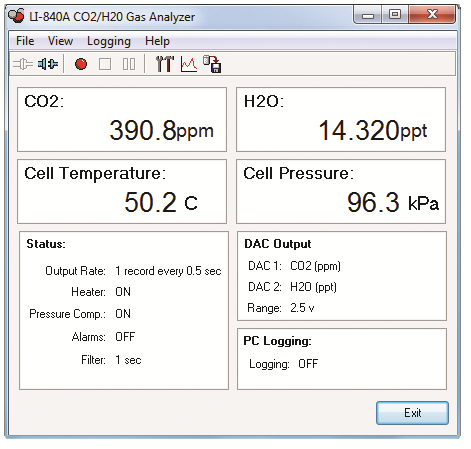
The Main Window displays the CO2 concentration (ppm) and H2O concentration (°C or mmol/mol), cell temperature and pressure, and the status of various LI-840A parameters. There are also three menus used to configure the LI-840A, perform zero and span calibrations, and set up the parameters for recording data.
Note that you can view H2O concentrations in units of degrees C or mmol/mol. To change the units in the Main window, go to the View menu and toggle the H2O in ppt menu item on and off. Alternatively, you can click on the H2O units being displayed in the Main window to change the display.
The LI-840A parameters displayed in the Main window are as follows:
| Parameter | Description |
|---|---|
| Cell Temperature | Temperature (°C) in the LI-840A optical cell. This value should remain near 50 °C when the heater is turned ON. |
| Cell Pressure | Barometric pressure (kPa) measured in the LI-840A optical cell. This value can be used to correct measurements for the effects of atmospheric pressure. |
| Output Rate | Displays data output rate chosen at connection. |
| Heater | Shows status of heater (ON/OFF), which is used to maintain the optical cell at a constant 50 °C. The heater is turned ON/OFF in the Settings window. |
| Pressure Comp. | Shows whether pressure compensation is ON/OFF. When ON, measurements are corrected for the effects of pressure fluctuations on gas density and band broadening. |
| Alarms | Shows status of High and Low alarms, whose values are set in the Settings window. Alarms are enabled (ON), or disabled (OFF). |
| Filter | Shows the current value for software signal averaging, set in the Settings window. The filter can be set from 0 (no signal averaging) to 20 seconds. |
| DAC Output | Displays source channels for DAC1 and DAC2, and the voltage output range (0-2.5V or 0-5V). |
| PC Logging | Shows "Off" if data are not being logged to a file, or "Logging" when data are being logged to a file. |
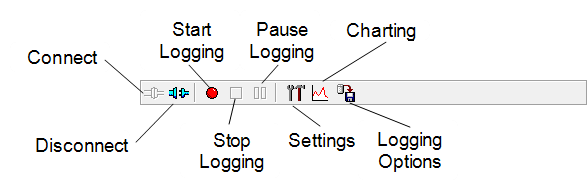
Using the Toolbar
The toolbar in the Main window contains shortcuts for some of the commonly used menu items:
Settings Window - Setting Operational Parameters
The Settings window contains parameters related to initial setup of the LI-840A, including signal filtering, high and low alarm setup, heater and pressure compensation options, and DAC output sources. Choose Settings from the View menu (or click on the toolbar icon) to open the Settings window:
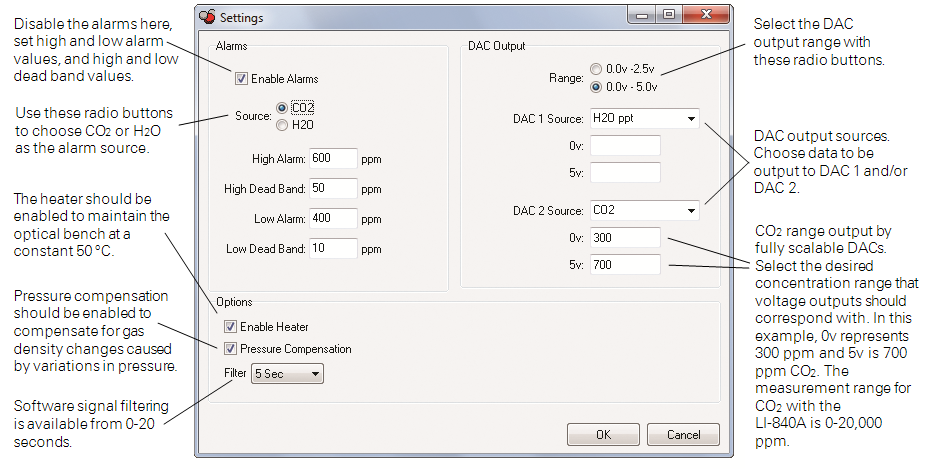
Enable Heater
The Heater should be enabled to maintain the optical bench at a constant 50 °C.
Pressure Compensation
Enable the Pressure Compensation check box to automatically correct gas concentration values for changes in cell pressure. In most cases this should be turned on; disabling this feature means that no pressure correction is desired in the gas concentration calculations, which can lead to erroneous measurements.
Filter
Shows the current value for software signal averaging. The filter can be set from 0 (no signal averaging) to 20 seconds. Note that increasing the filter decreases instrument noise but reduces the response time.
DAC Output
Analyzer output for up to 2 values (none, CO2, H2O mmol/mol, H2O °C, Cell Temperature, or Cell Pressure) can be recorded by connecting a logging device to the terminal strip on the front of the analyzer. Output is linear, and is selectable at 0-5V or 0-2.5V. Choose the full-scale voltage output range and the source for DAC 1 and/or DAC 2. You can also choose a range over which to scale the output(s); you can achieve better resolution by scaling the output(s) over a narrower range when appropriate.
The DACs in the LI-840A are bipolar, and will go slightly negative (~-0.100V). This can happen, for example, if the cell becomes contaminated or from small random perturbations when the CO2 concentration is near zero. See Cleaning the Optical Bench for instructions on cleaning the cell should it become contaminated.
Voltage output is measured by attaching the positive lead from the logging device to terminal 9 (V Out 1), or terminal 7 (V Out 2) on the LI-840A terminal strip. Connect the negative lead to position 10 (GND), or position 8 (GND).
The CO2 or H2O concentration can be calculated from the DAC output voltage as follows:

where V is the measured voltage, XF is the full scale value for CO2 or H2O output (entered in the Settings Window as the 2.5 or 5 V value, up to 20,000 ppm for CO2), XZ is the zero value entered, and Vmax is the full scale DAC output voltage selected (5V or 2.5V).
Example: The DAC output range selected is 0-5V (Vmax), the zero CO2 value entered is 0 ppm (XZ), the full scale CO2 value entered is 2000 ppm (XF), and the measured output voltage (V) is 2.9V. To calculate the CO2 concentration from 3‑1 above,
3‑2

= 1160 ppm.
Example: The DAC output range selected is 0-5V (Vmax), the zero CO2 value entered is 1000 ppm (XZ), the full scale CO2 value entered is 2000 ppm (XF), and the measured output voltage (V) is 2.9V. To calculate the CO2 concentration from 3‑1 above,
3‑3

= 1580 ppm.
The H2O concentration (mmol/mol) can be calculated from the DAC output voltage as follows:

where V is the measured voltage, XF is the full scale value for H2O output (entered in the Settings Window as the 2.5 or 5V value, up to 60 parts per thousand), XZ is the zero value entered, and Vmax is the full scale DAC output voltage selected (5V or 2.5V).
Example: The DAC output range selected is 0-5V (Vmax), the zero H2O value entered is 0 ppm (XZ), the full scale H2O value entered is 60 mmol/mol (XF), and the measured output voltage (V) is 2.9V. To calculate the H2O concentration from equation 3‑4 above,
3‑5

= 34.8 mmol/mol.
Example: The DAC output range selected is 0-5V (Vmax), the zero H2O value entered is 10 mmol/mol (XZ), the full scale H2O value entered is 60 mmol/mol (XF), and the measured output voltage (V) is 2.9V. To calculate the H2O concentration from equation 3‑4 above,
3‑6

= 39.0 mmol/mol.
Converting Voltage Output to Cell Temperature
Cell temperature can be calculated from the DAC output voltage as follows:
3‑7

where V is the measured voltage, XF is the full scale value for temperature output (entered in the Settings Window as the 2.5 or 5V value, up to 100 °C), XZ is the zero value entered, and Vmax is the full scale DAC output voltage selected (5V or 2.5V).
Converting Voltage Output to Cell Pressure
Cell pressure can be calculated from the DAC output voltage as follows:
3‑8

where V is the measured voltage, XF is the full scale value for cell pressure output (entered in the Settings Window as the 2.5 or 5V value, up to 115 kPa), XZ is the zero value entered, and Vmax is the full scale DAC output voltage selected (5V or 2.5V).
Converting Current Output to ppm CO2 or mmol/mol H2O
Current output can be measured by connecting the positive input of the data logging device to positions 11 or 13 (4-20 mA 2 or 4-20 mA 1), and the negative input to position 12 or 14 (GND). The current output at positions 11 and 13 is non-isolated, and is rated to drive a 250 ohm load.
Note: These channels mirror their respective voltage output channels; current output channel 1 uses the variable chosen for voltage output 1, and current output channel 2 uses the variable chosen for voltage output 2. Similarly, a voltage output of 0 volts corresponds to a current output of 4 mA, and when the voltage outputs are at full scale (2.5 or 5 V), the current output will be 20 mA.
To convert current output (I) to CO2 or H2O concentration in your computer or other output device, the following equation can be used:
3‑9

where I is the measured current, XF is the full scale value for CO2 or H2O concentration output (entered in the Settings Window as the 2.5 or 5V full scale value, up to 20,000 ppm for CO2), and XZ is the zero value entered.
Example: The zero CO2 value entered is 0 ppm (XZ), the full scale CO2 value entered is 2000 ppm (XF), and the measured current output (I) is 16.25 mA. To convert to ppm CO2:
3‑10

= 1531.25 ppm.
CO2 Span Range
The span range entry field determines the maximum CO2 range over which the LI-840A will make measurements. The factory calibration range for the LI-840A is 0-20,000 ppm. Note that there is a benefit to selecting a narrower range if that range is adequate for your experiment. The narrower range provides better resolution in terms of the digital-to-analog converter (DAC). For example, if you choose a range of 0-1500 ppm, each step of the DAC is able to resolve twice as many data points as compared to the 0-3000 ppm range, which results in better resolution.
Alarms
Allows you to enable/disable the alarms, and enter high, low, and dead band values. A complete discussion can be found in Alarms.
Using the Terminal Strip
The terminal strip is located on the front panel of the LI-840A. To connect the wires, insert the bare wire end into the appropriate terminal and tighten the screw above that terminal using the small flat head screwdriver in the spare parts kit. The front face of the terminal strip can be removed to aid in connecting the wires by pulling straight out on the face.

The terminal positions are as follows, reading from left to right:
| Terminal | Label | Description |
|---|---|---|
| 1 | 12-30 VDC | Voltage In, 12-30 VDC |
| 2 | GND | Ground |
| 3 | High Alarm | High Alarm |
| 4 | GND | Ground |
| 5 | Low Alarm | Low Alarm |
| 6 | GND | Ground |
| 7 | V OUT 2 | Voltage output channel 2 |
| 8 | GND | Ground |
| 9 | V OUT 1 | Voltage output channel 1 |
| 10 | GND | Ground |
| 11 | 4-20 mA 2 | Current output channel 2 |
| 12 | GND | Ground |
| 13 | 4-20 mA 1 | Current output channel 1 |
| 14 | GND | Ground |