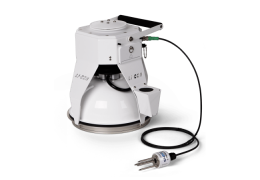
Software overview
In this section, the Smart Chamber user interface software is explained in detail, beginning with a general tour of the software, an overview of programming and starting measurements, data viewing, and file transfer, and concludes with a data dictionary describing the Smart Chamber variables.
The Smart Chamber user interface consists of five main screens:
- Home Page, where you start measurements and view live data.
- Files, where you create new files, view data, and download files.
- Settings, where you will connect to analyzers and program measurements.
- Network, where you update Wi-Fi settings and other network settings.
- Diagnostics, where you can view information about your instrument.
Basic navigation
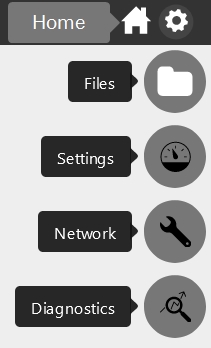
At the top right of the any page, you will see a cog icon for Options. Click this button to navigate to other pages of the interface. From any of the other pages, you can click the home button to return to the Home Page.
Status bar
At the top of any window, the Status bar shows battery charge status, Smart Chamber performance status (green or red dot), and date and time. The battery icon will turn red when your battery has less than 10% charge remaining. The analyzer status icon will turn red with an exclamation mark if your analyzer is not warmed up or is sending an error message (see Troubleshooting for details).

The Home page
The Home page is the initial page that loads when you connect to the instrument.
Start button
At the top left of the screen, you will find the Start button and measurement Status information. Click the start button the initiate a measurement. To the right of the status information, Repetition and Measurement progress bars show the status of any measurement that is underway.
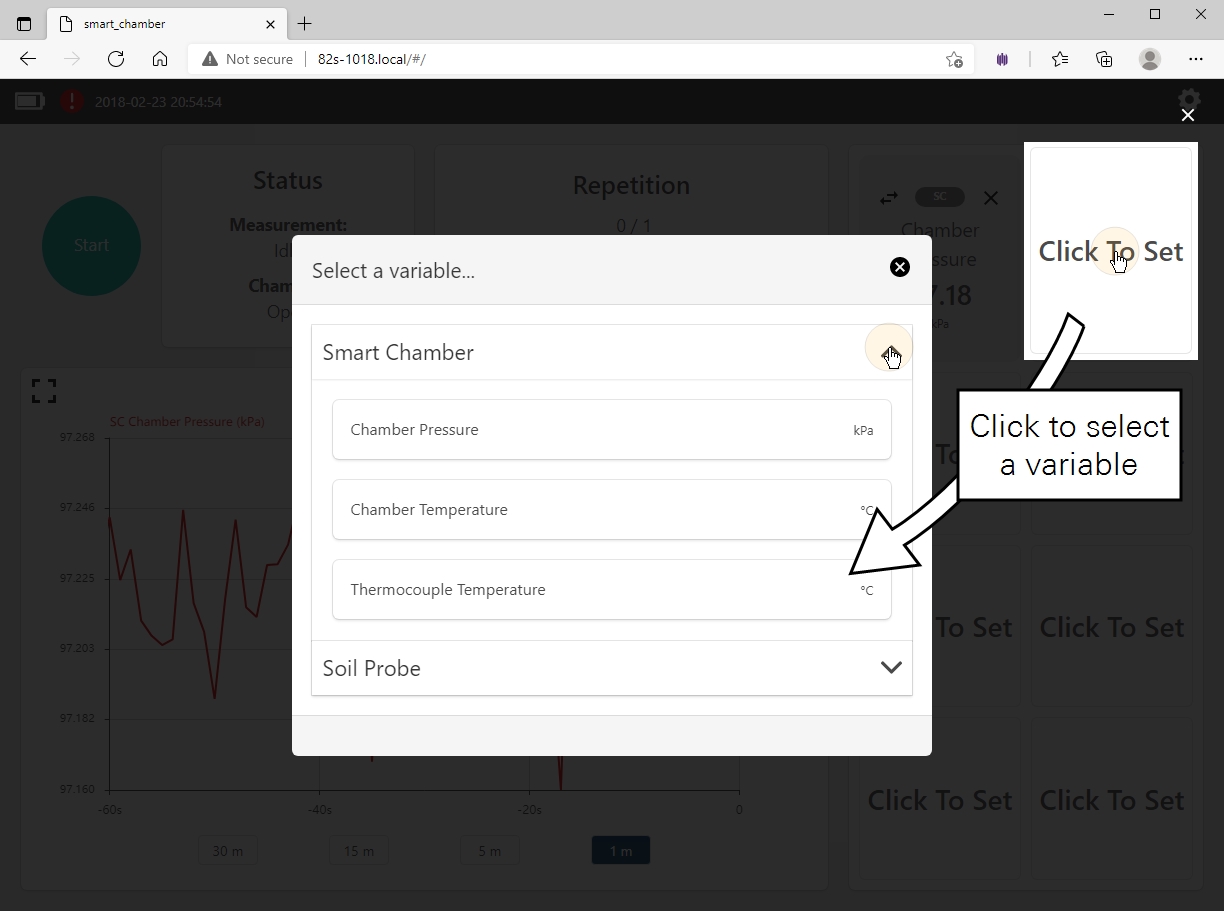
Variables list
The right-hand portion of the page provides variables representing parameters being measured by the Smart Chamber and attached analyzers. You can reorder or remove a variable by clicking the arrows or X.
You can add a new variable by clicking on a box displaying Click To Set. Smart Chamber refers to the variables being measured by the Smart Chamber, while Soil Probe shows variables being measured by the Stevens HydraProbe (if connected). Additional menus will be automatically populated when you connect to an analyzer, including fluxes (if you are using a LI-COR gas analyzer). The Smart Chamber will save your variable configuration so it will stay the same if you leave the software or navigate to other pages.
Graphs
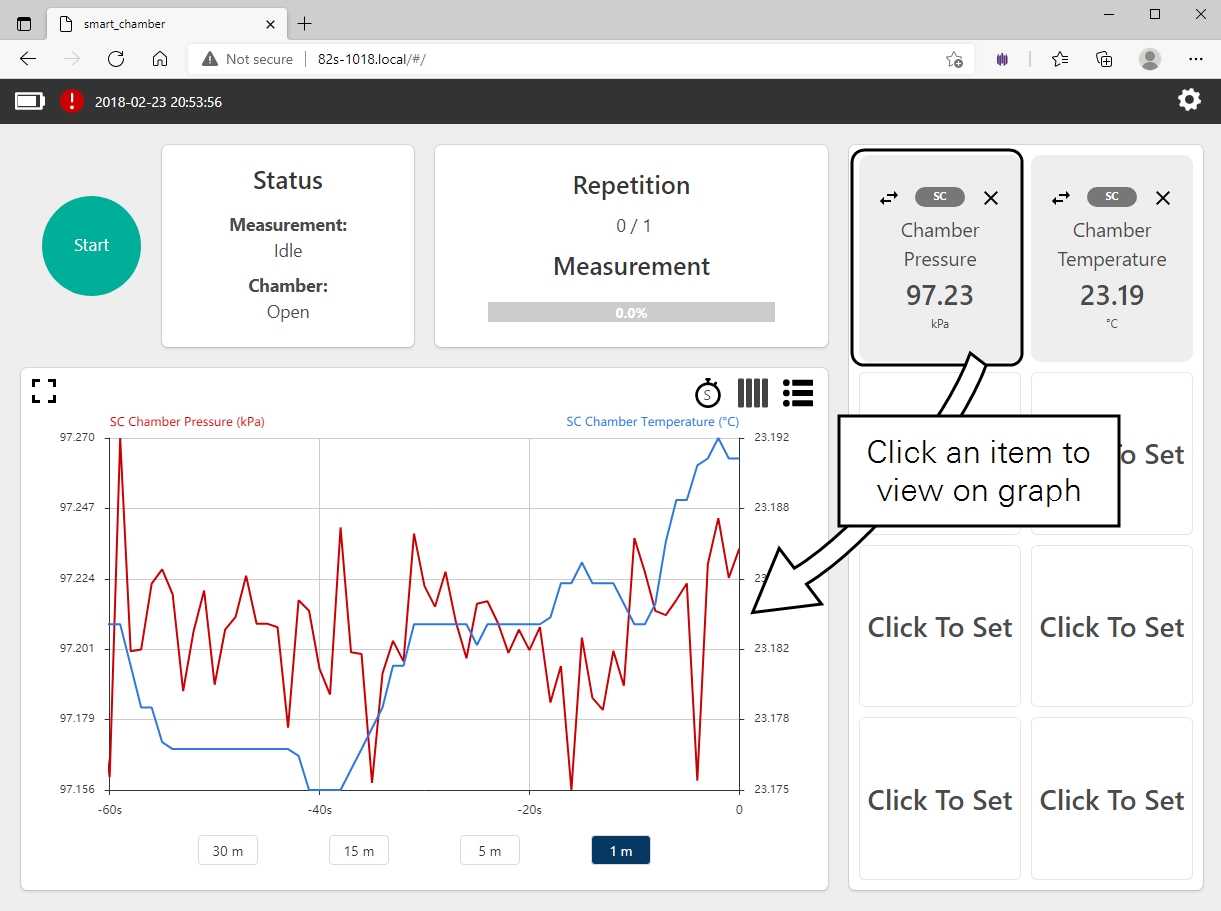
The bottom-left section of the Home Screen displays live graphs of up to two variables at a time, selectable from the displayed variables in the right hand section of the page. Click the variables on the right-hand portion of the screen to display them on separate Y-axes. The bottom of the graph display also allows you to switch between 30-, 15-, 5-, and 1-minute time series.
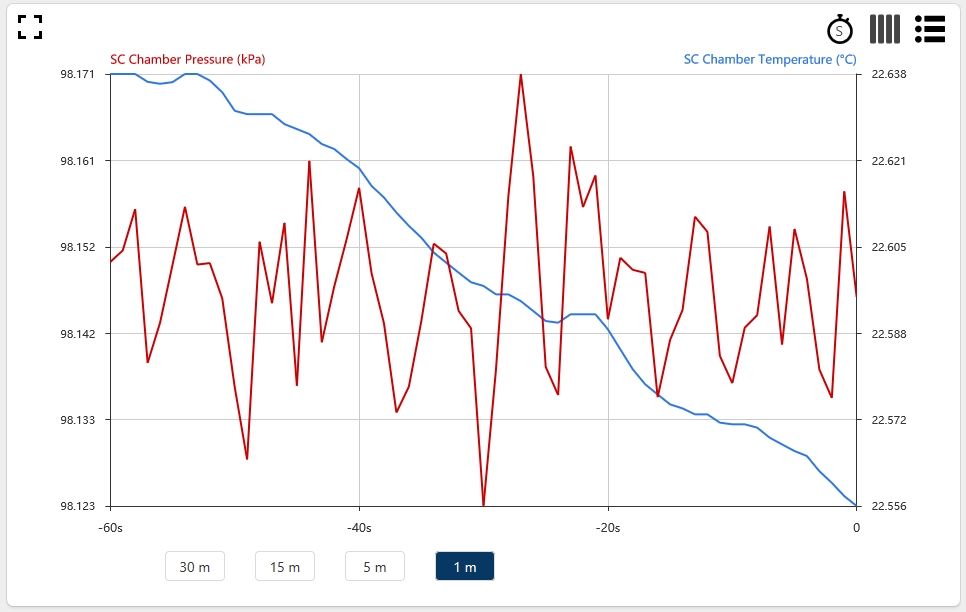
Additionally, use the stopwatch icon to switch between minutes or seconds. The small icon with three vertical bars can be used to show or hide the vertical bars in the graph, while the icon with dots and horizontal bars next to it provides a legend for the colored bars. Lastly, the graph can be expanded to the full window size by clicking the box icon at the top-left corner of the graph.
The Files page
The Files page consists of three main sections: a memory remaining indicator, data output section, and a list of data files.
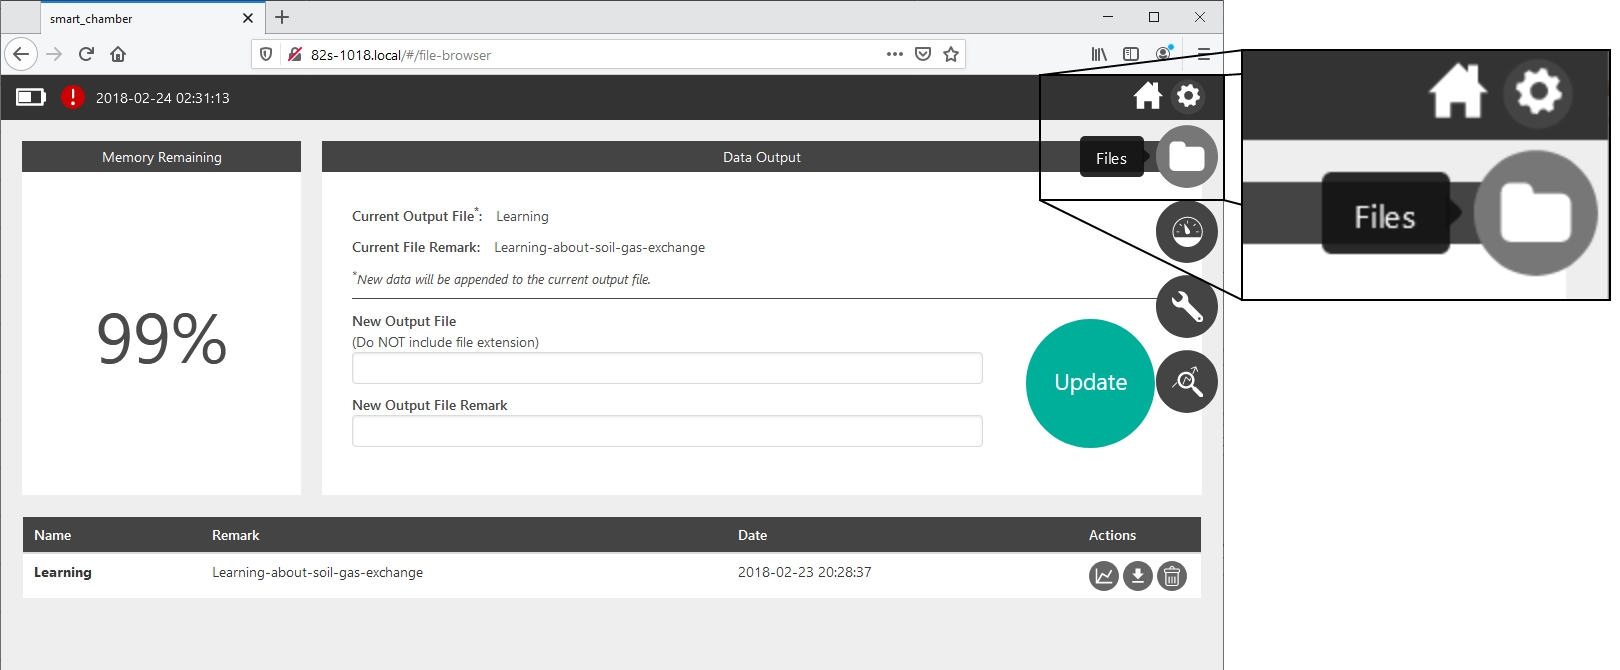
Memory Remaining
This shows the percentage of memory remaining (of 8 GB total) on your Smart Chamber. You will not be able to take more measurements if the memory is full. The Smart Chamber will not overwrite files, and you must delete files manually before preceding.
Data Output
The Data Output displays the Current Output File and Current Output Remark for the file to which you are currently logging data. You must create a new file or open an existing file before you begin logging measurements. The remaining section lists all of the data files currently stored on your Smart Chamber, including the file Name, Remark, and Date the file was created. Under Actions, you can view the details of a file, download the file, or delete it. Click the Update button to create a new data file.
List of data files

The lower portion of the page provides a list of all files that are stored on the Smart Chamber, as well as options to manage the data, including View, Download, and Delete. Viewing is described in Viewing data on the instrument.
The Settings page
As the name suggests, this is the section of the software where you will configure your measurement settings. Note the large Update button. You must press Update after changing any settings. If you make changes and navigate elsewhere in the software without pressing Update, your changes will not be saved.
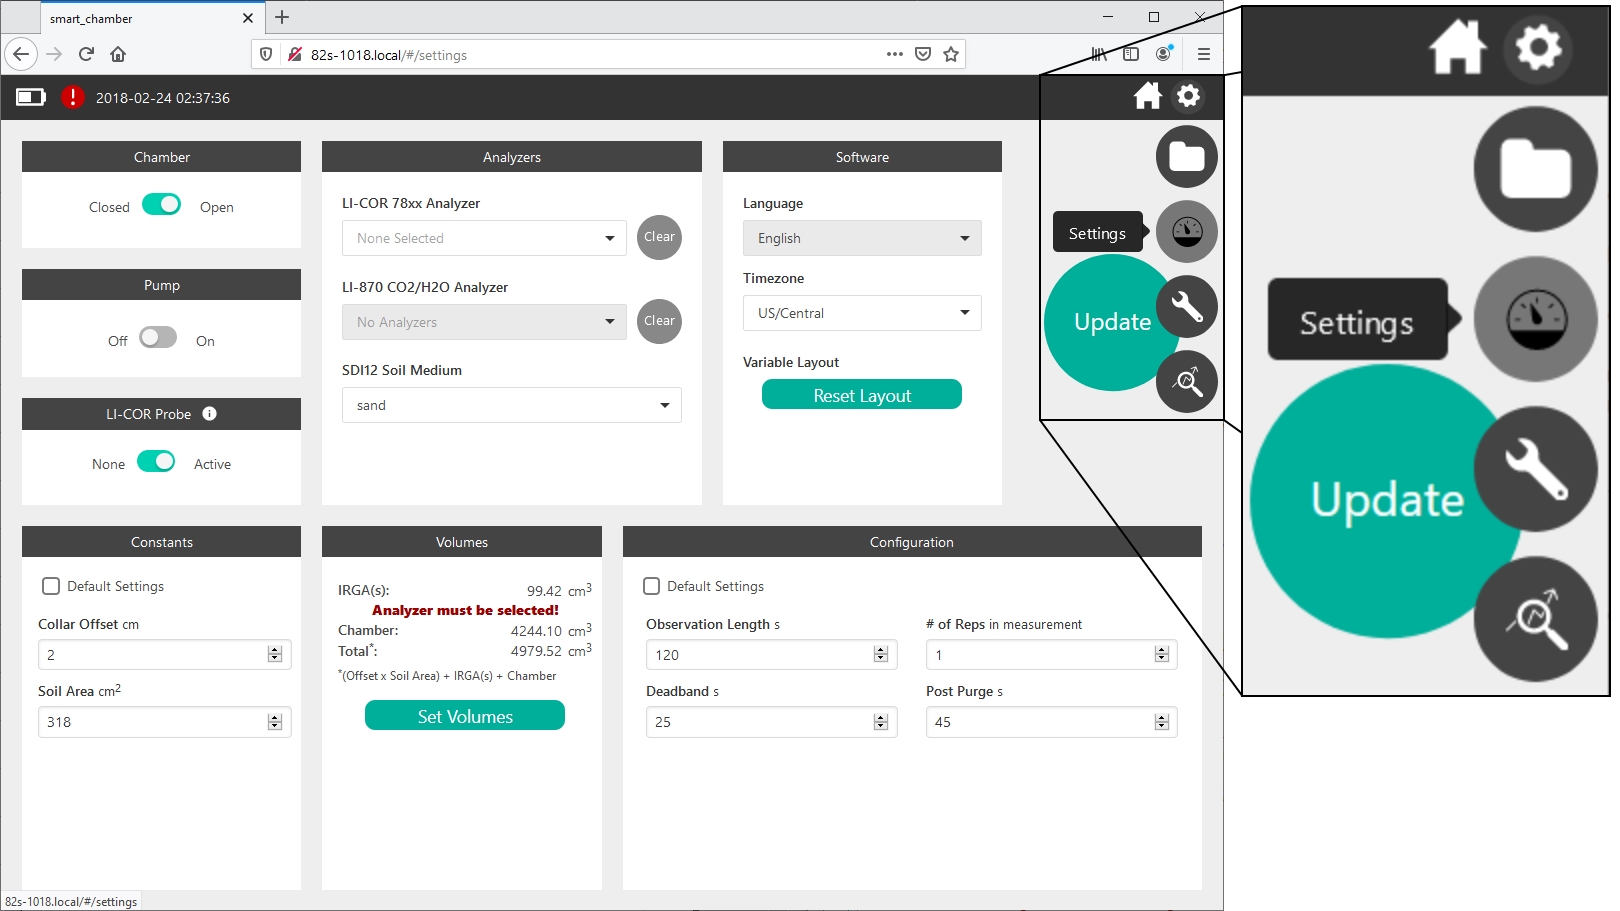
Chamber
The option is to open or close the chamber. Also indicates the current chamber position.
Pump
Turns the circulation pump on or off. During a measurement, the pump will always be set to on and you cannot alter it until the measurement is complete.
Analyzers
To connect to a Trace Gas Analyzer and/or LI-870 gas analyzer. The analyzers will be automatically detected and presented in the list. You may select the Soil Medium for the Stevens HydraProbe with serial numbers lower than 268000. Newer models use a generic calibration and do not require a specific medium.
Software
Specify the time zone where measurements are taken. Under Variable Layout, click Reset Layout to clear the configuration on the Home Page of the software and reset it to the default configuration.
Constants
Constants include the soil Collar Offset (see Measuring the collar offset) and Soil Area inside the collars. Checking Default Settings will automatically fill the Soil Area for standard 20 cm collars from LI-COR (317.8 cm2) and a default Collar Offset value (note that you will always be able to enter a new collar offset value before starting a new measurement).
Volumes
Here you configure the total system volume - an integral component of soil gas flux computations. Click Set Values to customize volumes for the gas analyzer, tubing, and the Smart Chamber bowl. The software will compute a new volume, which it will use for measurements.
Configuration
Lastly, in the Configurations section, you will program the details of your measurement, including the following.
- Observation Length: The amount of time the chamber is closed.
- Number of Repetitions: For replicate measurements on the same collar.
- Deadband: The amount of time the chamber will remain closed before data begins being used for curve fitting.
- Post Purge: The amount of time the circulation pump runs after the chamber begins to open.
The Network page
The Network page is where you set the Smart Chamber IP address and configure Wi-Fi settings.
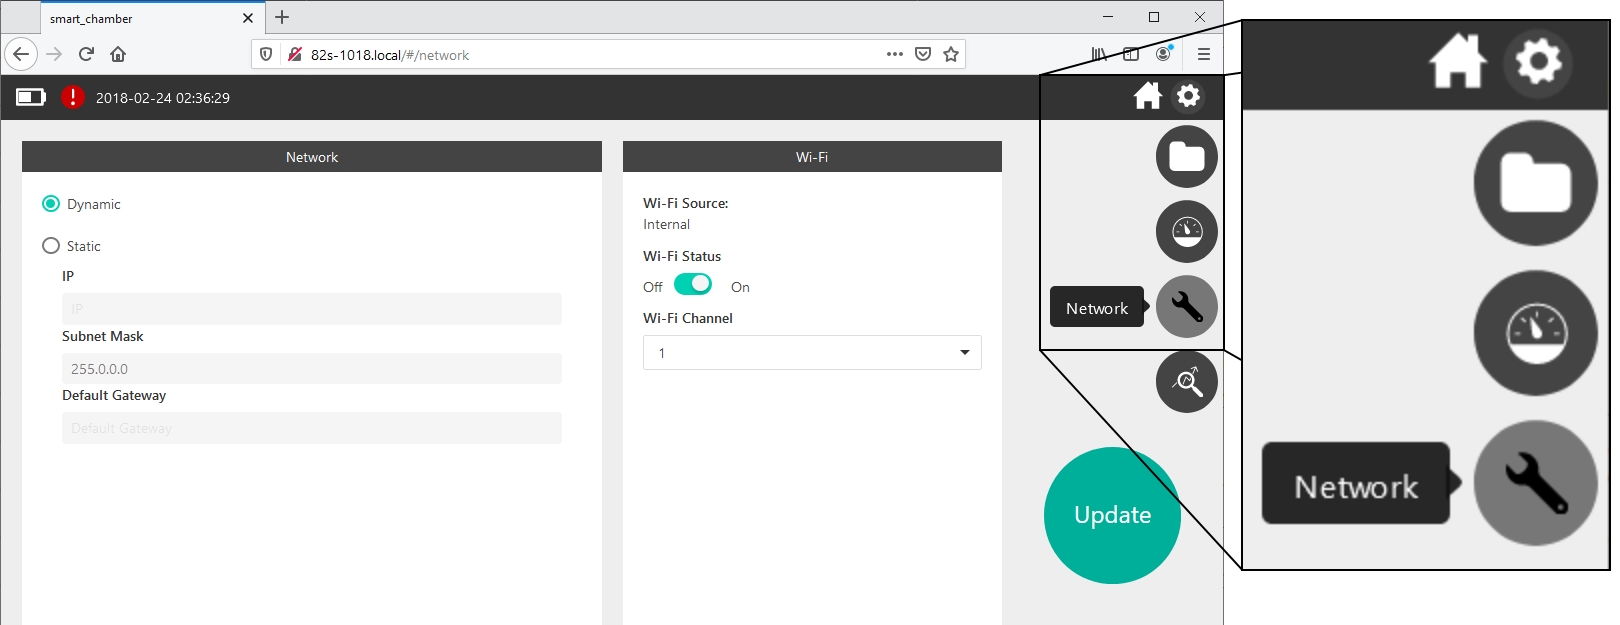
Network settings
The Network settings section allows you to configure the chamber network settings.
A Dynamic IP address requires no additional configuration and is suitable for most networks, but will change when you connect or disconnect your Smart Chamber to your network. When selected, the network assigns an IP address to the instrument.
A Static IP address gives the Smart Chamber a fixed IP address. It requires that your network administrator set aside an address (or, more likely, a range of addresses). If selected, the IP remains constant. You manage the networking manually by setting the IP address, subnet mask, and possibly the gateway.
- IP: If setting a static IP address, enter the desired IP address. For a local network, you'll use something like 172.24.1.nn, where the values represented by nn are octets that uniquely identify this instrument on the network.
- Subnet Mask: Typically 255.255.255.0
- Default Gateway: Set the first two octets to match those of the IP address.
Wi-Fi
Here you configure the Wi-Fi status.
- Wi-Fi Source: Internal, from the internal Wi-Fi capabilities, or External for an external USB adapter
- Wi-Fi Status: Off or On. Click to change the status.
- Wi-Fi Channel: Specifies which is used for Wi-Fi. Change the channel if the connection is unstable (see ).
The Diagnostics page
The Diagnostics page consists of four read-only sections that display the details of your instrument, software version, and other information.
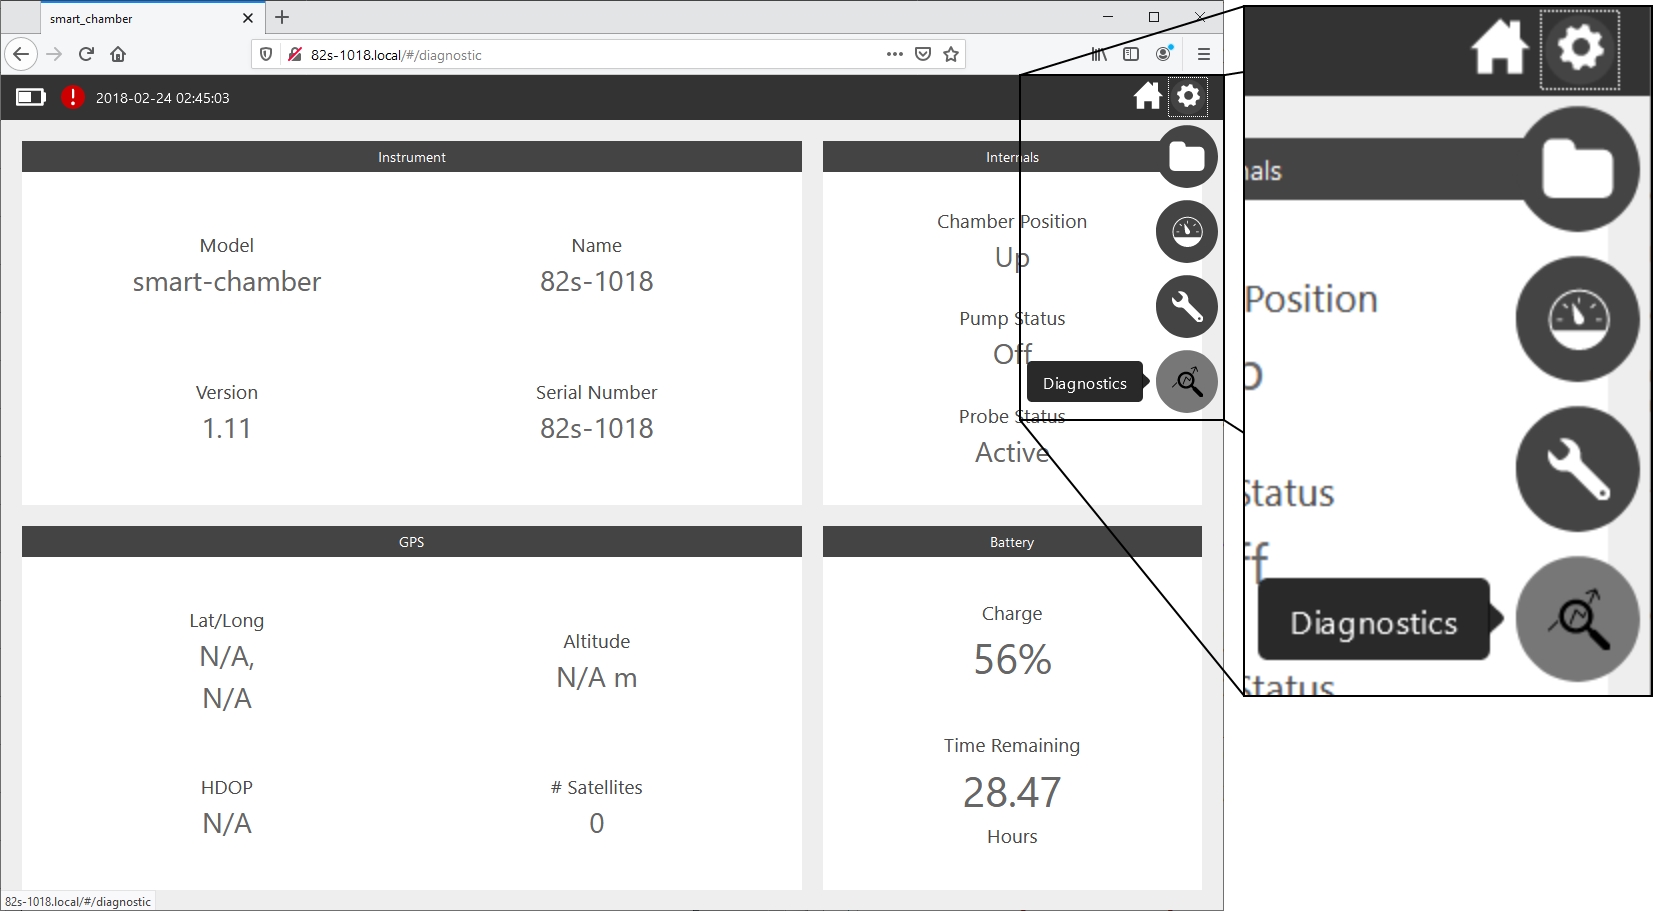
Instrument
The Instrument section provides details including the Model, Name of the Smart Chamber (which, incidentally, is also the serial number and Host Name), and software Version, and Serial Number.
Internals
The Internals section displays Chamber Position (up or down) and Pump Status (on or off).
GPS
The GPS section provides diagnostic information for your GPS connection. The Lat/Long data can be useful for locating your collars and is also saved to your measurement files. HDOP is the horizontal dilution of GPS precision attributed relative satellite-receiver geometry, and is closely related to the number of satellites. The GPS receiver needs data from at least 4 satellites to determine latitude, longitude, and altitude. If you are not connected to at least 4 satellites, you may have no data at all, or the data you have may not be reliable.
Battery
The Battery section displays the current Charge level of your battery and the estimated number of hours remaining. This estimation is based on the current state of your instrument. In other words, if your instrument is idle, the estimate will reflect how many hours your Smart Chamber would continue to run in an idle state.