
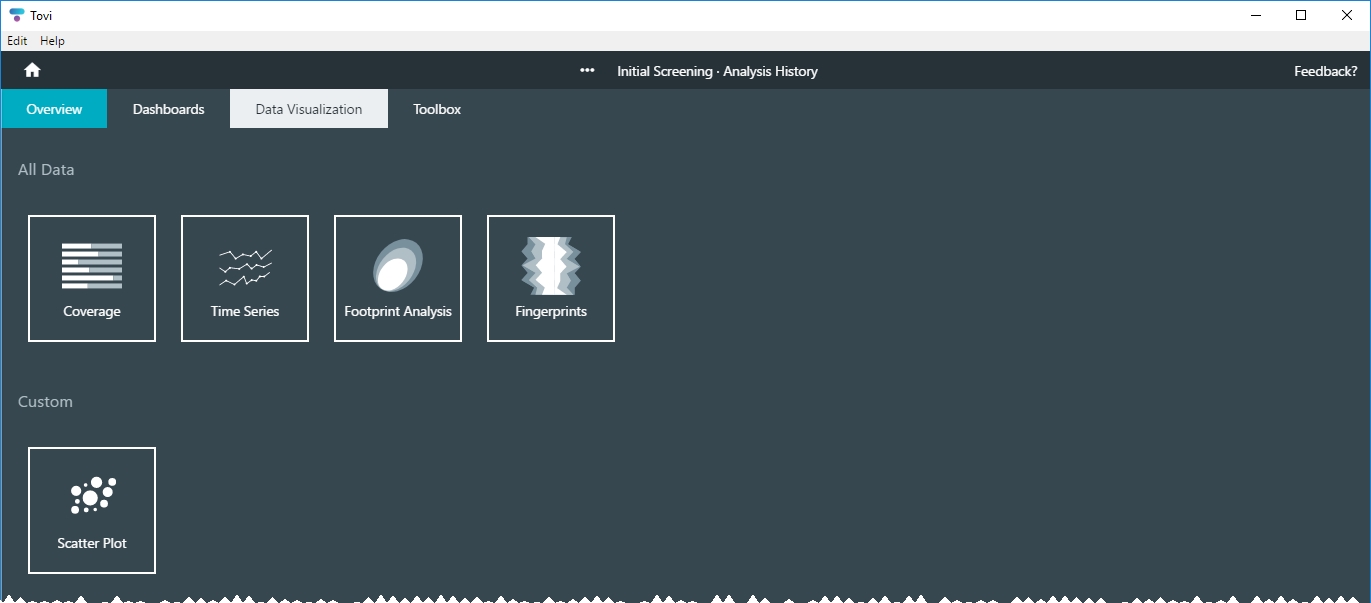
The visualization tools provide a simple way to review certain aspects of the dataset. Visualization tools do not modify or duplicate the data set. They serve to help you gain a better understanding of the data and to inform your decisions about processing the data. When you click Data Visualization, you'll see options that include Coverage, Time Series, Footprint Analysis, Fingerprints, and Scatter Plot.
Coverage

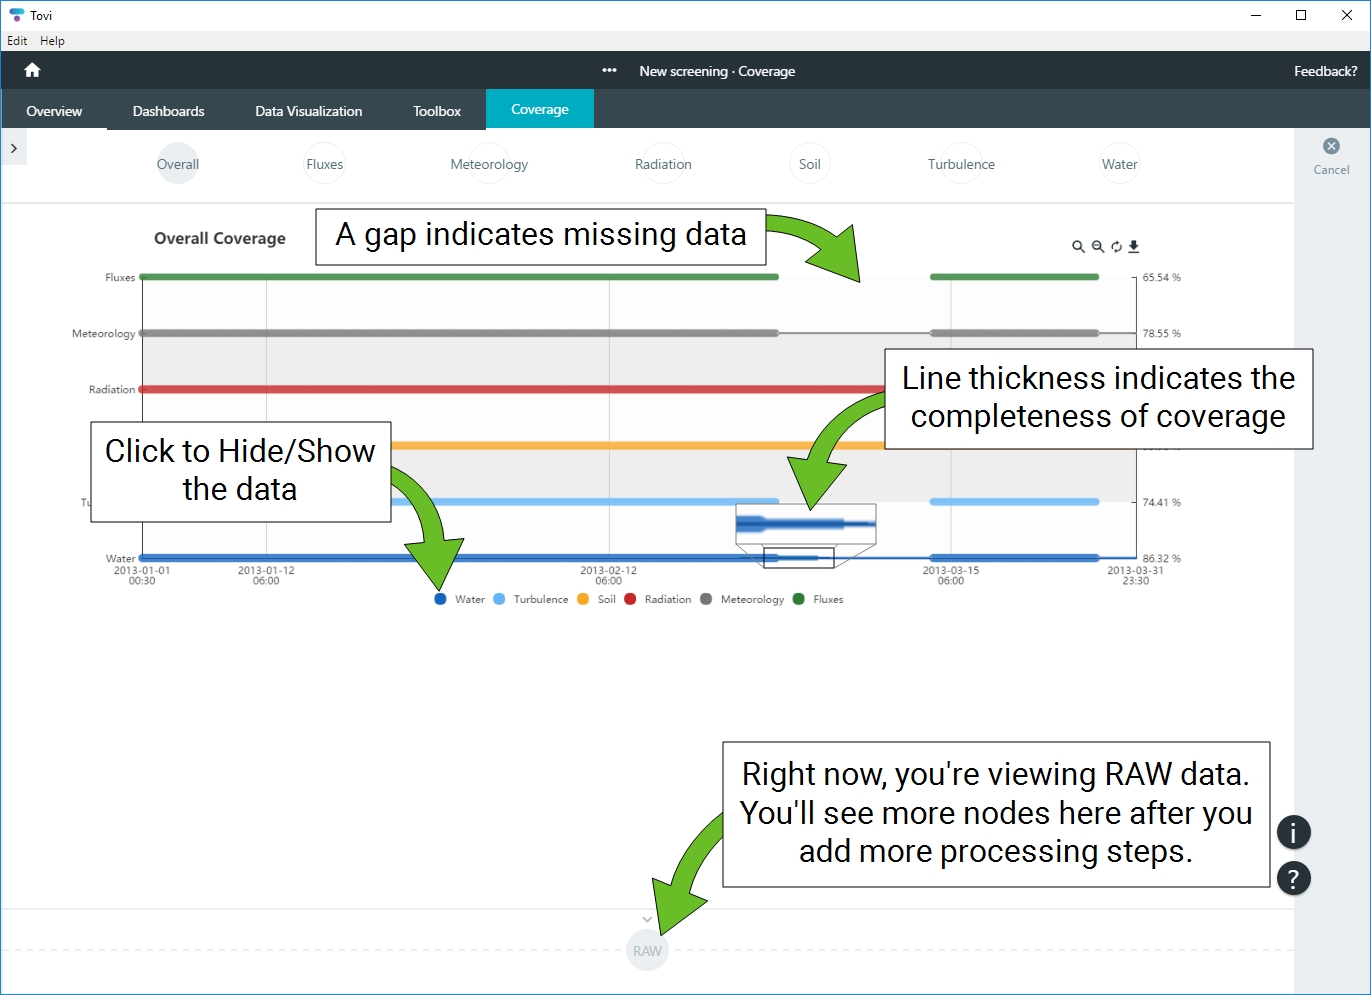
The Coverage chart is a quick way to evaluate the continuity and completeness of your dataset. It shows gaps and incomplete data in the time series.
- Select one of the groups to view coverages contained within.
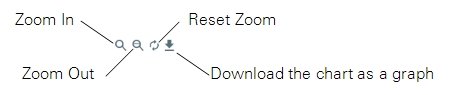
- You can zoom in, zoom out, reset zoom, or save an image of the coverage chart to your computer.
When Overall is selected, you'll see summary coverages of Fluxes, Meteorology, Radiation, Soil, Turbulence, and Water. You can select any of the aforementioned coverages for more details. The completeness of coverage is indicated by the line thickness. Partial coverage is indicated by a thin line; complete coverage is indicated by a thick line.
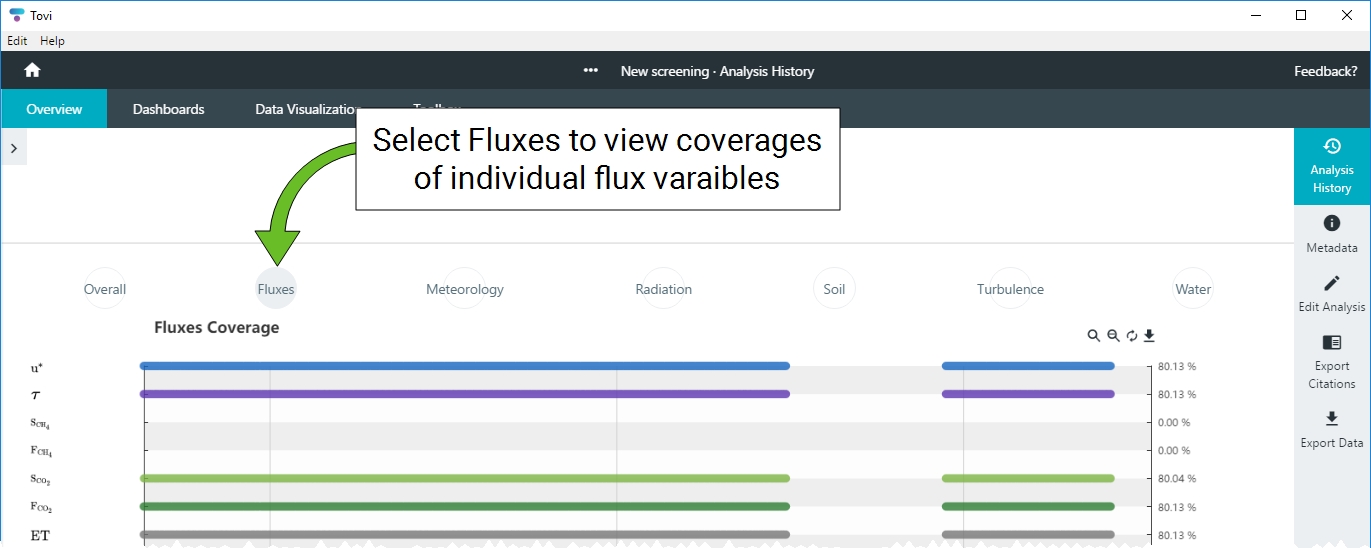
Select Fluxes to see the coverage of individual flux variables.
Time series
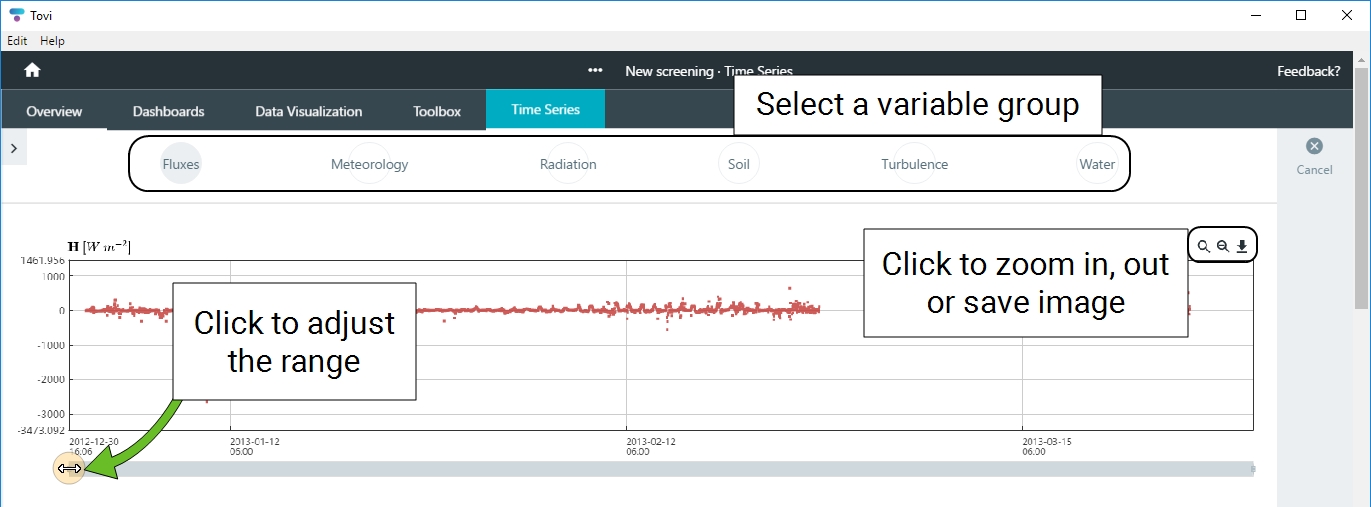
The Time Series displays the data in groups. Contents of each group depend on the contents of the data files. The purpose of this view is to let you examine charts of data in the time series. You can zoom in, zoom out, and download an image of a chart.
Zooming in and out: The zoom in and zoom out buttons allow you to select a section of data to zoom in to, or to reset the zoom to the full scale.
Adjusting the scale: Tovi displays scroll bars below the chart, but the scroll bars will be inactive when the chart is zoomed to full scale. Click the end of the scroll bar to rescale the chart.
Click Cancel when you are done examining the charts.
You can select different variables groups (Fluxes, Meteorology, etc.) to view data for variables within the dataset. In addition, you can scroll down to see more variables, and save the chart as an image file.
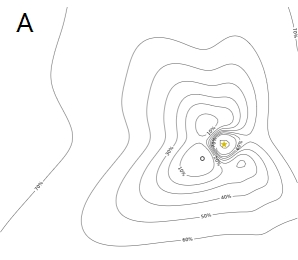
Footprint climatology
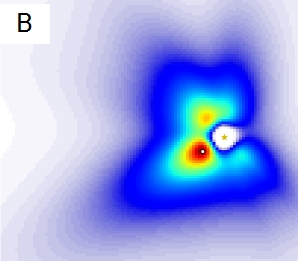
The Footprint Climatology tool enables you to visualize the relative contributions of each point in space to the computed fluxes in the geographic area surrounding the eddy covariance station.
Note: You can select alternative satellite imagery. Tovi (starting with version 2.7) can use imagery from three sources: MapBox, ESRI, or Bing Maps. If there are issues with the MapBox imagery provided by default , you can select an alternative image provider by going to the Site Timeline (the first level of the project) and clicking Change Satellite Provider.
Before you can visualize the footprint, Tovi needs to process the footprint data and create footprint analysis (FPA) data files. Go to Toolbox > Footprint Analysis and complete the footprint calculations, as described in Footprint analysis. When that is done, you can return to view the footprint.
To view the footprint data, select an aggregation (e.g., Year by Year) and a subaggregation (e.g., a year). Select a division (e.g., by Calendar Season, by Month, or Yearly) and a subdivision (e.g., a season, a month, or year). And finally, select a plot type (All, Stable, Neutral, Unstable, Day, and Night). You can view maps and plots.
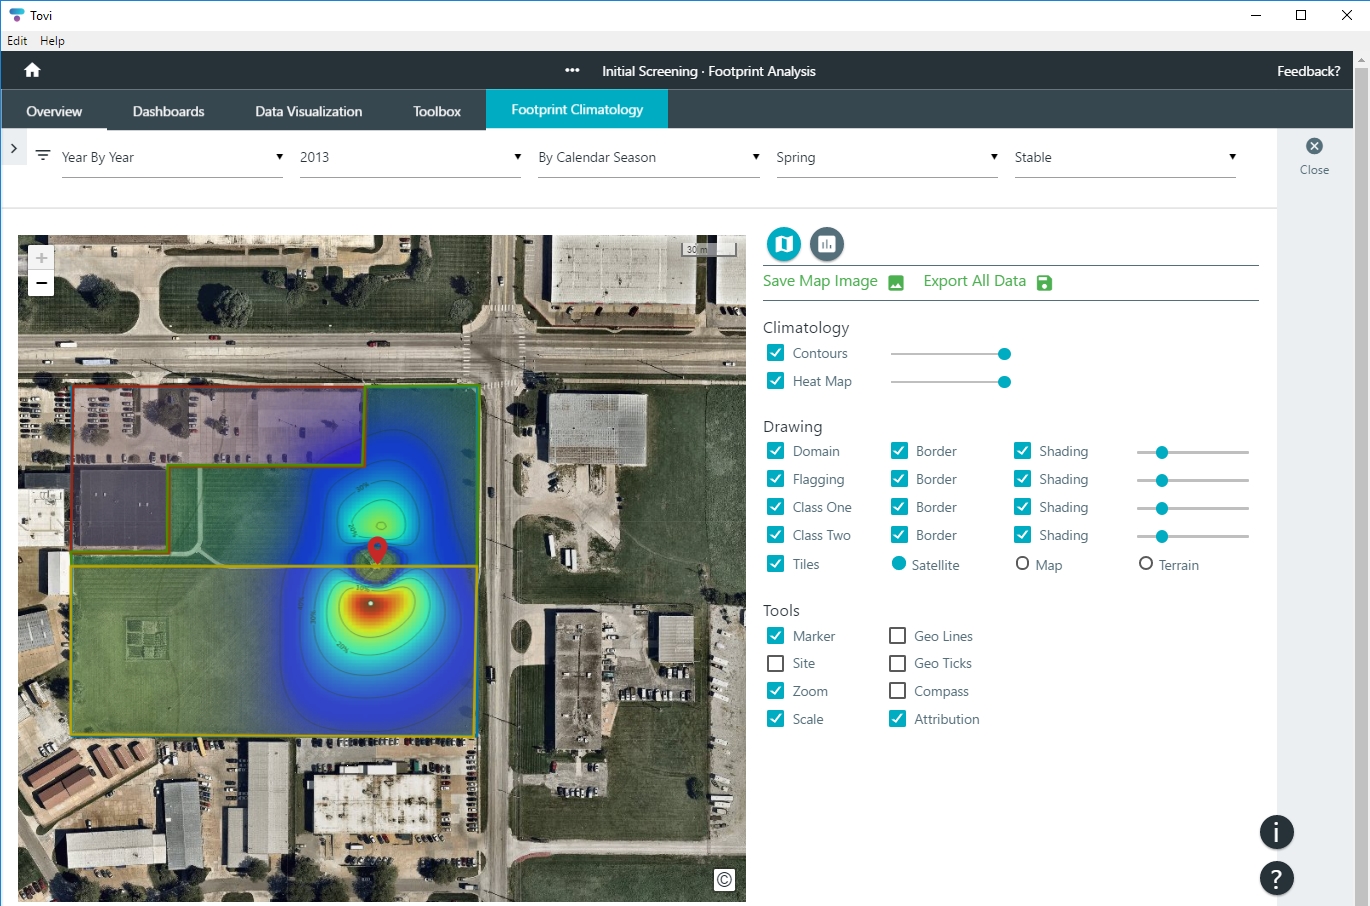
The Climatology section allows you to control the display of footprint contour lines and heat map. Adjust the sliders to change the transparency of these layers on the map. Under the Drawing section, you can alter the display settings of the Domain, Flagging region, Classes, and the map settings (Tiles). And, under Tools, you can change other map settings.
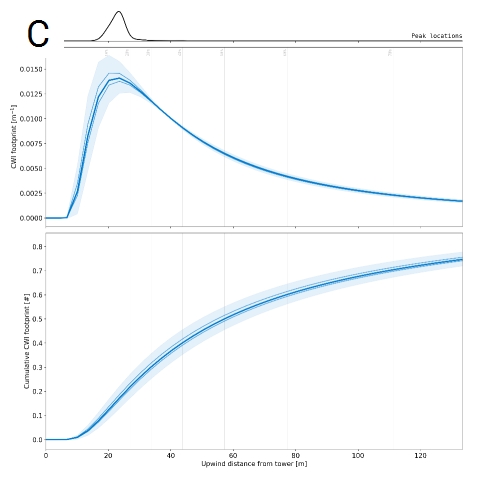
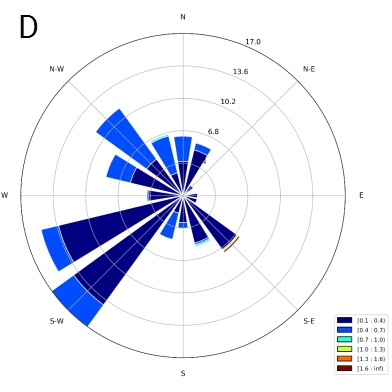
When viewing plots, you can export the cross-wind integrated (Save CWI) charts and a windrose (Save Windrose). When viewing the map, you can export an image of the footprint or all images at once. Save Map Image exports the current image as a .png image file. Export All Data saves the full data as .csv files and the images as .png and .svg images. When you select this option, Tovi will produce the following:
- Data: You'll find folders for All, Neutral, Day, Night, Stable, and Unstable with .csv files in each folder.
- Plots: You'll find images of the contours, heat maps, wind roses, and cross-wind integrated (1D) footprints.
Fingerprints
The fingerprint shows daily data in stacked rows—one row for each day—with data values shown with a color gradient. You can adjust the range with the sliders, add more fingerprints, and zoom in and out to examine the fingerprints. If you Lock Zoom, all fingerprints will zoom in together when you use the zoom tool. One or more missing horizontal rows indicates a gap for a time period. A single missing dot represents the data period (possibly 30 minutes, depending on the time step used in your data set). A vertical gap indicates missing data at the same time each day.
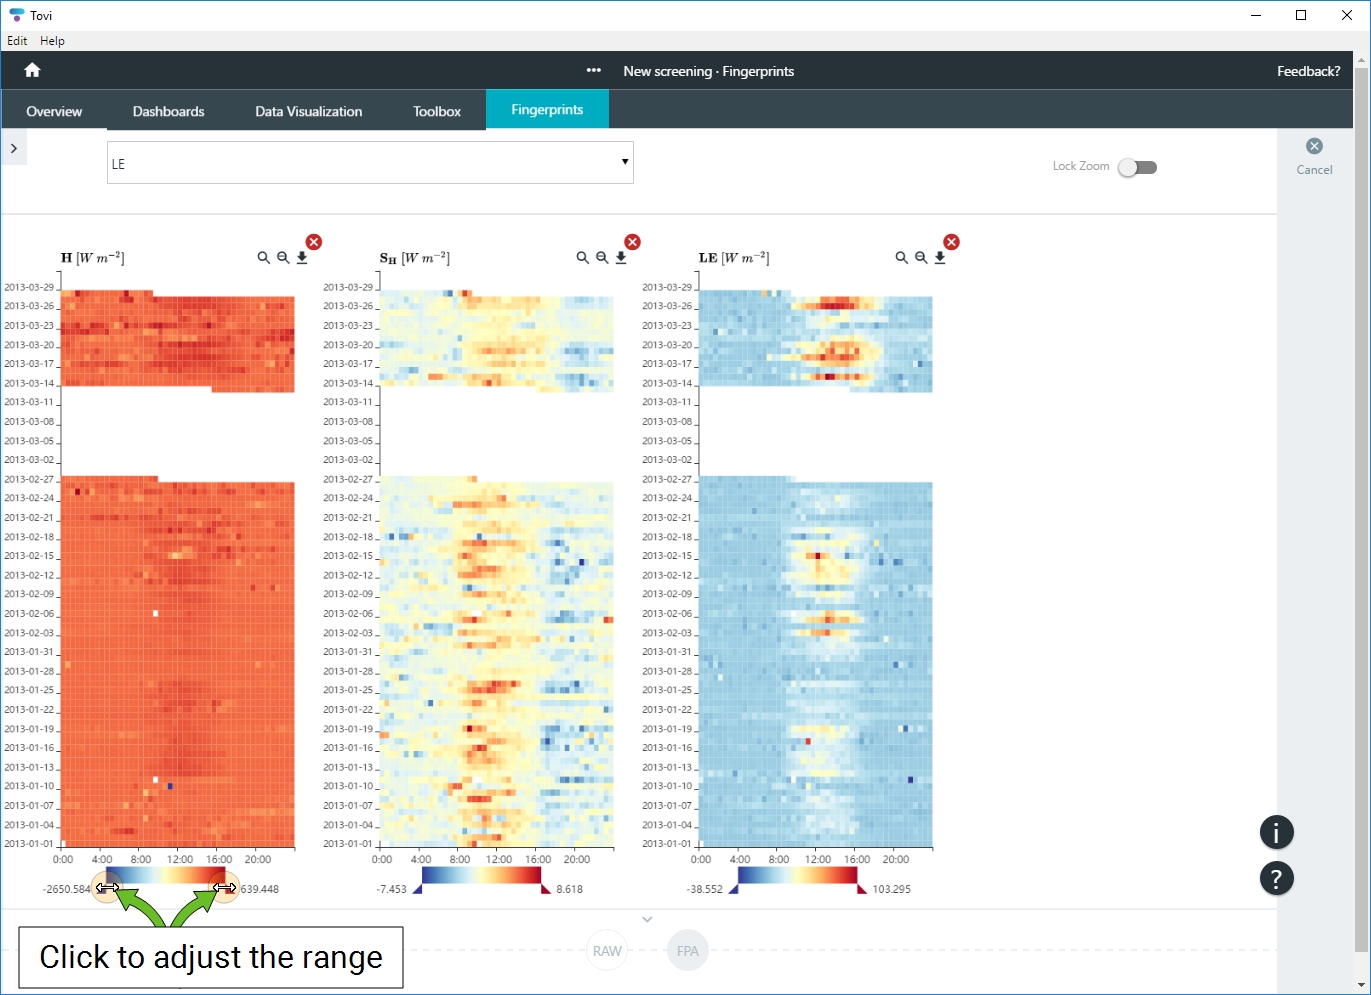
Click Cancel when you are done examining the fingerprints.
Scatter plots
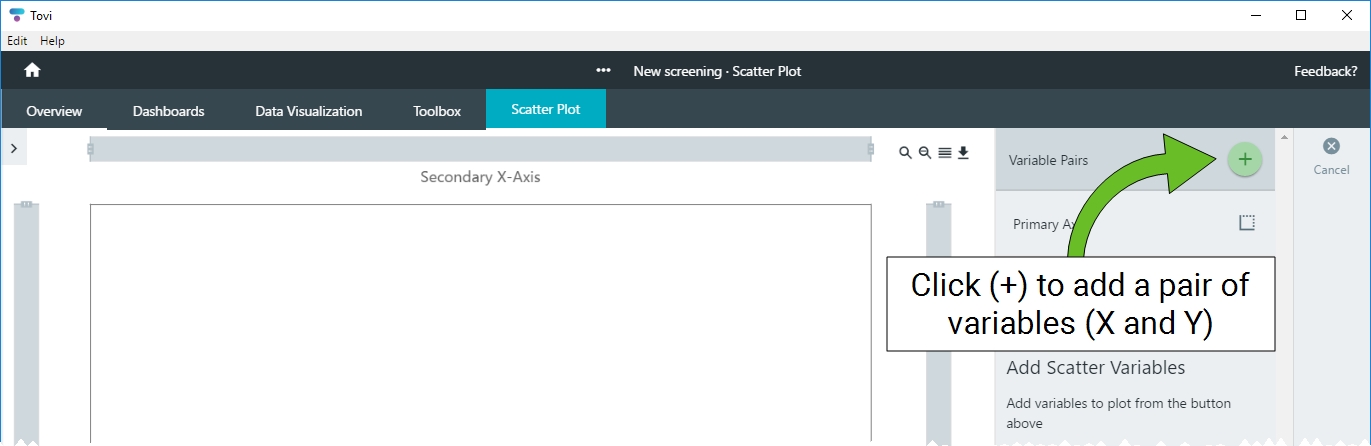
This tool is used to create scatter plots of variables in your dataset. You can plot up to four pairs of variables.
- Add variables to begin. Click [+] next to variable pairs.
- Set the axis labels (optional).
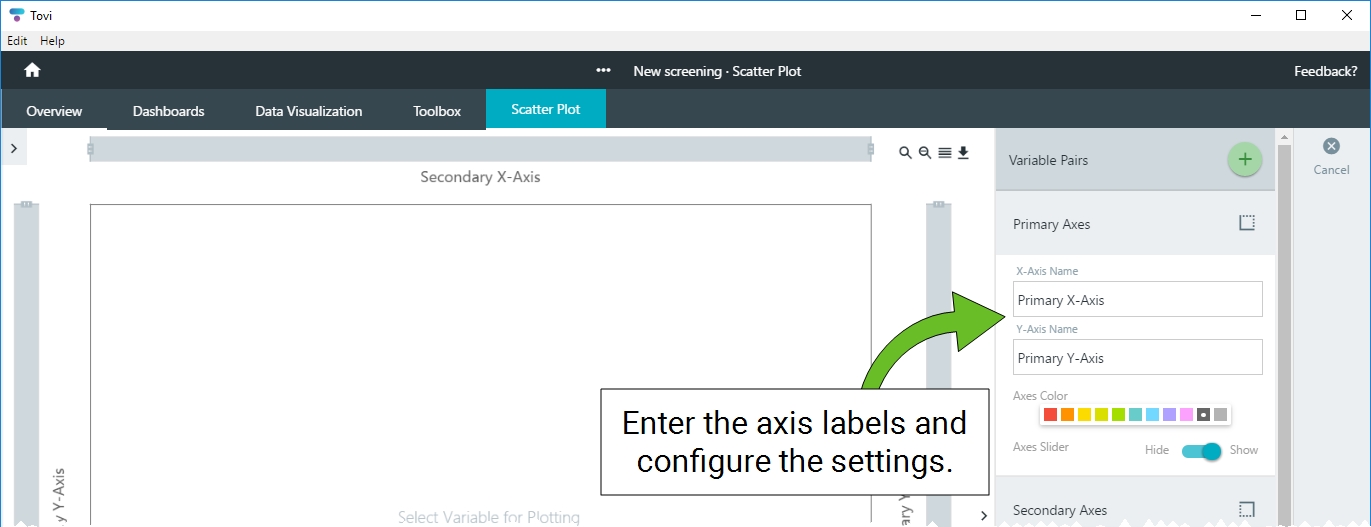
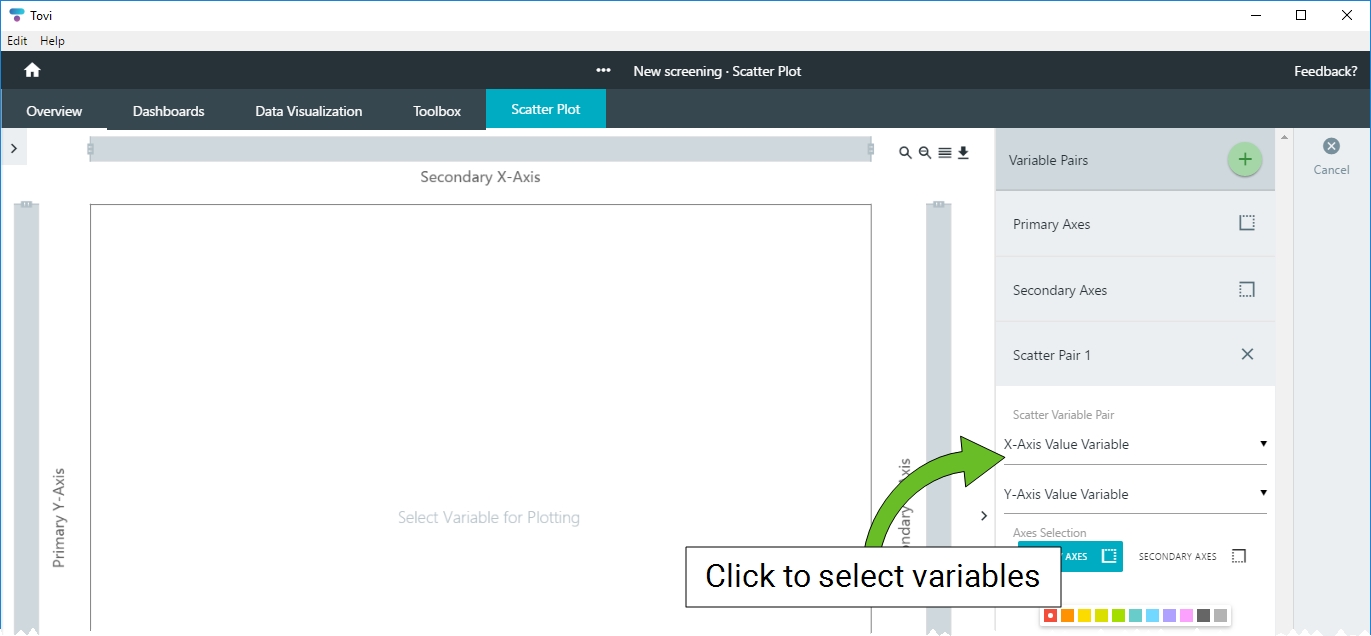
- Add variables to the X-axis and the Y-axis
- Change the display settings as desired.
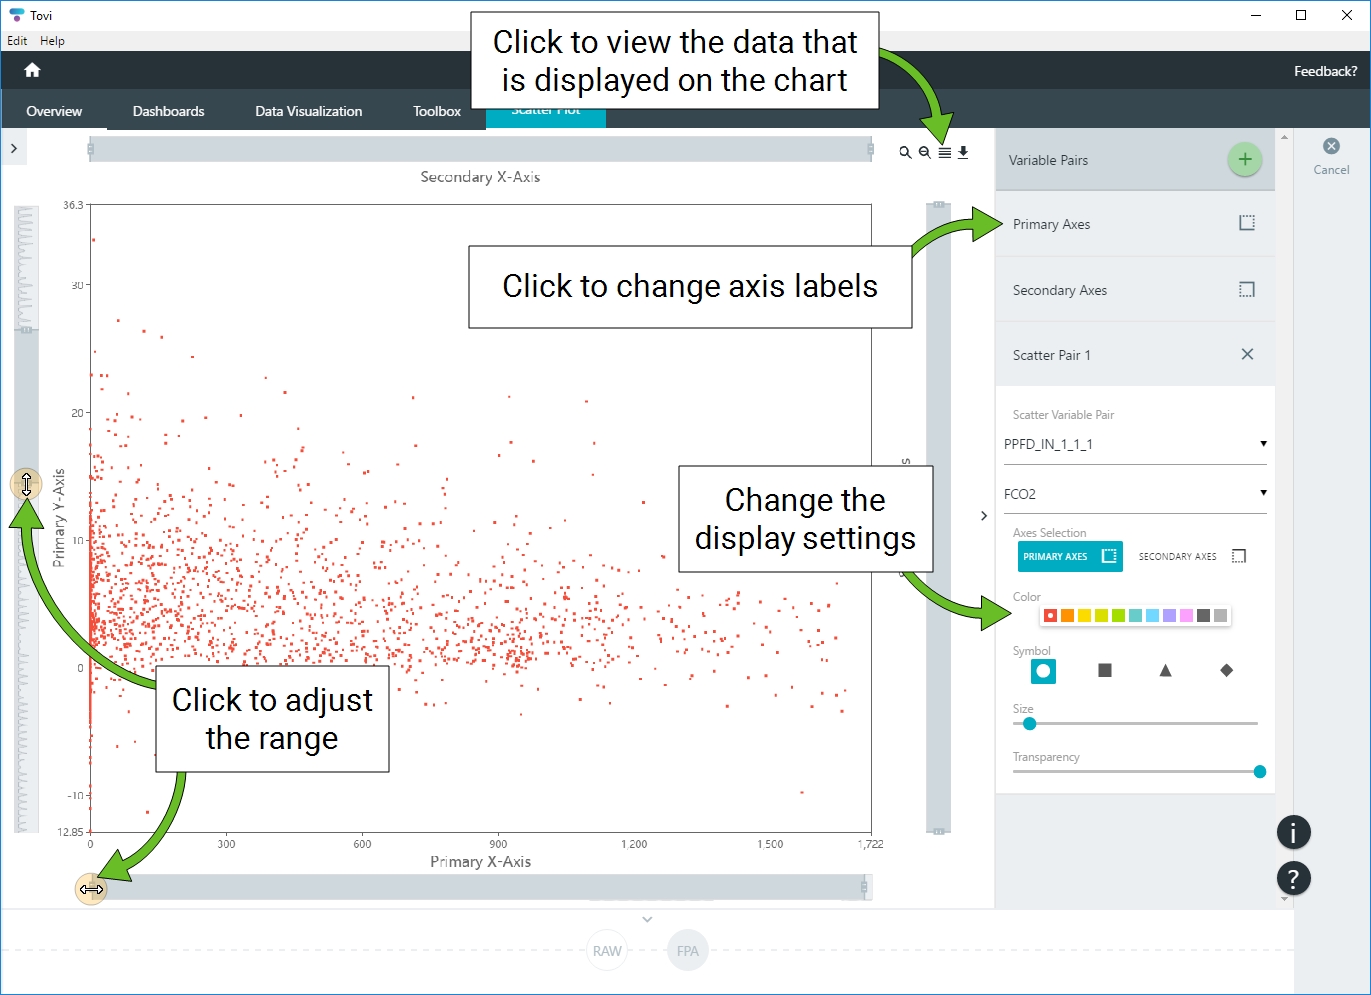
- You can add up to four additional pairs.
Click Done when you are done examining the data.