Dashboards and data visualization
Note: RXW-WL water level channel update. If you are using HOBOnet Water Level sensors (RXW-WL), a recent update separates the raw sensor measurement (Sensor Depth) from the calculated Water Level channel. After this update, dashboard widgets that reference the previous channel may display only historical data. To display the full record, edit the widget and add the updated channel. For more details, see Updating dashboards and exports after the RXW-WL channel update.
Select Dashboards to view them.
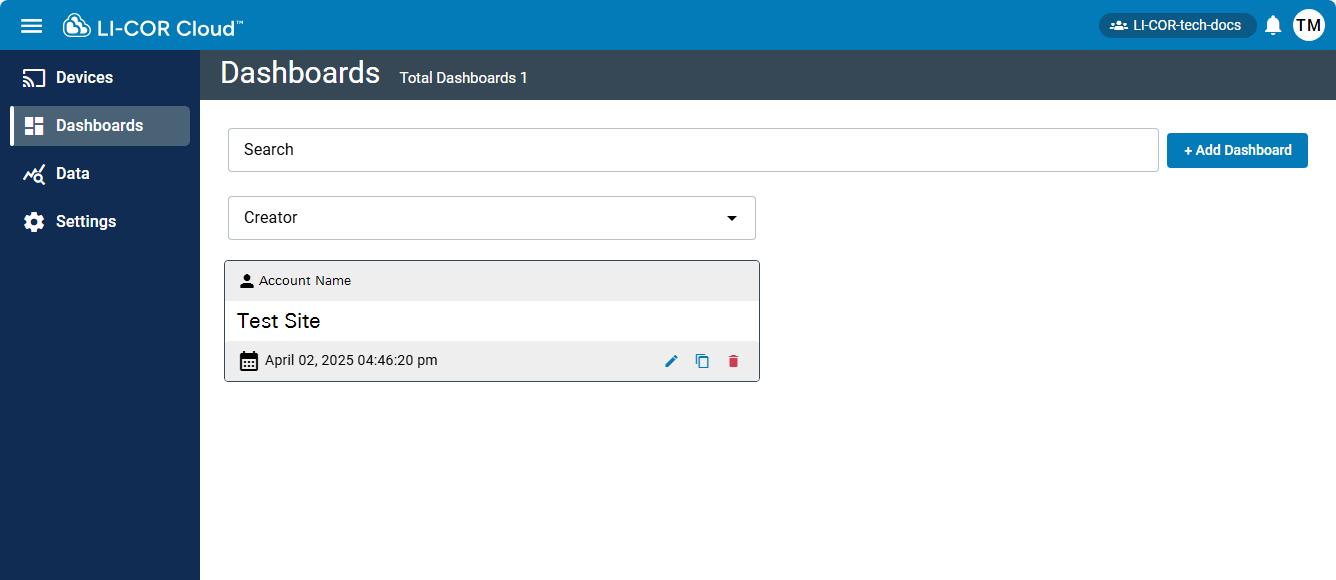
Each Dashboard is represented by a single Tile that displays the following information:
-
 Owner: LI-COR Cloud account holder who created or is responsible for the device.
 -
Dashboard Name: The name entered for the dashboard.
-
 Date and time: When the dashboard was created or last updated.
-
 Edit: Allows you to change the dashboard properties.
 -
 Duplicate: To duplicate an existing dashboard. You can then open the copy and make changes to it.
 -
 Delete: To delete the dashboard.
-
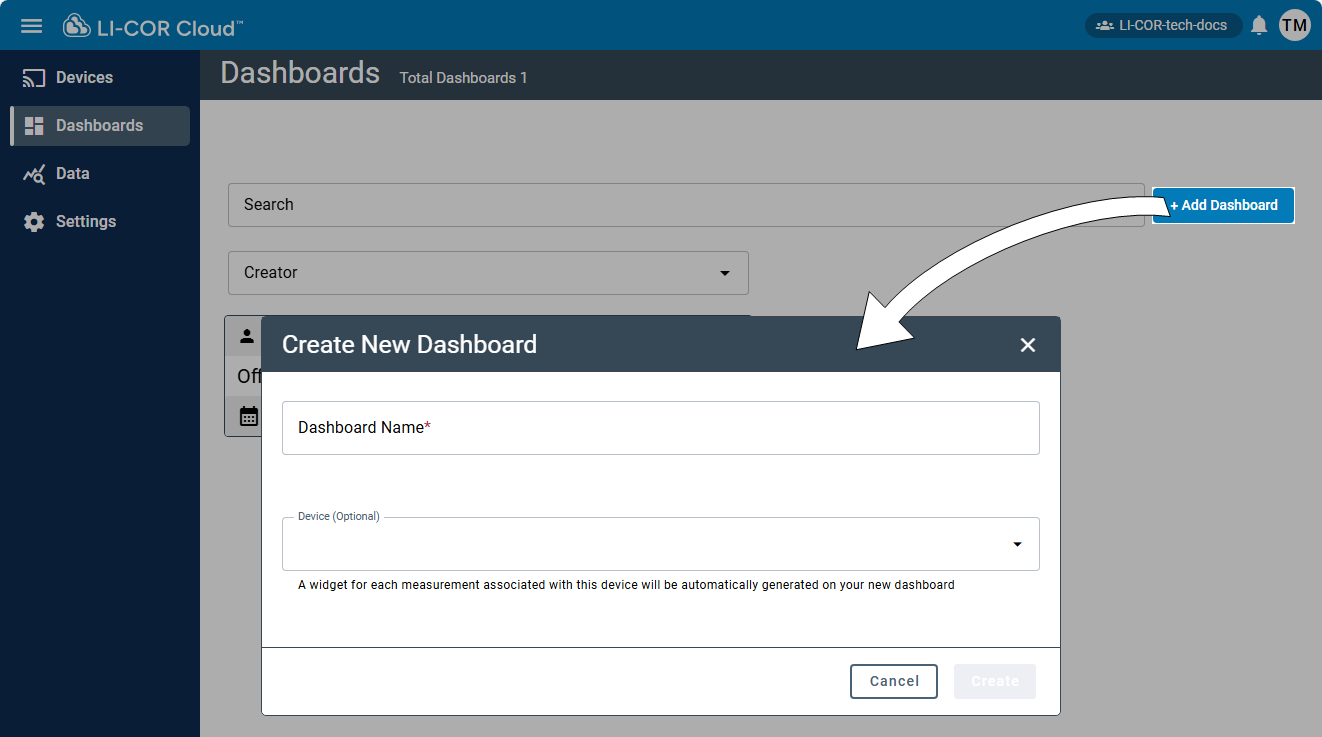
Creating dashboards
-
Select Dashboards and click +Add Dashboard.
-
Enter a Dashboard Name.
The name must be unique.
-
Select a Device Template.
LI-COR Cloud will list options for the widget for each measurement associated with this device.
-
Click Create.
LI-COR Cloud displays the new Dashboard along with some pre-configured widgets. Next, you can customize the Widgets or add others to the dashboard. If you have just powered everything on, there will not be much data to display so you may see an empty graph, but that will change as data accumulate. By default, the interface displays the last 1 day, but you can load a longer time span.
Daily accumulation and gap filling
Dashboards can provide access to gap filled data and daily accumulations of CO2 and water (evapotranspiration).
-
For the Water Node (LI-710), see Working with Water Node data.
-
For the Carbon Node (LI-720), see Working with Carbon Node data.
Viewing live data
You can display live data from a site using the Live Update setting. This is a dashboard option available under the Date Range settings.
Live update must be enabled to use the feature. The frequency of updates is configurable from once per second to once per year. Fractional values are not supported; to update every 1/2 hour, set the number to 30 and units to Minutes.
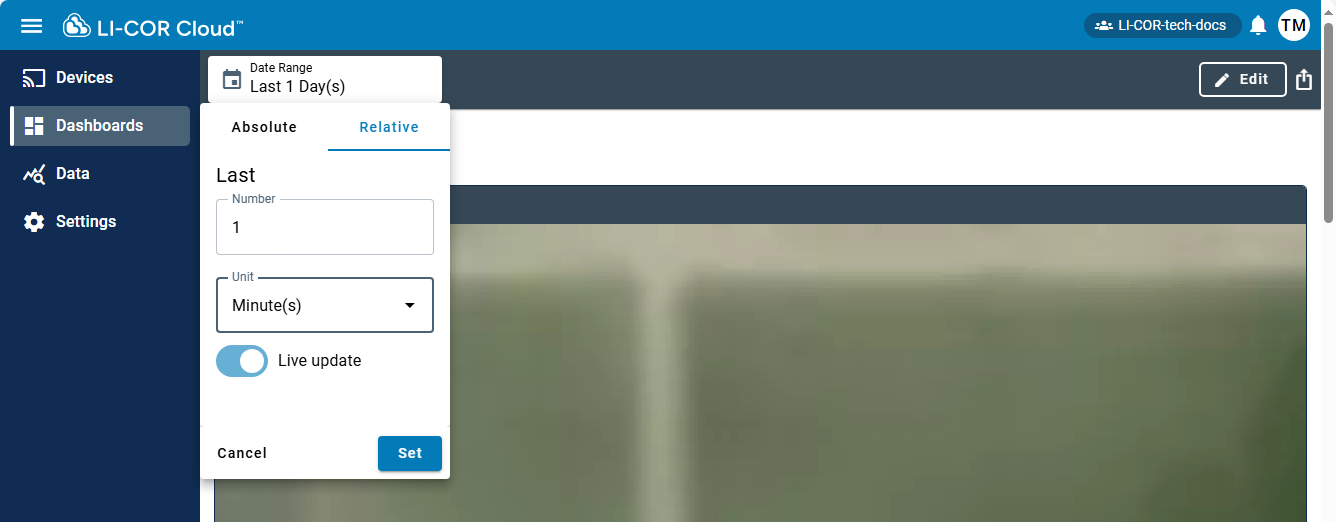
Click Set to apply the setting. The dashboard will update at the specified intervals, indicated by the encircled green dot.
Adding widgets
Widgets display data or other information from sensors. To add a widget, start by adding a new Dashboard. Or select an existing Dashboard to add widgets to it.
Widgets can be selected and configured individually, or you can select a device under Quick Widgets to apply a pre-configured set of widgets that are common to a device. You can duplicate, edit, and delete widgets. You can add as many widgets as you want to the dashboard.
The options available depend on the widget selected.
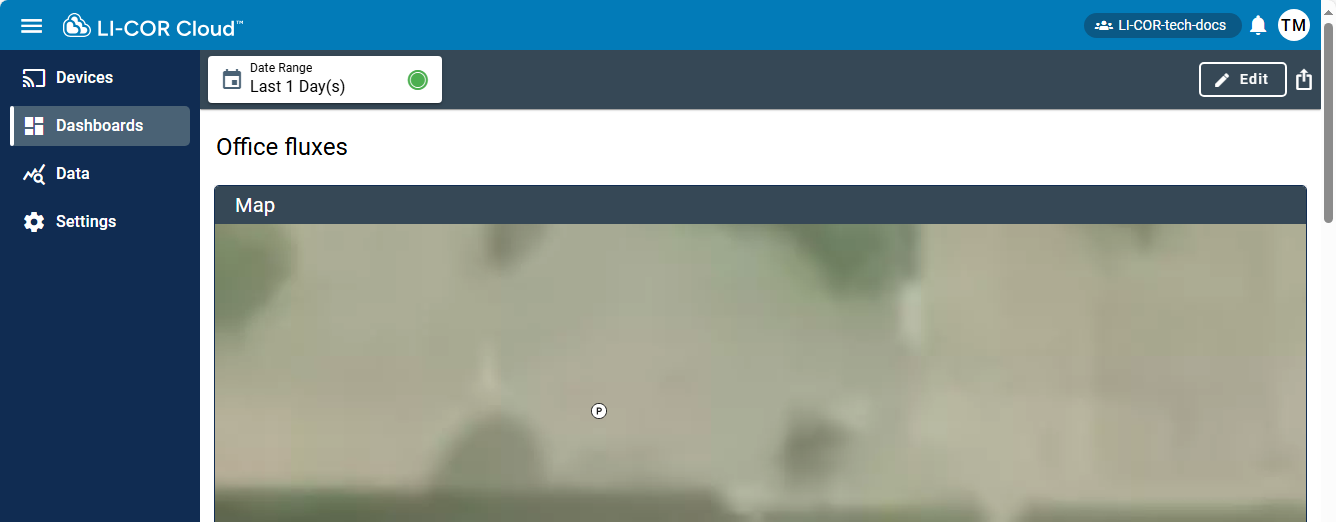
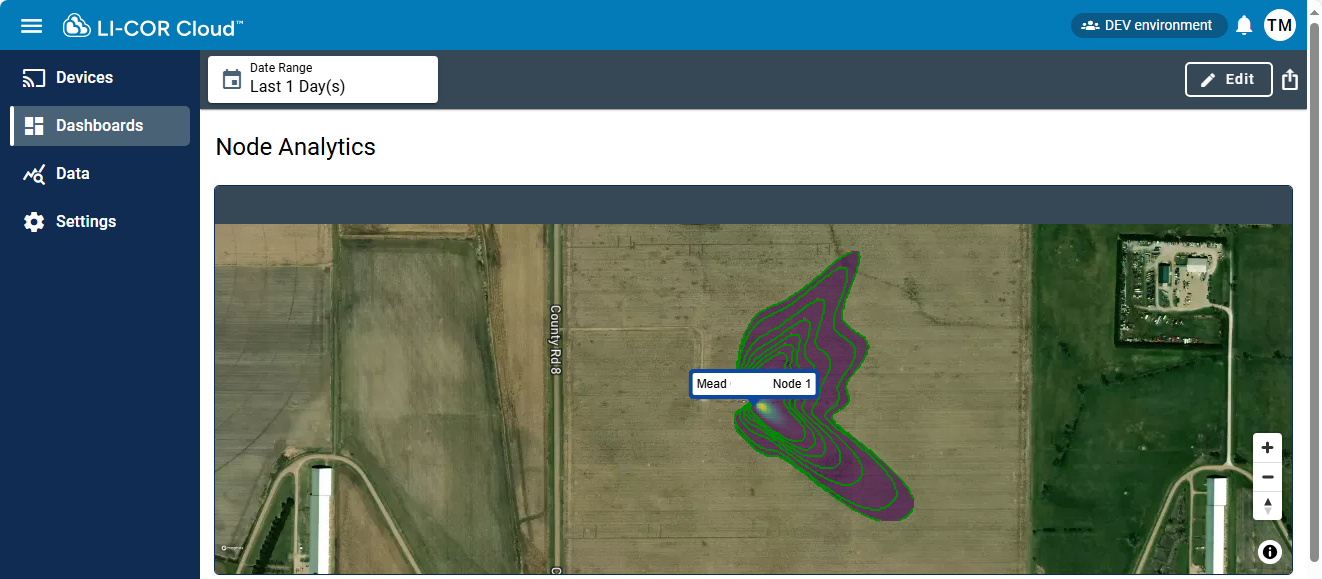
Map widgets
The map widget provides geographical context for a measurement.
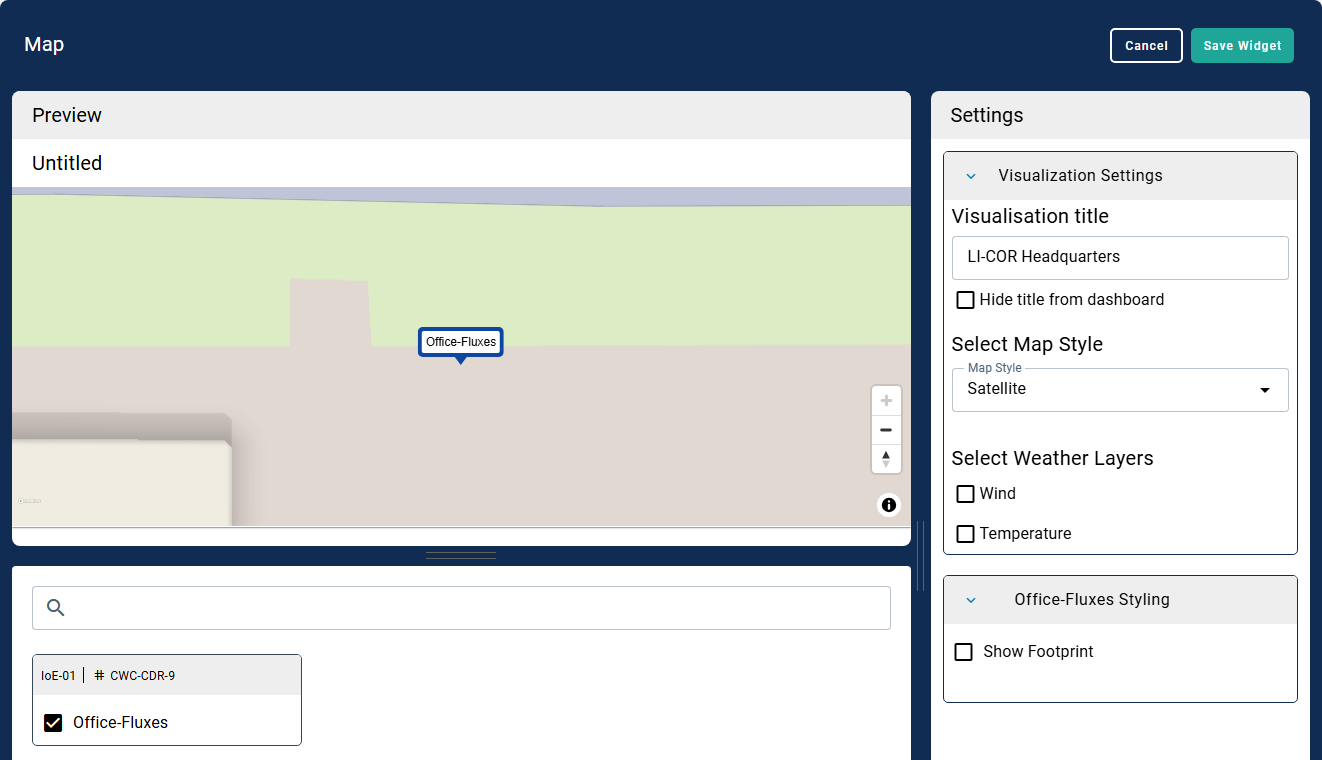
Select a station that contributes data, and then apply settings. Map style includes a road map, topographic map, or satellite imagery. You can display supplemental meteorological data on the map, including real-time wind speed and temperature data.
Footprint visualization
When the flux footprint from a Carbon Node (LI-720) or Water Node (LI-710) is selected, it is displayed on the map widget.
The footprint is part of a Map widget. After applying the settings, the map and footprint are displayed on the dashboard.
Line, bar, and area chart widgets
Three chart options include Line, Bar, and Area. These three chart widgets have similar options.
-
Visualization title: Title to be displayed (can be hidden from dashboard).
-
Axis position: Left, right, or hidden.
-
Axis label: Text to be displayed on the axis.
-
Data aggregation: Data points are averaged at set intervals for better display performance. Automatic adjusts based on current date range. Manual uses a custom interval. If set interval ≤ logging interval, observed data is displayed.
-
Always show zero on Y-axis: Selecting this option will ensure that the Y-axis always shows zero, rather than starting at the minimum value of the data being displayed.
-
Show gridlines: To display or hide the grid on the chart.
-
Smart Y: Adjusts Y-axes to exclude outliers in the dataset and make trends easier to visualize. The Smart Y-axis range is calculated as the median of the visible data ±10 times the interquartile range.
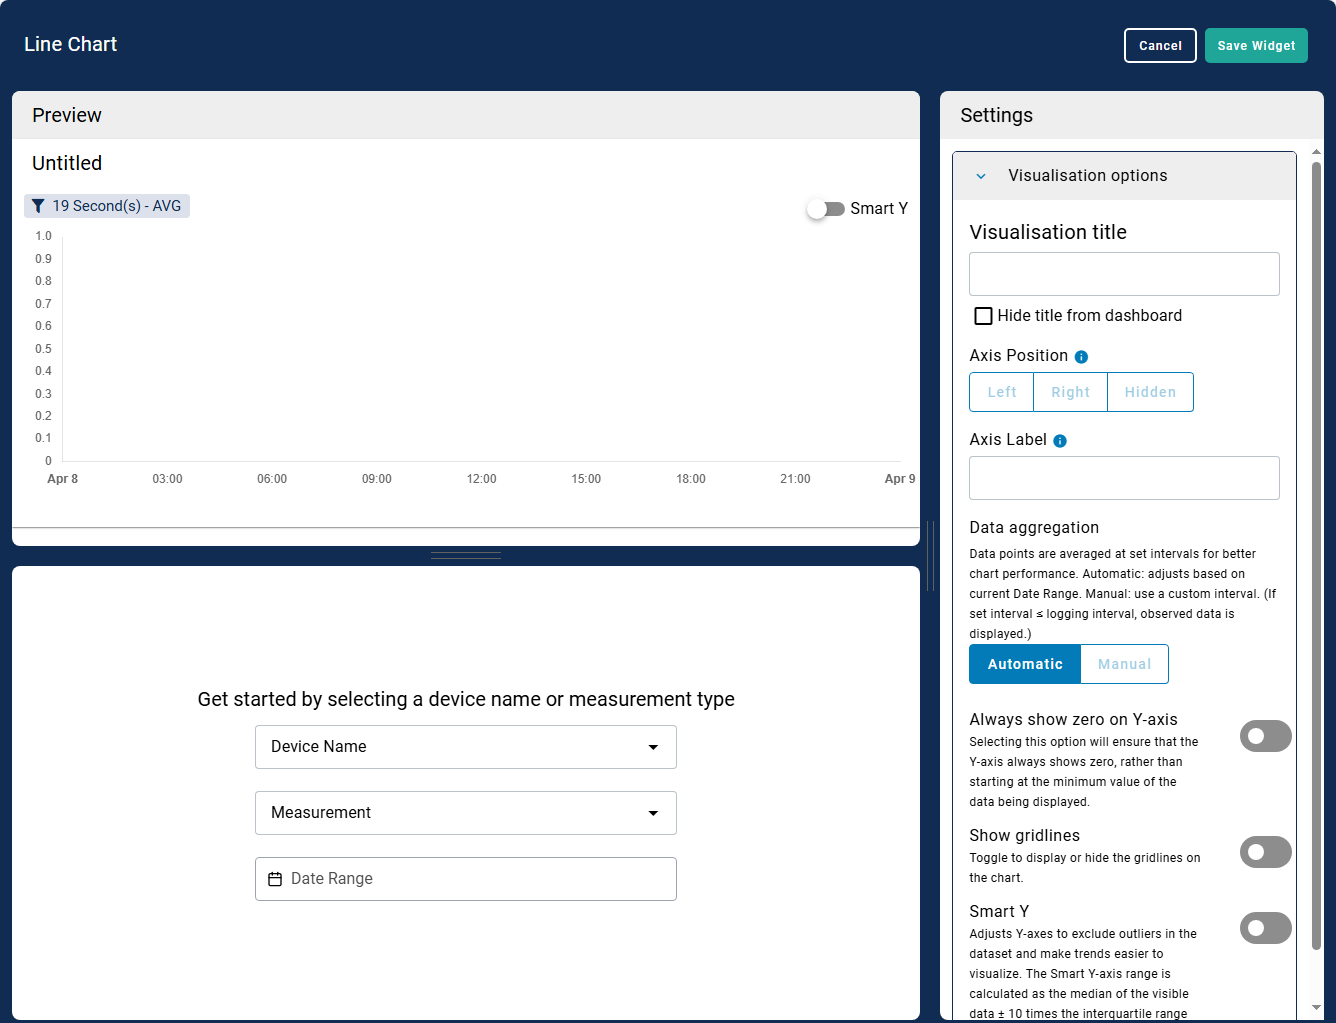
A gap-filled line chart is easily created from the chart configuration.
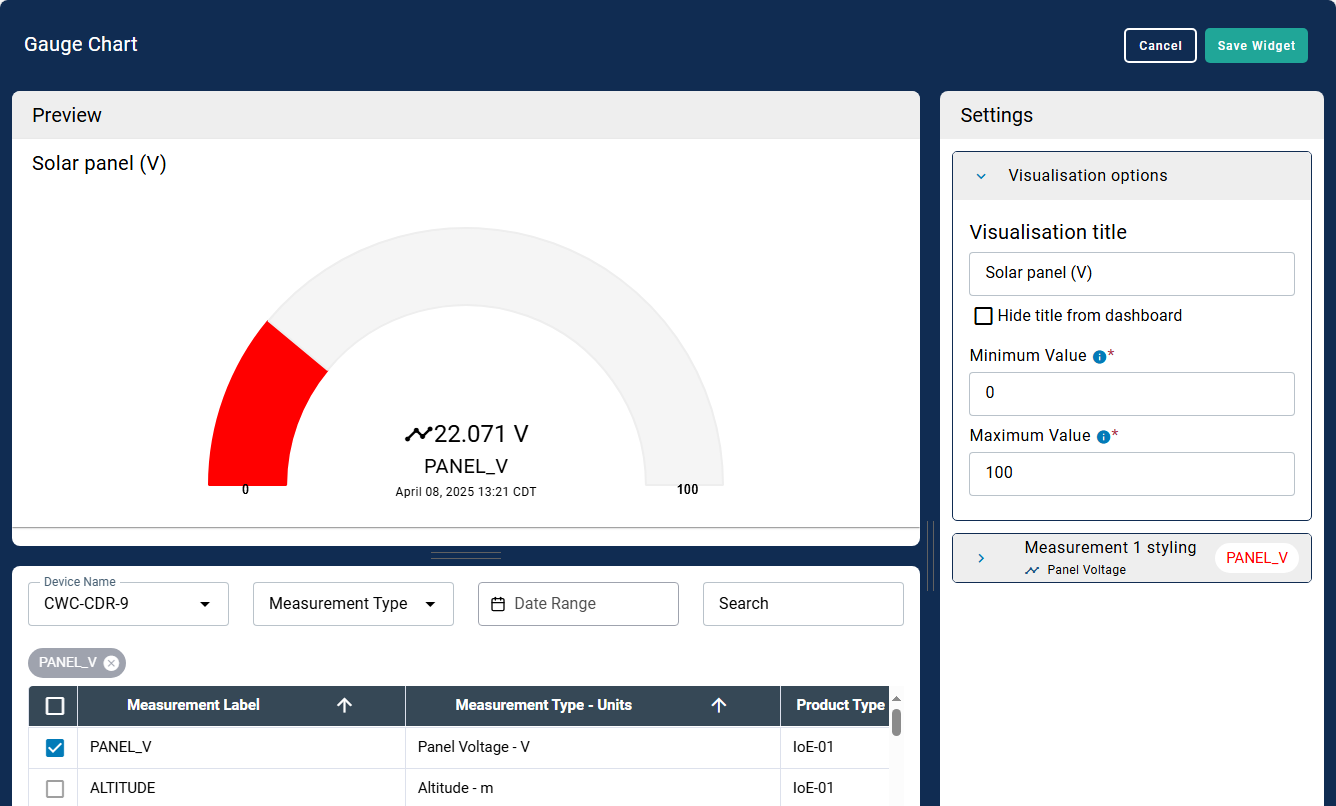
Gauge chart widget
A gauge chart displays a parameter on a configurable rotary-type indicator.
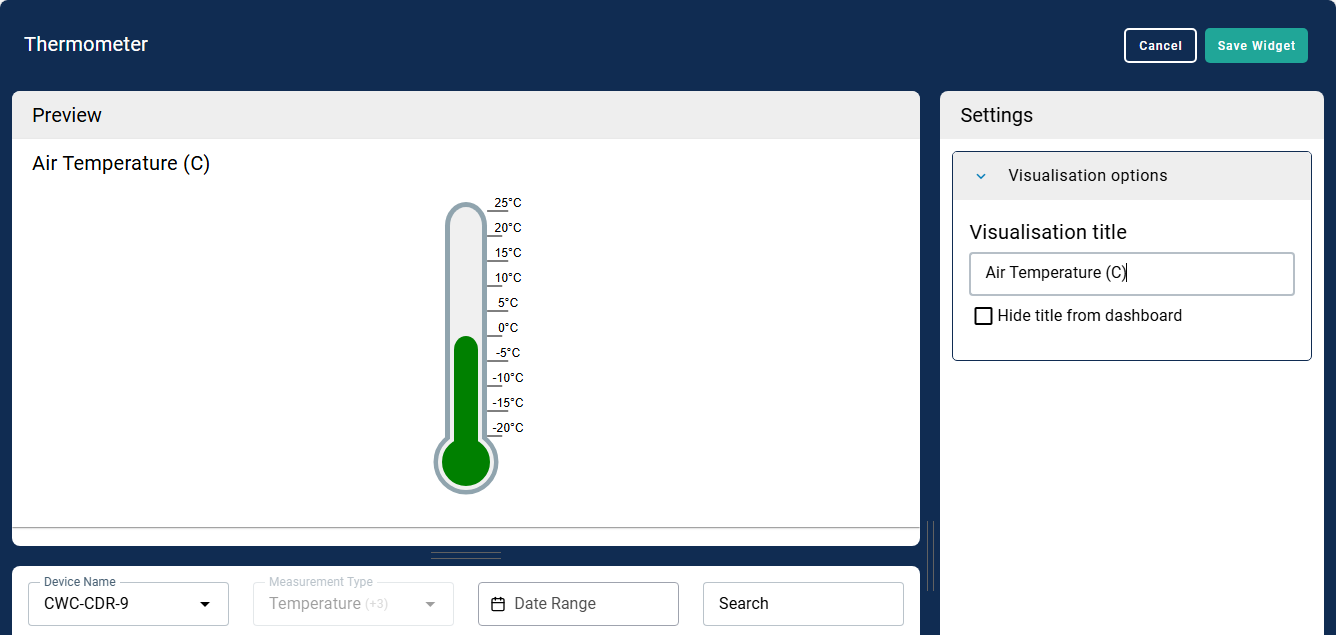
Thermometer widget
For the Thermometer, you can select a parameter to display and apply a title. The interface displays the temperature in a graphic that evokes the idea of a thermometer.
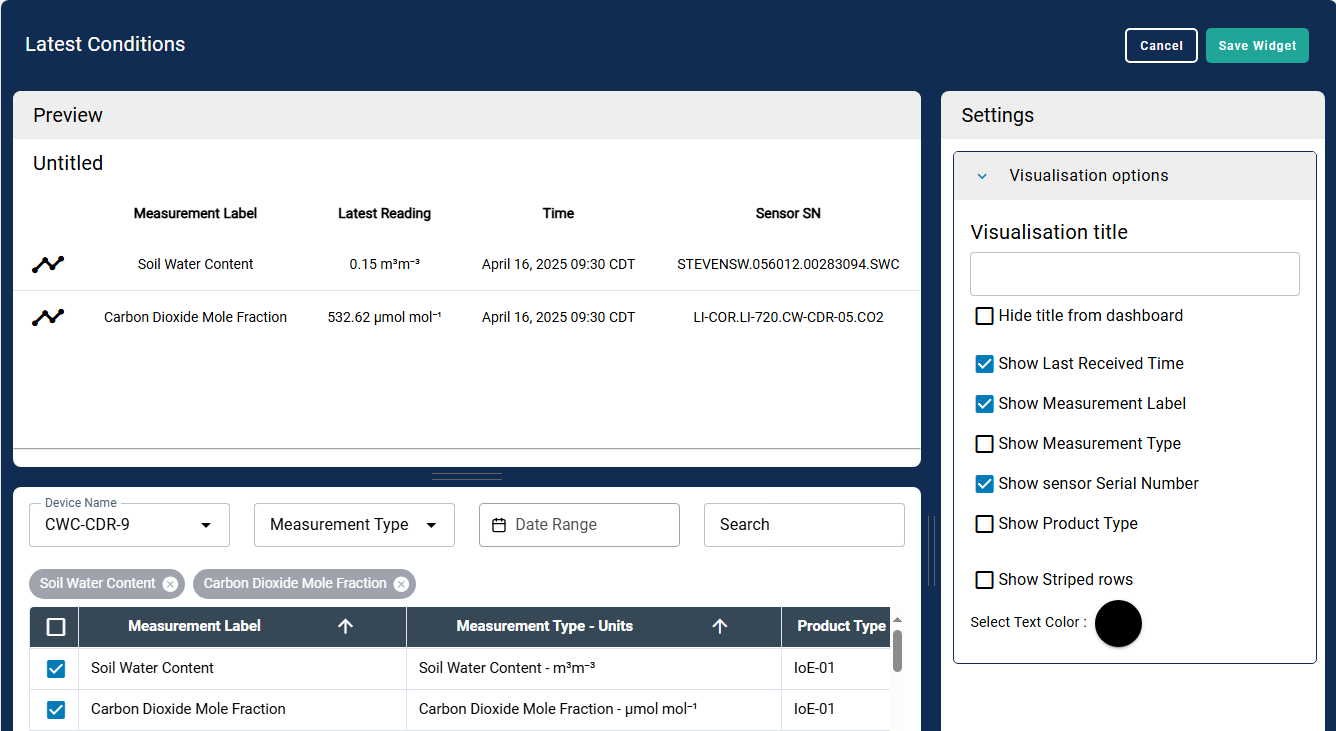
Latest conditions widgets
The latest conditions widget displays a concise table of parameters. You can choose the parameters to display and configure more details.
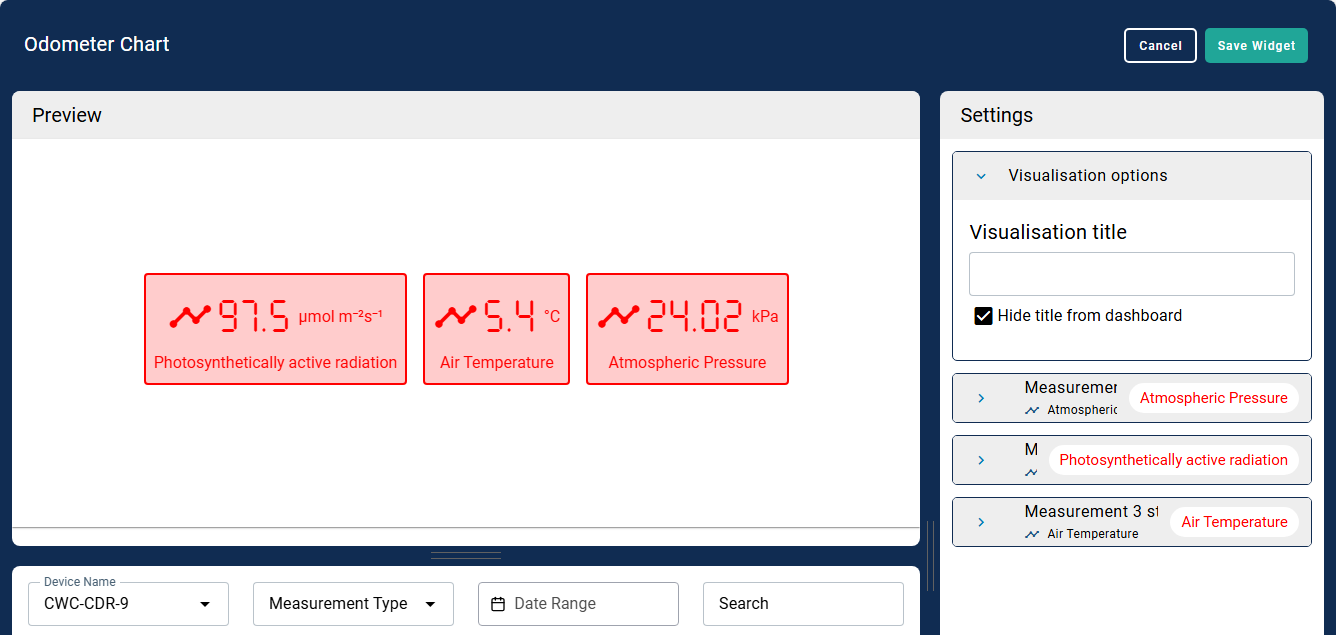
Odometer chart widget
Used to display a numeric value, the odometer gives a value and units. One odometer widget can display multiple variables.
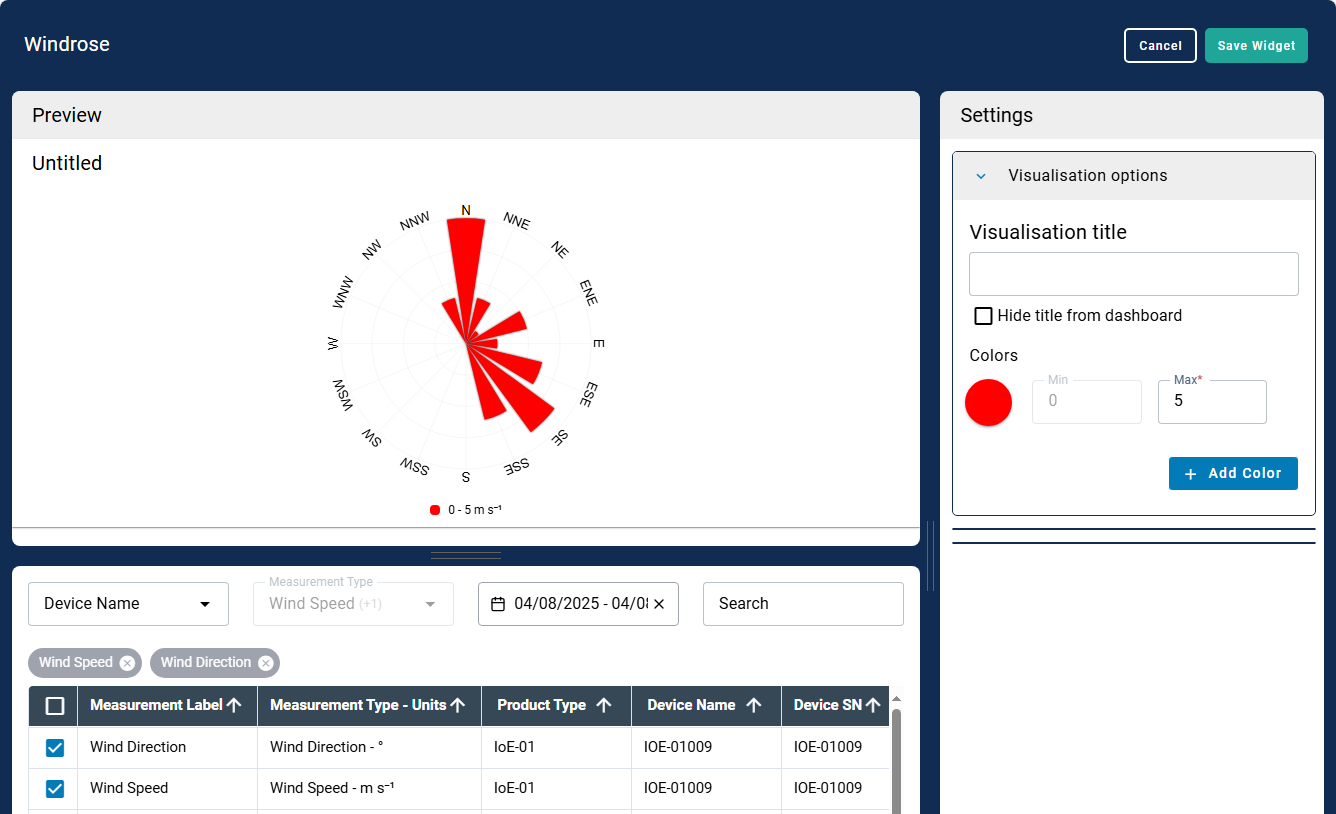
Windrose widget
Created with data from a 3-D or 2-D anemometer, a windrose shows the wind speed and direction around the sensor over a time period.
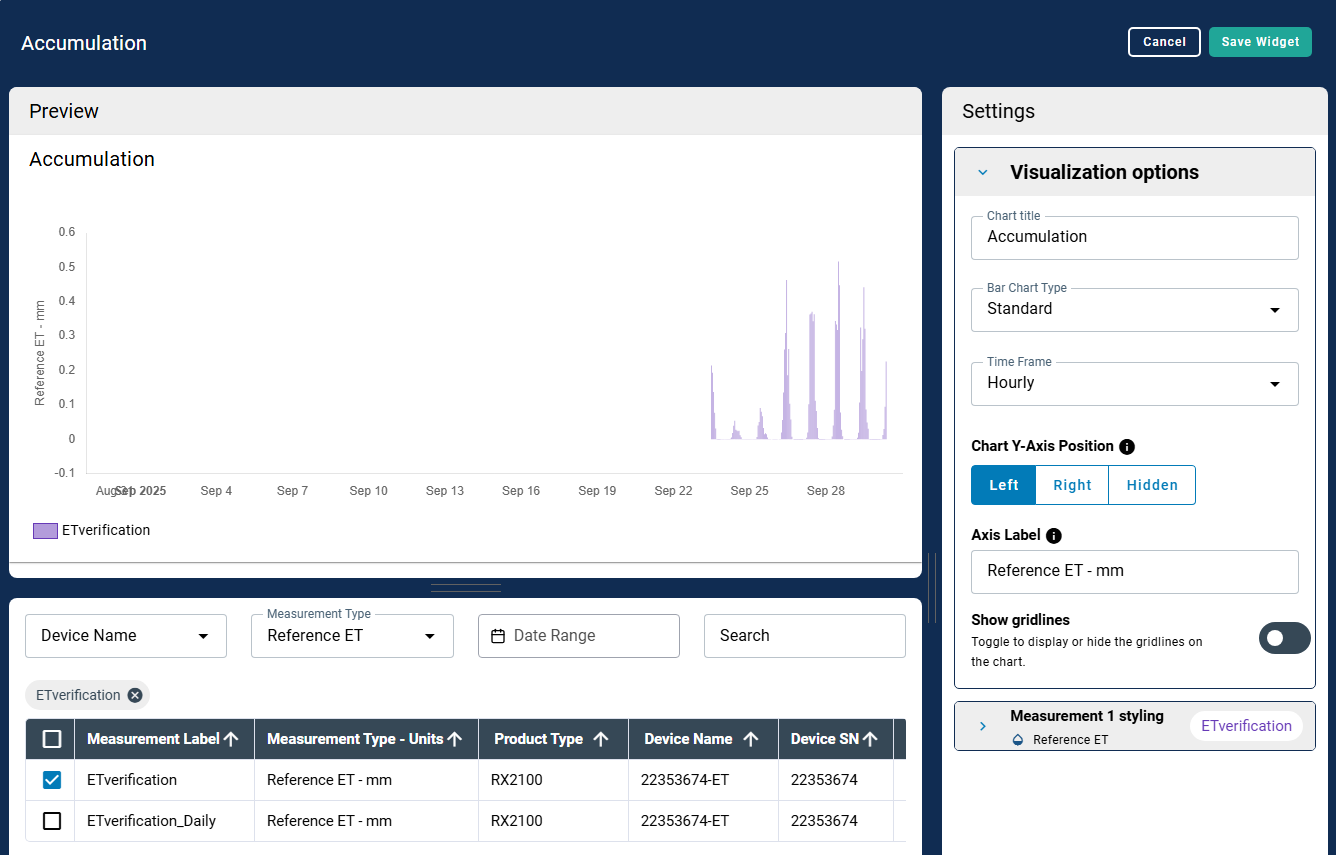
Accumulation widget
Accumulation is the sum of a measurement over a time period. Variables that are typically displayed in an accumulation widget may include rainfall, evapotranspiration, or carbon flux.
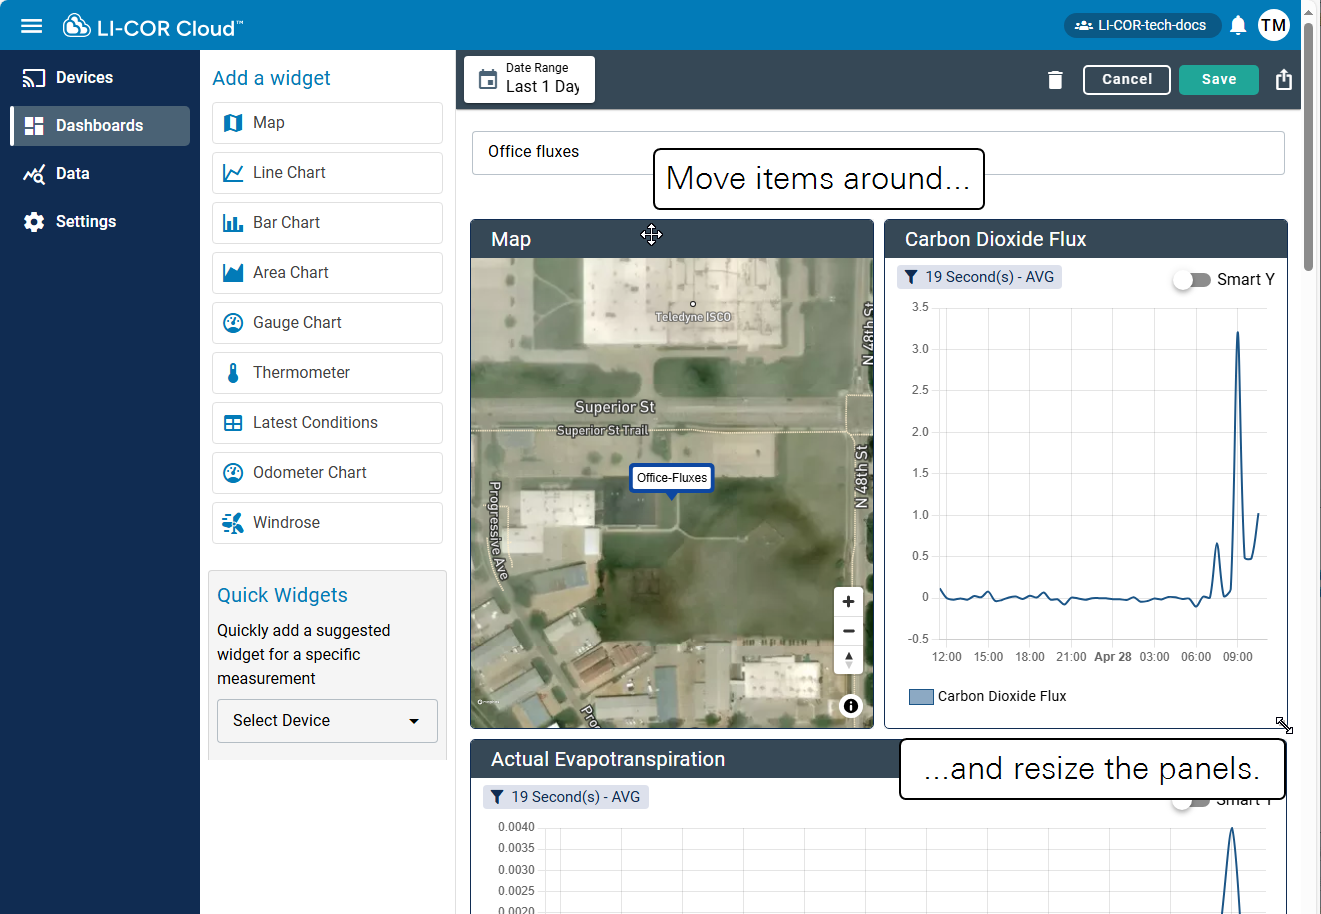
Customizing a dashboard
While in Edit mode, you can re-size panels, move them around, and make other changes to the dashboard.
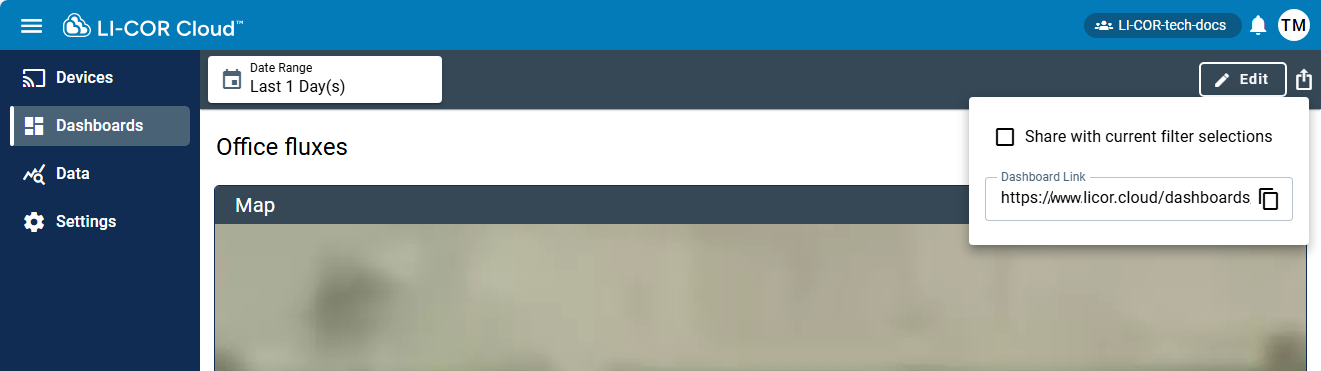
Sharing a dashboard
Sharing a dashboard allows anyone with the URL to view the dashboard without needing an account. This is useful way to share specific data with colleagues without having to grant wider access to the LI-COR Cloud organization and devices.
Click the Share button in the upper right corner of the dashboard.
-
Select Make Dashboard Public to allow anyone with the URL to view the dashboard.
-
Select Share with Current Filter Selections to apply the filters to the shared view (optional).