


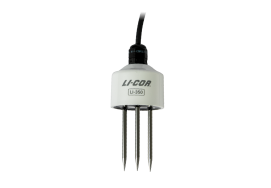
Summary of measurement principles
The LI-300 and LI-350 use established principles of dielectric permittivity to compute volumetric water content and electrical conductivity of the soil medium.
Normalized output
Measurements from each soil moisture sensor are standardized to real moisture scenarios using the end-points of water content: dry (zero) and immersed in deionized water (maximum). The calibration function incorporates a zero (offset) adjustment and a slope (span) adjustment in the following form:

where Vraw is the initial sensor output, Z (zero) and S (span) are factory parameters unique to each sensor. The calibrated sensor output is then used to calculate volumetric water content:
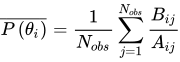
where VWC is volumetric water content (m3 m-3) and a4 through a0 are soil-type specific calibration parameters. For mineral soils, values are in Table 7‑1.
Z and S parameters can be computed on start-up from stored values of raw counts made in air and in water. Each sensor will then have Vcal = 1000 counts in air and 20000 counts in water. This gives a 19000 count range corresponding to a volumetric water content range of 0 to 1 m3 m-3, or 190 counts per change of 0.01 m3 m-3.
The LI-300 analog probe is zeroed and spanned at the factory to provide a calibrated output voltage range. The user must provide appropriate calibration coefficients for the soil type being measured to compute VWC (see Table 7‑1).
Factory calibration routine
The calibration requires measurement in air and water to calculate parameters Z and S, and then writing these values to memory (Vair and Vwater, respectively). Upon start-up, S and Z are computed from those measurements:
7‑3

7‑4

Factory calibration setup
The calibration measurements are made in a manner that isolates the probe from any nearby influences on the measurement. The volume of influence of the VWC measurement extends beyond the edges of the sensor itself by a significant margin (Figure 7‑1). Thus, the measurements in air and water should be made in sufficient volume to account for this.
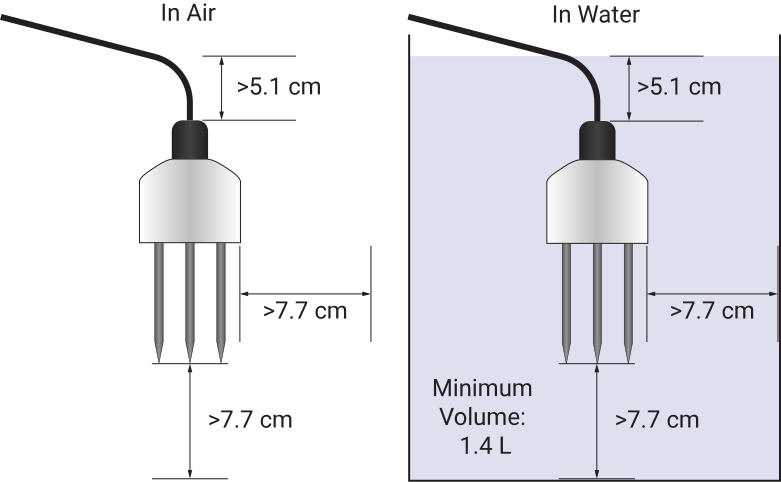
Testing indicates that the measurement influence extends 2 cm above the top of the cable gland and 3 cm beyond the tips of the tines and horizontally 3 cm beyond the edge of the probe housing, for a measurement volume ~ 1.4 L. To immerse the sensor fully, use a container with minimum height of 16 cm and minimum radius of 5.25 cm.
The probe responds quickly to H2O, reaching within 0.1% of the final value within 20 seconds.
Temperature measurement
The LI-300 and LI-350 have a thermistor inside one tine. The thermistor responds quickly to temperature changes, but thermal mass of the tine limits the rate of temperature changes. Typically, the tine will reach equilibrium temperature within a few seconds. In the LI-350, voltage is converted to T (°C) internally. With the LI-300, you'll need to apply equation 3‑2 to convert the voltage to temperature.
Dielectric permittivity
Dielectric permittivity is computed by the LI-350 and is available on MX230x dataloggers. Dielectric permittivity is not computed on the analog probes (LI-300s), but some loggers can compute apparent dielectric permittivity (ϵa) using the Topp equation (Topp et al., 1980), which was published as a way to compute VWC from ϵa. We have inverted the Topp equation to compute ϵa and then generated an equation for ϵa from the raw sensor output (Vcal). LI-350s do report this parameter for logging on MX230x HOBO loggers.
Due to the shape of the sensor response and the desire for the two ends to align with theory (ϵa of air = 1, ϵa of water = 80), a polynomial is used to compute ϵa from Vcal.
7‑5ϵ = E3VWC3 + E2VWC2 + E1VWC +E0
Parameters for the LI-350 are given in Table 7‑2.
| Parameter | Value |
|---|---|
| E3 | -155.81260 |
| E2 | 247.67700 |
| E1 | -12.69459 |
| E0 | 2.95259 |
Electrical conductivity
Electrical conductivity (EC) is computed with
7‑6

where I is current through the solution, Rd is the microcontroller resistance (average value measured at 33.8 ohms) and VL is ADC counts at the EC tine.
Calibration of the R value using a known resistance is not necessary. Rsens is computed from
7‑7
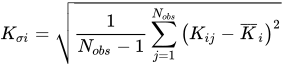
where Rsens in ohms is the resistance through the soil, VH and VL are the ADC counts from the two tines. Conductance is the reciprocal of resistance:
7‑8

where Csens is conductance in microSiemens (µS). We include a cell constant, K, in units of cm−1 so that conductance is reported in units of µS cm-1
7‑9
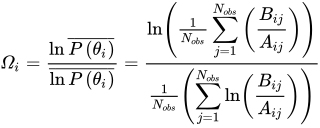
A 3rd order polynomial is used to describe the EC measurement
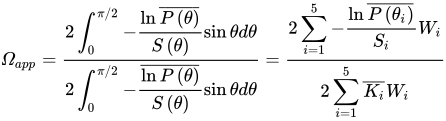
where EC is the conductivity computed at the measurement temperature.
| Parameter | Value |
|---|---|
| EC3 | 4.06958e-12 |
| EC2 | 8.87316e-07 |
| EC1 | 1.38449e-01 |
Finally, the value is normalized to 25 °C with
7‑11
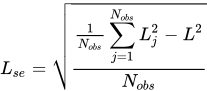
where EC is from equation 7‑10 and Tmeas is the probe temperature in °C.
References
| 1 | Topp, G.C., Davis, J.L., and Annan, A.P. (1980). Electromagnetic Determination of Soil Water Content: Measurements in Coaxial Transmission Lines. Water Resources Research, [online] 16(3), pp.574–582. https://doi.org/10.1029/WR016i003p00574. |