Now we combine gas exchange and fluorescence measurements. Make sure that the IRGAs are zeroed and matched, and that the instrument is ready to measure gas exchange before starting this exercise.
Light response curve
In this experiment, we are interested in two parameters: phiPS2 and phiCO2 (ΦPSII and ΦCO2 henceforth). ΦPSII is the quantum yield of PSII calculated from fluorescence, while ΦCO2 is the quantum yield calculated from CO2 assimilation. In order to calculate this, we need to know the total assimilation, which comes from measured CO2 assimilation in the light and an assumption (or prior measurement) of assimilation in the dark. We also need Qabs, which involves knowing incident PAR and leaf absorptivity.
Note: If using a C3 species for this experiment, it is best to proceed under non-photorespiratory conditions (that is, low oxygen). This can be achieved by attaching a tank of < 2% oxygen to the LI-6800 inlet. Use an appropriate regulator, T-fitting, and a flow meter to provide adequate flow to the pump and a place for excess flow to be vented. If you do not do this, the measured relationship between ΦPSII and ΦCO2 will likely not be linear. You can avoid this problem by using a C4 plant since even at ambient O2, CO2 does not have to compete with O2 for the RuBisCO active sites.
In this exercise, we will start with a light-adapted plant and gradually work toward higher quantum efficiencies and yields by decreasing the incident light. We will use the Light Response program to accomplish this.
- Select a leaf that is adapted to the light starting place. Assimilation and conductance should be at steady states.
- Set up a graph of fluorescence.
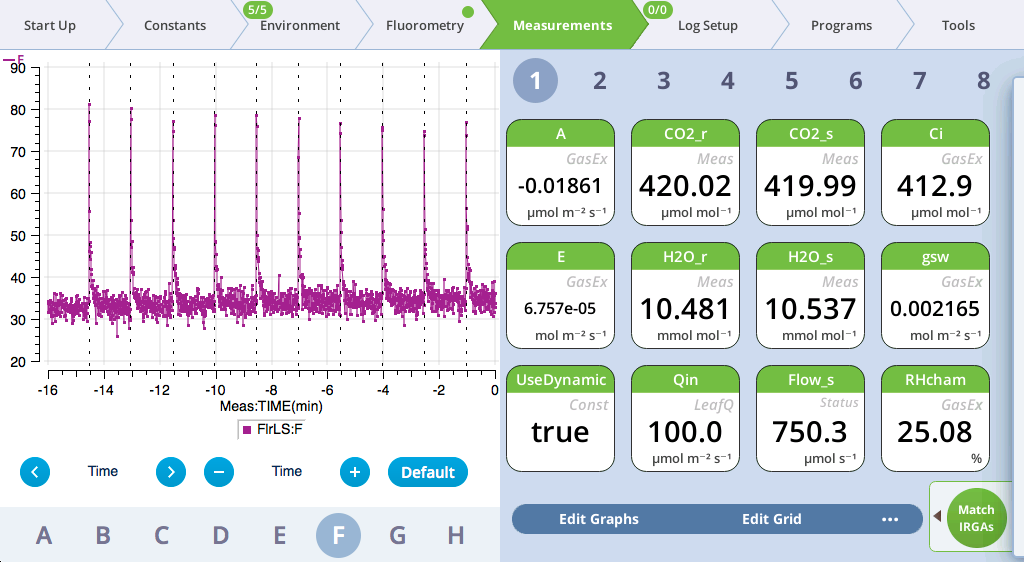
- Under the Measurements tab:
- Select graph F to make it easy to remember (F for Fluorescence).
- Tap Edit Graphs.
- Set Plot: Time.
- Select the variable: Under FlrLS, select F (demodulated fluorescence).
- Prepare the chamber environment.
- Under the Environment tab, set:
- Flow: On at 500 µmol s‑1
- CO2: Control on sample near ambient for the plant. To find ambient CO2, make sure flow is turned on then turn the CO2 and H2O controls off and step away from the console so you aren’t exhaling near the instrument’s air inlet. Look at CO2_r to see approximate ambient CO2. Enter that value as the setpoint.
- H2O: Set between 50% and 70% RH or VPD_leaf, as described in An automatic response curve using the Light_Response program
- Fan: 10,000 rpm
- Temperature: Control on T_leaf at a setpoint near ambient
- Light > Fluorometer: Control Mode: Setpoint, Setpoint: 2,000 µmol mol‑1, Color Spec: r90b10.
- Configure the measuring beam.
- Under Fluorometry > Settings > Measuring, set:
- Measuring Beam: On
- Dark mod rate: 500 Hz (see Dark mod rate for details)
- Light mod rate: 1 kHz
- Flash mod rate: 250 kHz
- Averaging: 15 s.
- Set Fluorescence constants.
- Under Fluorometry > Constants:
-
- Adark: 0.5 unless you have the value derived from a prior measurement. 0.5 is an arbitrary choice; it will not be known until after the curve is developed if you have opted to do a fast light response curve. It is used to estimate phiCO2.
- Fm, Fo, and PS2/1: These are populated with data from a prior dark-adapted measurement. This is set automatically if you just did a dark-adapted measurement. If the dark-adapted measurement was not taken immediately prior to the light-adapted measurement, you'll write these values down and enter them manually, assuming they were collected previously from the same leaf.
- Open a log file and configure the options.
-
- Matching Options: Select Only match if and select ΔCO2 <10.0 ppm, Reference change >100 ppm, and Time > 10.0 minutes.
- Fluorometer Options: Flr Action at Log: Select 1: FoFm (dark) or FsFm' (light).
- Fluorometer Options: Flash type: Rectangular.
- Configure the Light Response Program.
-
- Light values: 2000, 1500, 1000, 500, 200, 100, 50, 0 µmol m‑2 s‑1
- Min wait: 60 seconds
- Max wait: 180 seconds
- Check Early match
- Set up graphs.
- Wait for the parameters to stabilize.
- See Stability for more information on stability criteria.
- Start the Program.
- Watch the curve develop.
A combined induction kinetics and gas exchange measurement
In this experiment we are interested in collecting the data to plot a chlorophyll fluorescence induction curve (OJIP; origin, inflection, intermediary peak, peak). This exercise is similar to , only now you'll measure gas exchange and initiate the measurement with the Log button.
- Select a dark-adapted leaf and close the chamber over it.
- If your leaf is not dark-adapted, enclose it in the chamber for about 20 minutes. Be sure the chamber light source is off.
- Set up the graph of fluorescence.
- Prepare the chamber environment.
- Under the Environment tab, set:
- Flow: On at 500 µmol s‑1
- H2O: Set between 50% and 70% RH or VPD_leaf, as described in An automatic response curve using the Light_Response program
- CO2: Control on sample near ambient for the plant. To find ambient CO2, make sure flow is turned on then turn the CO2 and H2O controls off and step away from the console so you aren’t exhaling near the instrument’s air inlet. Look at CO2_r to see approximate ambient CO2. Enter that value as the setpoint.
- Fan: 10,000 rpm
- Temperature: Setpoint near ambient
- Configure the measuring beam.
- Under Fluorometry > Settings > Measuring, set:
- Measuring Beam: On
- Dark mod rate: 500 Hz (see Dark mod rate for details)
- Light mod rate: 1 kHz
- Flash mod rate: 250 kHz
- Averaging: 15 s.
- Configure the induction flash parameters.
- Under Fluorometry > Settings > Induction, set:
- Red target: 15,000 µmol m-2 s-1
- Duration: 1000 ms
- Margin: 5 points
- Open a log file and configure it.
- Under the Log Files tab:
-
- Matching Options: Select Only match if and select ΔCO2 <10.0 ppm, Reference change >100 ppm, and Time > 10.0 minutes
- Fluorometer Options: Flr Action at Log: Select 1: FoFm (dark) or FsFm' (light)
- Fluorometer Options: Flash type: Induction
- Set up a Program.
- The program called AutoLog can be configured to log measurements at repeated intervals. Configure it for a 90 second log interval and a total time of 900 seconds (15 minutes). This is probably too short a relaxation time, given the Red target setting of 15,000.
- When both you and the plant are ready, Start the program.
- The instrument will do the flashes while recording gas exchange data.