
Fluorescence measurement examples
These section introduces some protocols that you can follow to measure some common chlorophyll a fluorescence parameters.
Determine Fv/Fm
Fv/Fm is an estimate of the maximum quantum efficiency of PSII reaction centers. This ratio is calculated from two parameters: Fo and Fm. Fo is the fluorescence level of a dark-adapted plant with all PSII primary acceptors ‘open’ (QA fully oxidized). Fm is the maximal fluorescence level achieved upon application of a saturating flash of light, such that all primary acceptors ‘close’ (QA fully reduced). Variable fluorescence, Fv, is the difference between Fo and Fm. The ratio of variable-to-maximal fluorescence is normally between 0.75 and 0.85, depending on leaf health, age, and preconditioning. Since this is a fluorescence-only experiment, don't worry about the gas exchange parameters.
- Dark-adapt the leaves.
- The best technique is to leave the plant in complete darkness overnight, taking measurements just before dawn. For our purposes, however, it will be adequate to dark-adapt the leaf for 20 minutes. You can wrap the entire leaf in aluminum foil or excise it from the plant and put it in a dark drawer (not for too long; you don't want it to wilt).
- Open a log file and configure the options.
- You can do the flash without a log file, but be aware that you won't record gas exchange data if you do it that way. Since you want to initiate the flash when you press the log button, configure the following settings:
- Under Log Setup > Match Options: Set to Never match, since we aren't doing gas exchange measurements right now.
- Under Log Setup > Fluorometer Options, set Flr Action at Log: Select 1: FoFm (dark) or FsFm' (light) and select Flash type: Rectangular.
- Under Log Setup > Open a log file, create a new file for the data.
- Set up a graph of fluorescence.
- Under the Measurements tab:
- Select graph F to make it easy to remember (F for Fluorescence)
- Tap Edit Graphs
- Set Plot: Time
- Select the variable: Under FlrLS, select F (demodulated fluorescence)
- Configure the Actinic light.
- Under Environment > Light > Fluorometer set Control Mode to Off so that the actinic light is off.
- Configure the Measuring beam.
- Under Fluorometry > Settings > Measuring:
- Measuring: On
- Dark mod rate: 50 Hz
- You want the highest rate you can get without inducing photosynthesis in the leaf. Look at the Q_modavg value to see how much actinic light is being provided.
- Configure the Rectangular flash.
-
- Red target: 8000 µmol m‑2 s‑1
- Duration: 1000 ms
- Output rate: 100 Hz
- Margin: 5 points
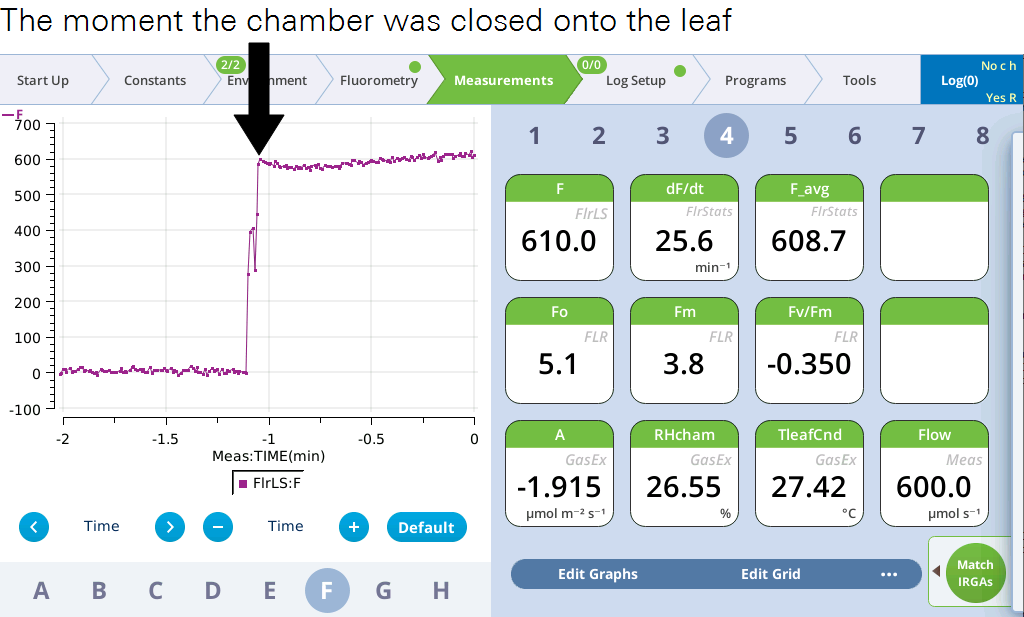
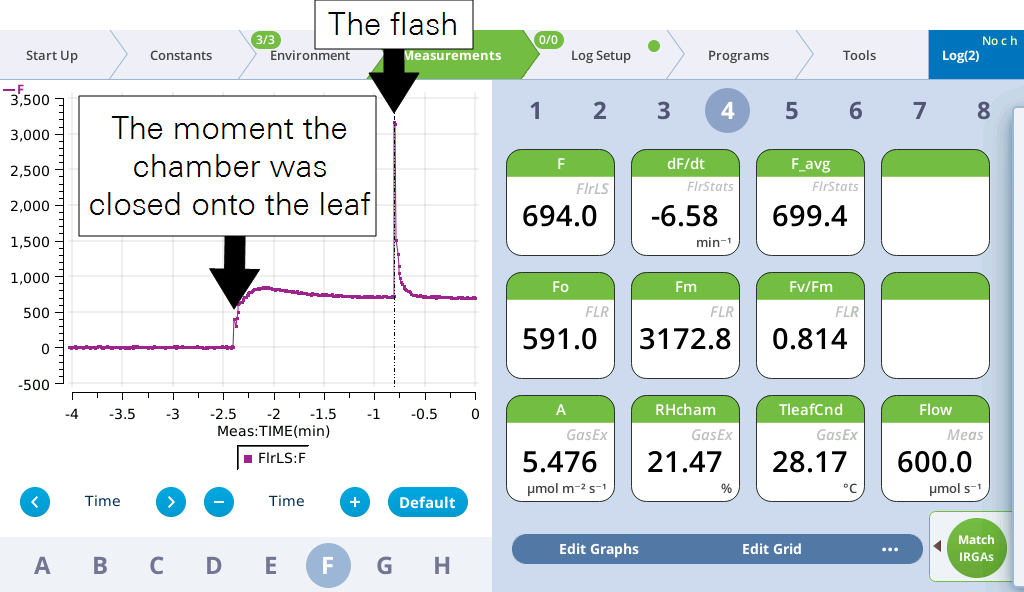
- Close the chamber onto the leaf.
- Observe the graph of F. You'll see the measured fluorescence from the leaf. It should stabilize fairly quickly, unless the measuring beam is too high, in which case you may need to set the Dark mod rate lower.
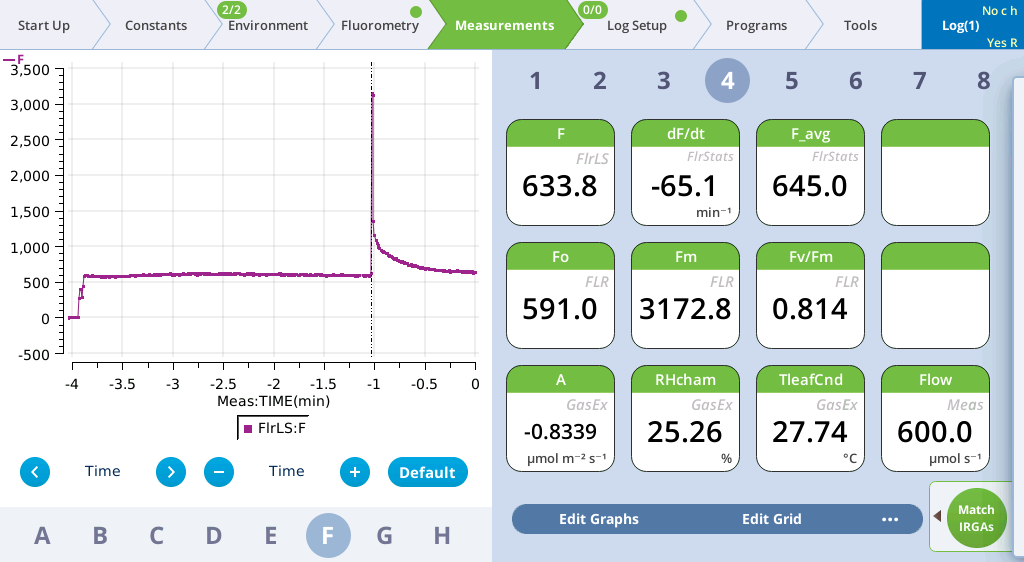
- After the leaf has stabilized (dF/dt will approach 0), tap the Log button.
- The flash will be evident on the graph.
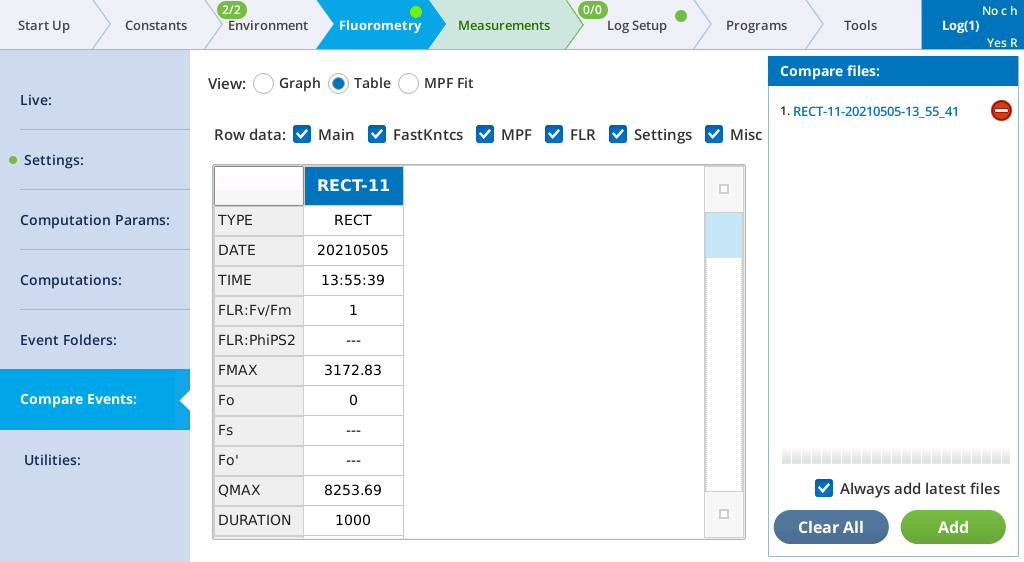
- View the Flash Results.
- Go to Fluorometry > Settings > Results to review the flash data.
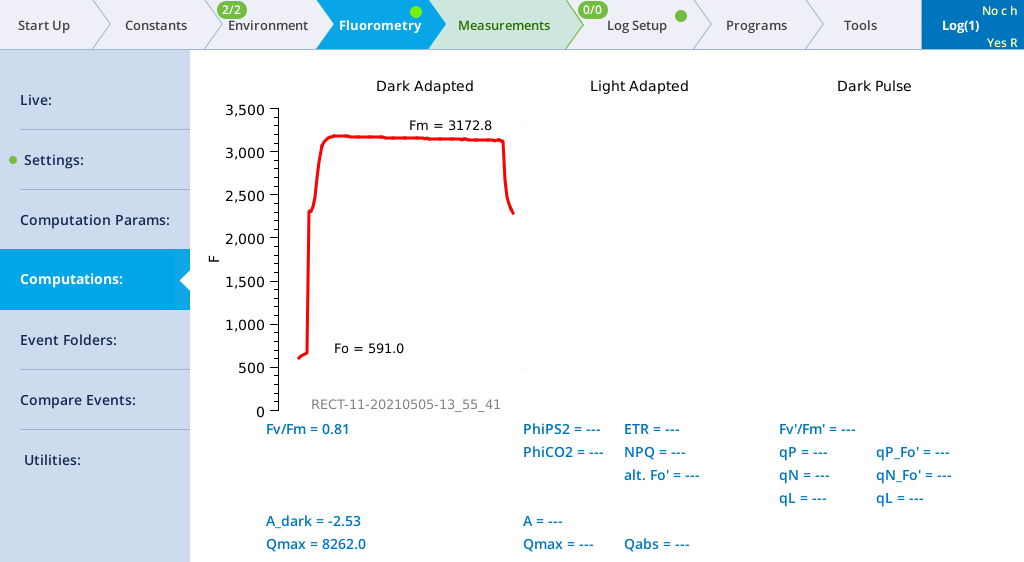
- Tap Files to see a graph of the fluorescence emission and flash.
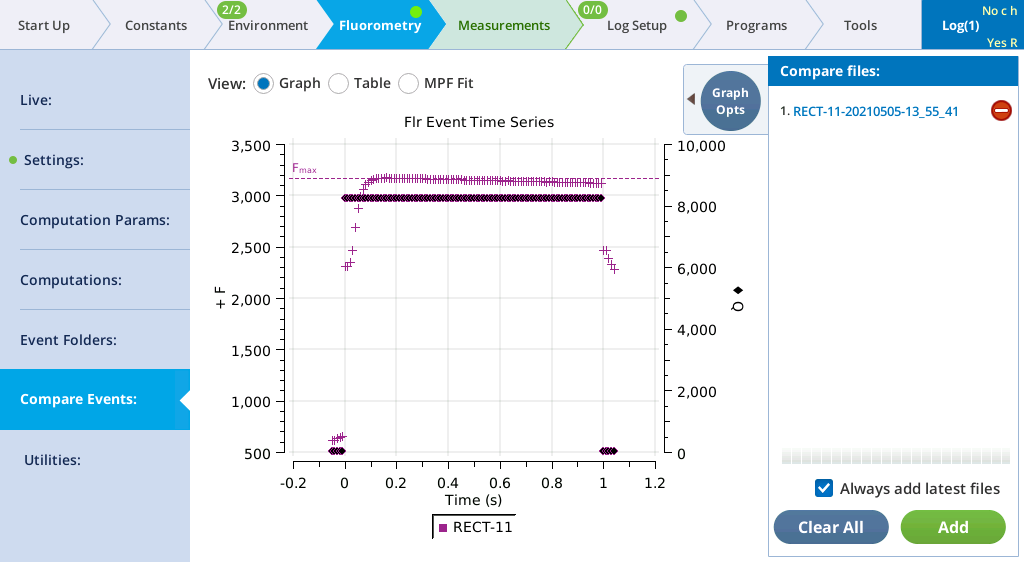
- Select Table to see the details recorded with the flash.
Determine PSII efficiency
ΦPSII (also known as ΔF/Fm') is the fraction of absorbed PSII photons that are used in photochemistry, and is measured with a light-adapted leaf. It is calculated from Fs and Fm’, where Fs is steady-state fluorescence and Fm’ is the maximum fluorescence from a light-adapted sample upon application of a saturating flash. See also Genty et al. (1989).
- Select light-adapted leaves.
- For this exercise, select a light-adapted plant that has had at least 20 minutes of acclimation at the desired light level. For the first part of this experiment, you’ll need several leaves that are about the same age and have similar illumination. At the end, you may want to try some leaves that have been at other light levels (shade vs. sun leaves).
- Set up a graph of fluorescence.
- This is just like the graph in the previous tutorial.
- Configure the fluorometer.
- Under Environment > Light > Fluorometer:
- Control Mode: Setpoint
- Setpoint: set Q target to the ambient level (displayed as Ambient to the upper right)
- Color Spec: r90B40
- Under Fluorometry > Settings > Measuring:
- Measuring Beam: On
- Dark mod rate: Leave at the default setting (50 Hz)
- Light mod rate: 50 kHz
- Flash mod rate: 250 kHz
- Under Fluorometry > Settings > Rectangular:
- Red target: 8000 µmol m‑2 s‑1
- Duration: 1000 ms
- Output rate: 100 Hz
- Margin: 5 points
- Open a log file and configure the options.
- Under the Log Files tab:
- Match Options: Only match if Elapsed time 10 minutes since last match, CO2_r has changed > 100 ppm since last match, and abs(CO2_r - CO2_s) < 1 ppm.
- Flr Action at Log: Select 1: FoFm (dark) or FsFm' (light).
- Flash type: Rectangular
- Start with a rectangular flash. Rectangular is good for low-light plants, such as those in a greenhouse or growth chamber. A multiphase flash is better for full sun plants.
- Close the chamber onto the leaf.
- Observe the graph of Fluorescence. You'll see measurements of fluorescence from the leaf. It should stabilize fairly quickly, unless the measuring beam is too high, in which case you may need to set the Dark mod rate lower.
- Tap the Log button. Check ΦPSII.
- View the flash results.
- Under Fluorometry > Settings > Results, if you have continued from the previous exercise without turning off the instrument, you'll see Dark-Adapted (from the prior measurement) and Light-Adapted parameters (from this exercise).
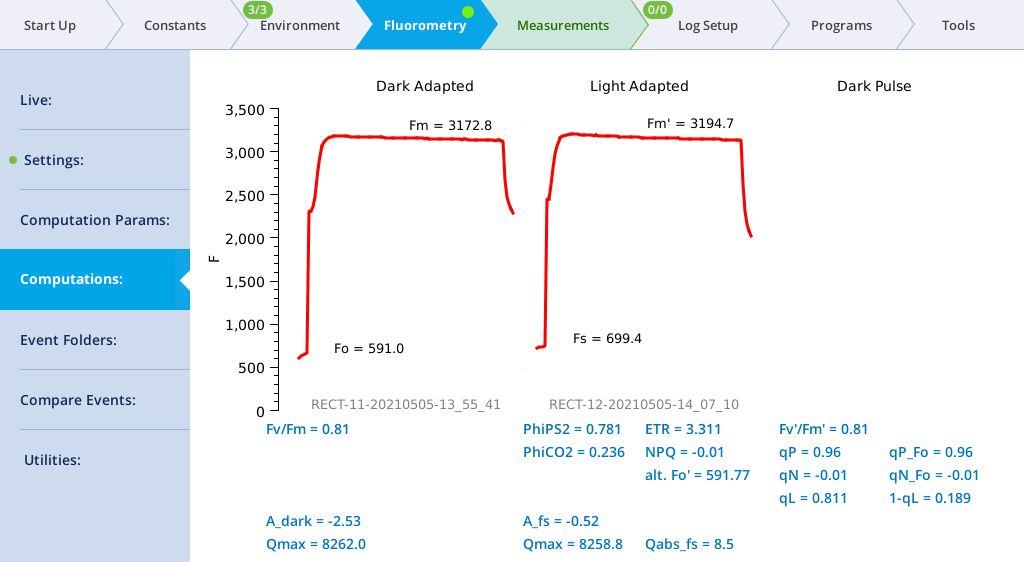
- Tap View under the Light-Adapted graph.
Repeat steps 7 and 8, measuring leaves of similar age and light history.
For further study, try different light values. Compare PSII quantum yields of leaves adapted to high (2,000 µmol m‑2 s‑1) and low (100 µmol m‑2 s‑1) light levels.
How does ΔF/Fm' differ between leaves adapted to high vs. low light?
PSII quantum yields are usually high under low light conditions because a large proportion of the absorbed light is used in photochemistry. High light-adapted plants tend to have low ΔF/Fm' values because a higher proportion of the absorbed energy is dissipated through non-photochemical processes.
Determine Fv/Fm and quenching coefficients
Three other useful fluorescence parameters will be explored in this experiment. Fv'/Fm' represents the efficiency of energy harvesting by oxidized (open) PSII reaction centers in the leaf. Two competing processes that quench (decrease) the level of chlorophyll fluorescence in the leaf are referred to as photochemical (qP) and non-photochemical (qN) quenching.
Many disciplines use these parameters, but the latter two are particularly useful as quantifiers in stress physiology research. All three of these parameters require Foʹ, the minimal fluorescence (in the dark) of a light-adapted leaf. How can this be determined? One method would be to allow the sample to dark-adapt and wait until all PSII centers oxidize (usually 20 minutes or more). A more expedient method would be to use far-red light to preferentially excite PSI and force electrons to drain from PSII. Only a few seconds of far-red time are needed for this to occur. The fluorometer provides a “dark pulse” routine which uses this second method to determine Foʹ. See Figure 8‑14 for an illustration of the dark pulse timing parameters.

- Select some plants.
- You'll need both dark- and light-adapted leaves for this exercise.
- Configure the fluorometer.
- Under Environment > Light > Fluorometer set Control Mode to Off, so that the actinic light is off.
- Configure the Measuring beam.
- Under Fluorometry > Settings > Measuring:
- Measuring: On
- Dark mod rate: 50 Hz
- Light mod rate: 1 kHz
- Flash mod rate: 250 kHz
- You want the highest rate you can get without inducing photosynthesis in the leaf. Look at the Q_modavg value to see how much actinic light is being provided.
- Configure the Rectangular flash.
-
- Red target: 8000 µmol m‑2 s‑1
- Duration: 1000 ms
- Output rate: 100 Hz
- Margin: 5 points
- Configure the Dark Pulse:
- This experiment requires the calculation of Fo' after the saturating flash, which requires configuring the dark pulse parameters under Fluorometry > Settings > Dark Pulse:
- FarRed target: 25 µmol m‑2 s‑1 (target intensity for the dark pulse)
- Duration: 5 (Time that Actinic light is off)
- Before: 1 (Number of seconds that far red is on before actinic is off)
- After: 1 (Number of seconds that far red is off after actinic is off)
- Margin: 5 (Number of data points before and after)
- Set up a graph of fluorescence (F).
- This is just like the graph in Experiment 1.
- Open a log file and configure the options.
-
- Flr Action at Log: Select 2: FoFm (dark) or FsFmFo' (light).
- Flash type: Rectangular
- Clamp onto your dark-adapted leaf.
- With the actinic light off and the measuring light on, wait until F becomes stable.
- Measure Fv/Fm (Tap the log button).
- Fo is immediately set to the current value of F. Then a saturating flash is done, and Fm is set to the maximum value during the flash. Following the flash, the data is logged. Check the Fv/Fm value and make sure it is reasonable. Finally, view the flash results.
- Turn on the actinic light and equilibrate.
- Under Environment > Light > Fluorometer, set the actinic light level to the average mid-day PAR value for your plant. Let the plant adapt to the new light level before going to the next step. To determine when the plant is adapted to the new light level, look for stability in F.
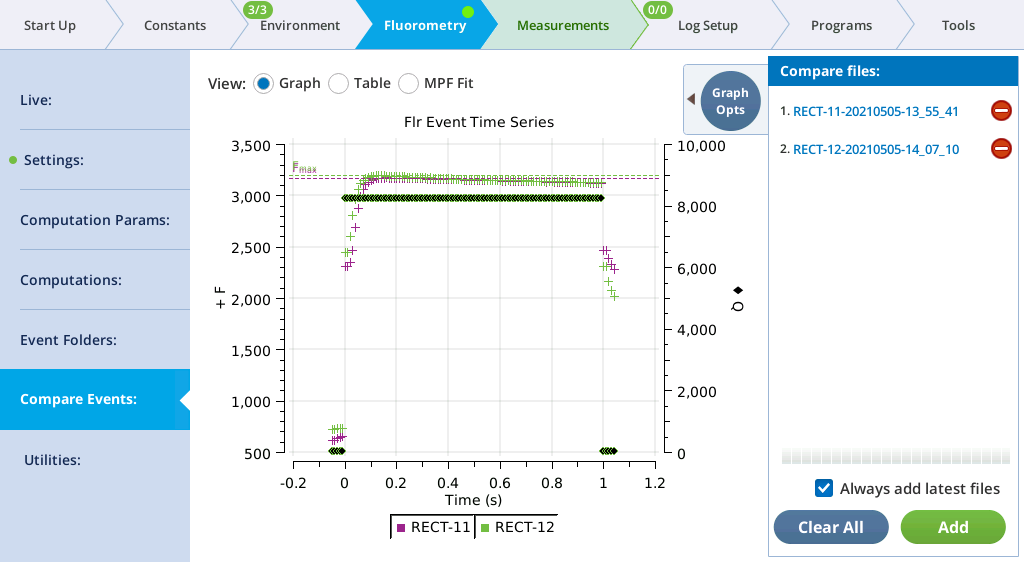
- Tap the Log button to do a flash and dark pulse.
- The graph should like similar to this (two flashes and dark pulses are represented):
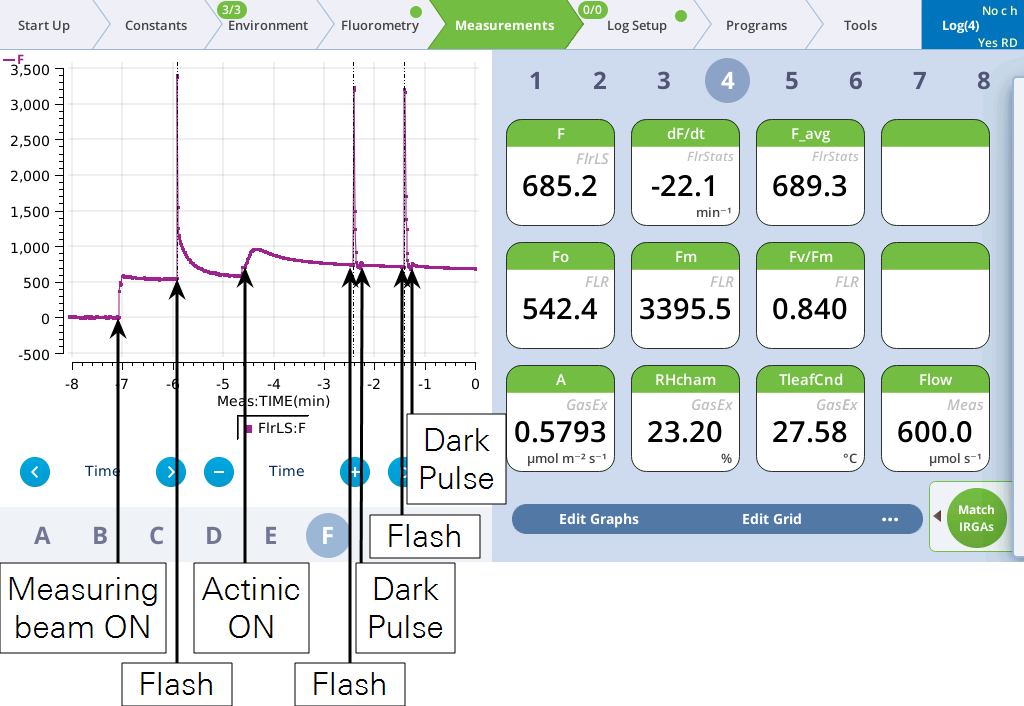
- View the dark pulse details.
- Tap Files and assess whether the dark pulse settings were appropriate by checking to see if the fluorescence signal levels off before the actinic light is turned on.
- Compare Fv/Fm with and Fv'/Fm'.
- Under Results, look at the calculated Fv'/Fm' value. Fv'/Fm' should be less than Fv/Fm, since Fv/Fm is the maximum quantum efficiency, and Fv'/Fm' is the effective quantum efficiency at this actinic light level, which is being reduced by the other processes that are competing for light energy. Note: Software version 1.5 will show a more detailed trace than that shown below.
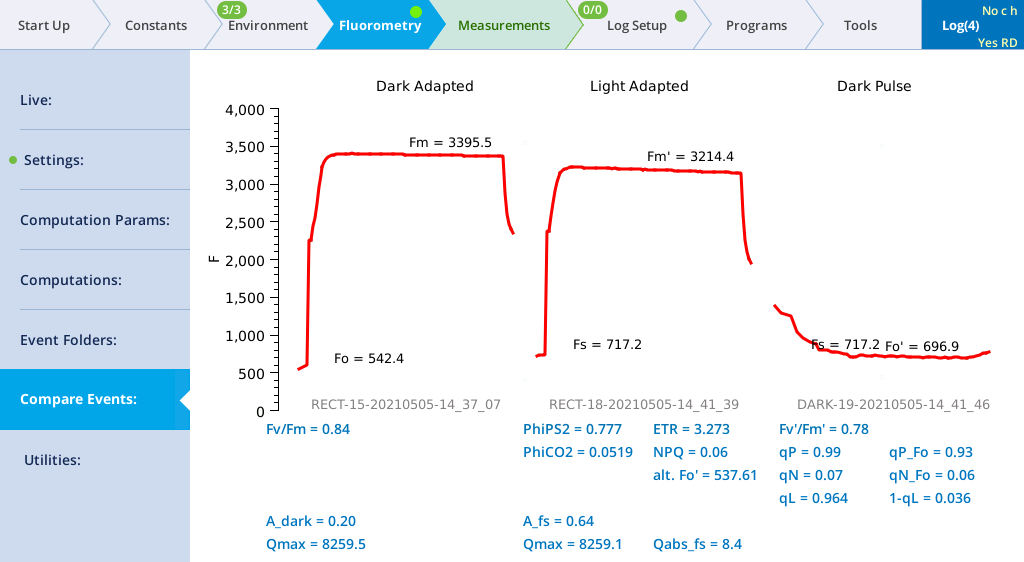
- Examine the quenching coefficients.
- The quenching coefficients qP and qN are described in Chlorophyll photophysics. qP and qN range in value between 0 and 1. For a truly dark-adapted plant, qP=1 and qN=0 at the time Fv/Fm is determined. As the actinic light level rises, these coefficients move in opposite directions.
- Repeat this on additional leaf samples.
- Compare the results with leaves adapted to high and low light conditions like in the previous exercise.
An induction kinetics measurement
In this experiment we are interested in collecting the data to plot a chlorophyll fluorescence induction curve (OJIP; origin, inflection, intermediary peak, and peak). You'll need a dark-adapted plant. For purposes of this exercise, you can simply enclose the leaf in the dark chamber for about 20 minutes. For real measurements, it is a good idea to dark-adapt the plants overnight.
- Select a dark-adapted leaf and close the chamber over it.
- If your leaf is not dark-adapted, enclose it in the chamber for about 20 minutes. Be sure the chamber light source is off.
- Configure the measuring beam.
- Under Fluorometry > Settings > Measuring, set:
- Measuring Beam: On
- Dark mod rate: 500 Hz
- Light mod rate: 1 kHz
- Flash mod rate: 250 kHz
- Averaging: 15 s
- Configure the induction flash.
- Under Fluorometry > Settings > Induction, set:
- Red target: 15000 µmol m-2 s-1
- Duration: 1000 ms
- Margin: 5 points
- Tap Flash Now.
- Upon completion of the flash, tap Results. Select the F option to display Modulated F and check the Log10 box to rescale the x axis.
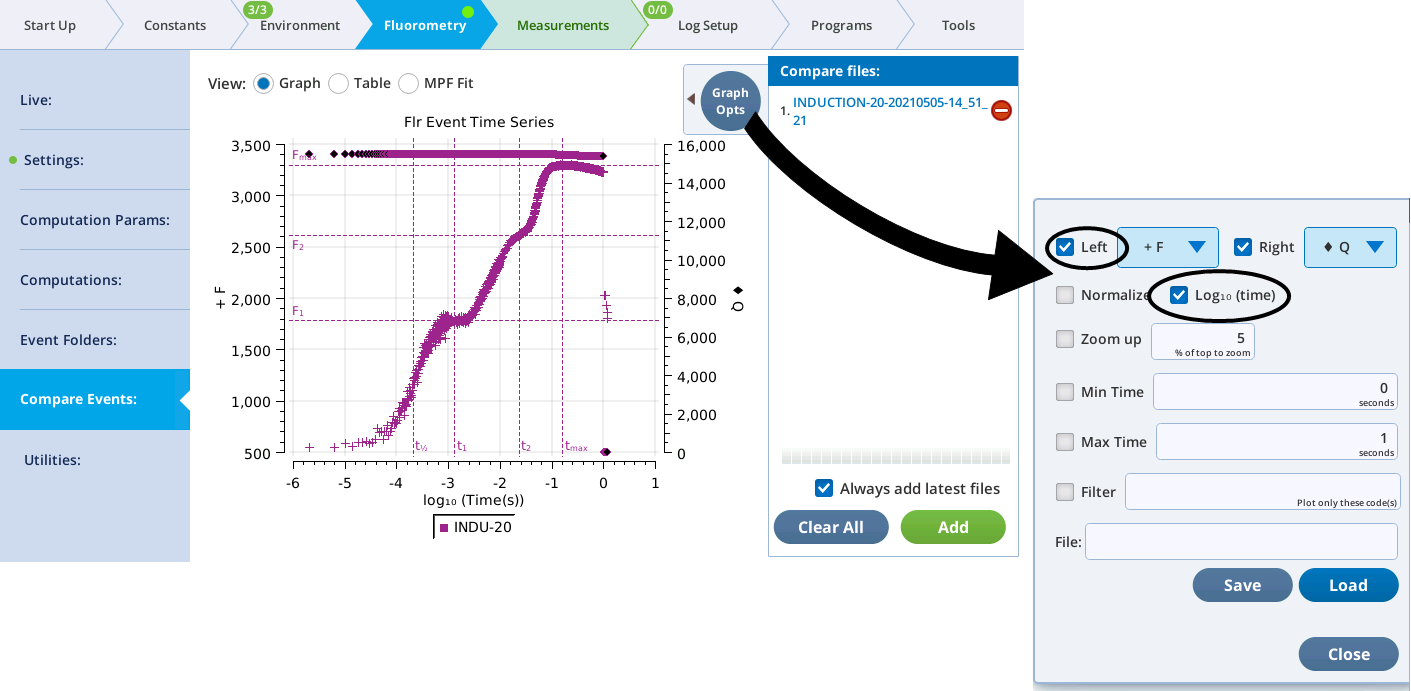
- The results should look like a typical induction curve. It is displayed with a logarithmic time scale.
If you want to initiate the flash from the log button, under Log Files > Logging Options set Flash type to Induction and open a log file. That will cause the flash to occur when the log button is pressed. The flash data are logged even if you did not open a log file. See The flrevents folder for more details.
Note: When you plot these data in a spreadsheet, you'll notice an outlier at the beginning of the data set (if your margin is 5, the 6th point, which is the first value after the flash begins) and possibly the end of the data set (the last value during the flash). This is an artifact resulting from the way the modulated AC signal is computed. You can delete the outlier from the data set. If you view the data on the instrument, we filter the artefactual data point.
Additional fluorescence measurements
For combined leaf-level gas exchange and fluorescence measurements begin by learning the leaf-level gas exchange system and then proceed to Fluorescence and leaf-level gas exchange measurement. For aquatic chamber measurements, see Measuring assimilation from aquatic samples.