
The Measurements tab
Tap Measurements to view graphs and values. This is where you view parameters that are measured and computed by the instrument and where you initiate a match.
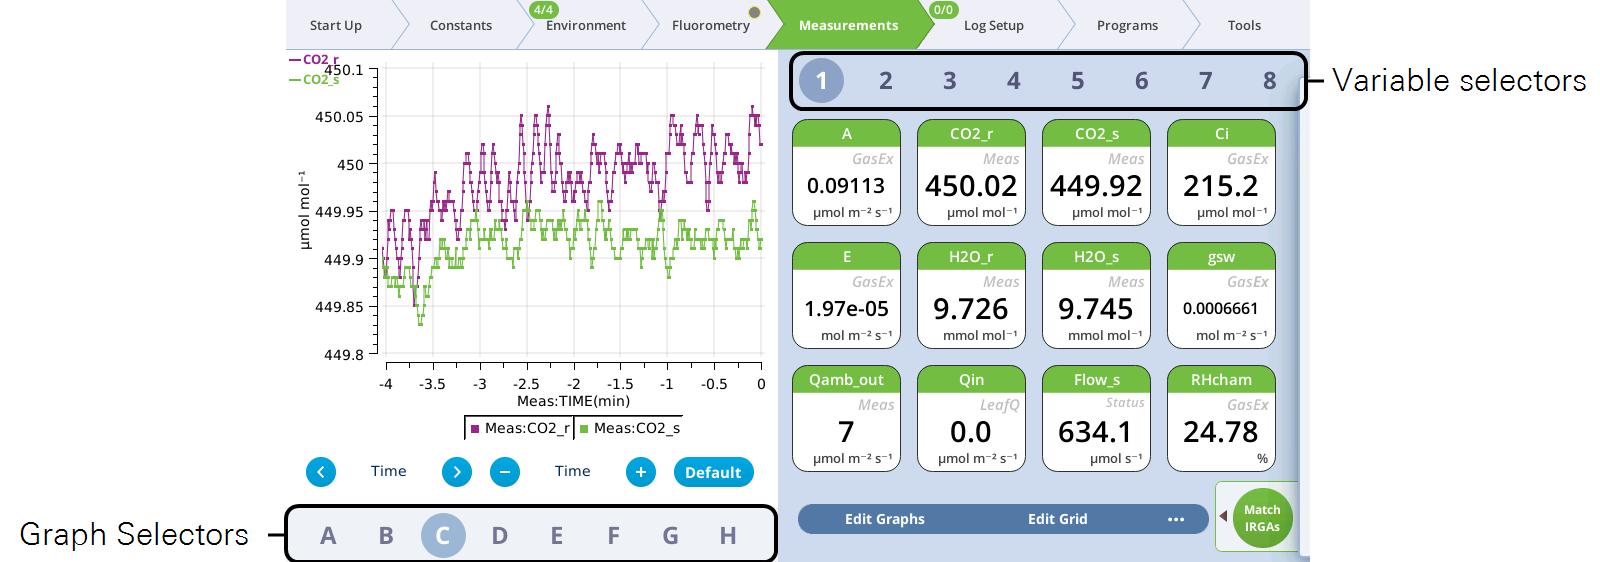
Graphs
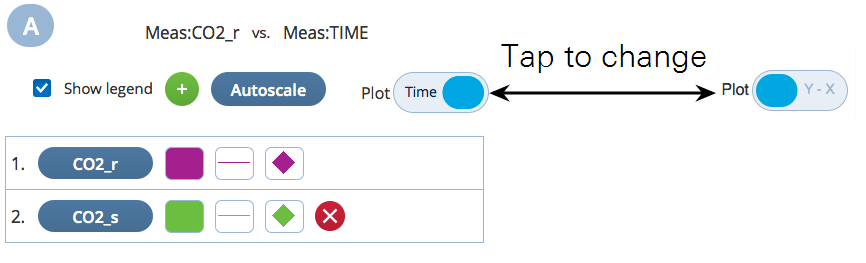
Eight Graph displays are available and they are designated letters A through H. Each plot can be a strip chart (a variable plotted against time) or a scatter plot (one variable plotted against another using discrete points usually representing logged observations). The graphs can display multiple variables simultaneously. You can adjust the time by scrolling left for back in time or right for forward in time1 and zooming in and out. For X-Y plots, you can zoom on each axis.
You can plot multiple variables on one graph and change the graphical display settings in other ways. To configure a graph:
- Tap Edit Graphs
- This opens the graph settings window, where you can do the following:
- Add a variable
- Tap the + to add a variable to the graph. Tap a variable to select a different one from a list. The variables menu shows groups based on the source of the variable. You can choose whether to display the units on the left or right axis.
- Change the settings and scaling
- You can set the color, line type, and marker type. The scaling is Autoscale by default, but you can specify a range by setting Fixed, Fixed Min, Fixed Max, or Fixed Delta.
- Turn off the legend by clearing the Show legend box.
- Plot two variables against each other.
- Set Plot: Time to show two variables against each other.
Default graph configurations
The default graphs are configured to present some common data of interest. If you have not altered the graphs, you'll see the following:
| Graph | Left Y Axis | Right Y Axis | X Axis |
|---|---|---|---|
| Standard leaf chambers and fluorometer | |||
| A | A | GSW | Time |
| B | Ci | E | Time |
| C | CO2_r | CO2_s | Time |
| D | H2O_r | H2O_s | Time |
| E | E | A | SysObs:obs |
| F | A | - | gsw |
| G | A | - | Qabs |
| H | A | - | Ci |
| Aquatic chamber and fluorometer | |||
| A | Flux | - | Time |
| B | pH | Temperature (aquatic) | Time |
| C | CO2_r | CO2_s | Time |
| D | H2O_r | H2O_s | Time |
| E | Flux | - | SysObs:obs |
| F | Q | - | Time |
| G and H | Flux | AquaticQ:Qabs | |
The graph definitions are specific for insect and soil chambers as well.
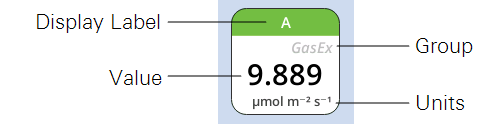
Variables
Eight Variable pages are available, and each page displays up to twelve variables. You can customize and filter the list of displayed variables, or re-size the variables list. Tap Edit Grid to alter the display.
View options
You can customize the measurements page. To view the options, tap the ellipsis button (...) to reveal the additional settings.
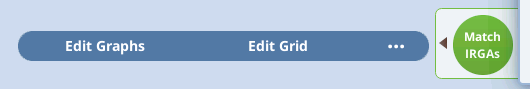
- Edit Graphs: This is where you can alter the settings of whichever graph is displayed. You can plot two variables against each other (tap Plot: X-Y) or over time (tap Plot: Time), adjust scaling, add variables, and alter the graph markers.
- Edit Grid: This is where you select the variables that are displayed. To change the variable displayed, tap it on the left, then select another variable on the right. You can change the number of variables displayed, which also changes the size of variables on the display.
- Clear Graph: This clears all plotted data from the current graph. It will also reset the autoscaling if autoscale is on. It does not delete any data from your files.
- Clear All Graphs: Clears all graphs.
- Mark Graph: Places a marker on the current graph. The marker is not retained in the log file.
- Mark All Graphs: Places a marker on all graphs. The marker is not retained in the log file.
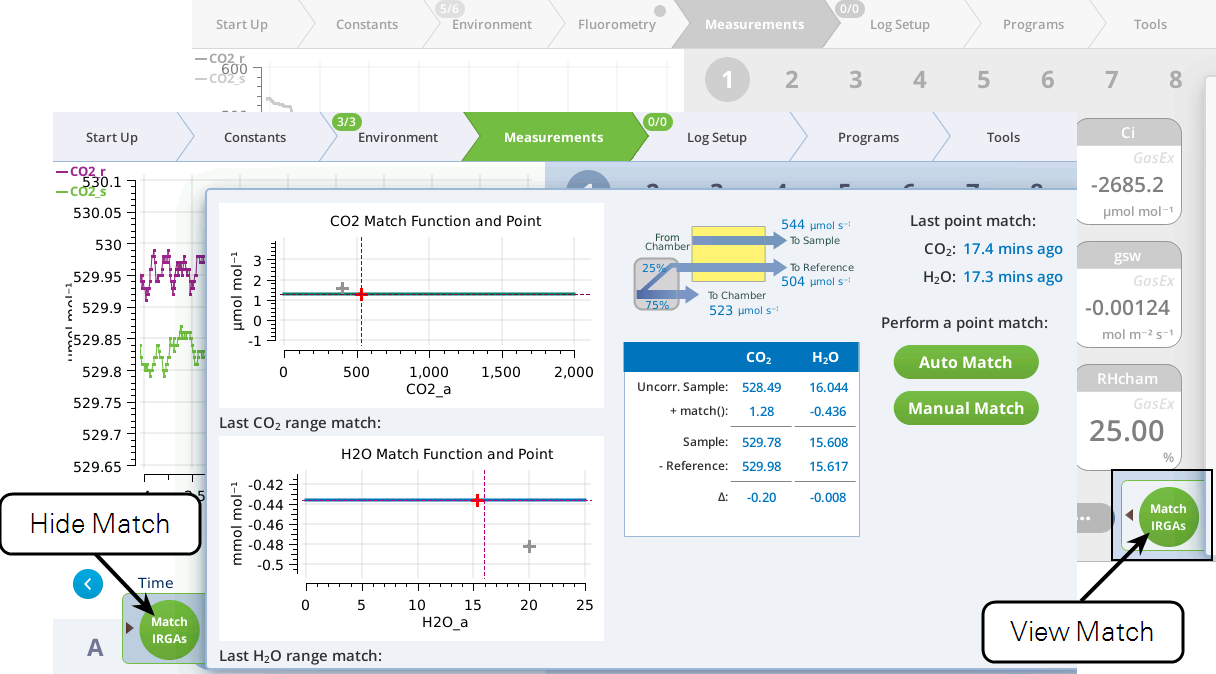
Match IRGAs
The match operation allows you to account for any difference between measurements from the sample and reference IRGAs. You have options, which depend on your measurement protocol and goals.
- For leaf-level measurements, see Matching the IRGAs.
- For aquatic measurements, see Matching the IRGAs for aquatic measurements.