The web interface provides access to the most important settings in the gas analyzer. Here, you can view graphs of data, download recorded data, configure the display, and alter instrument settings.
Home page
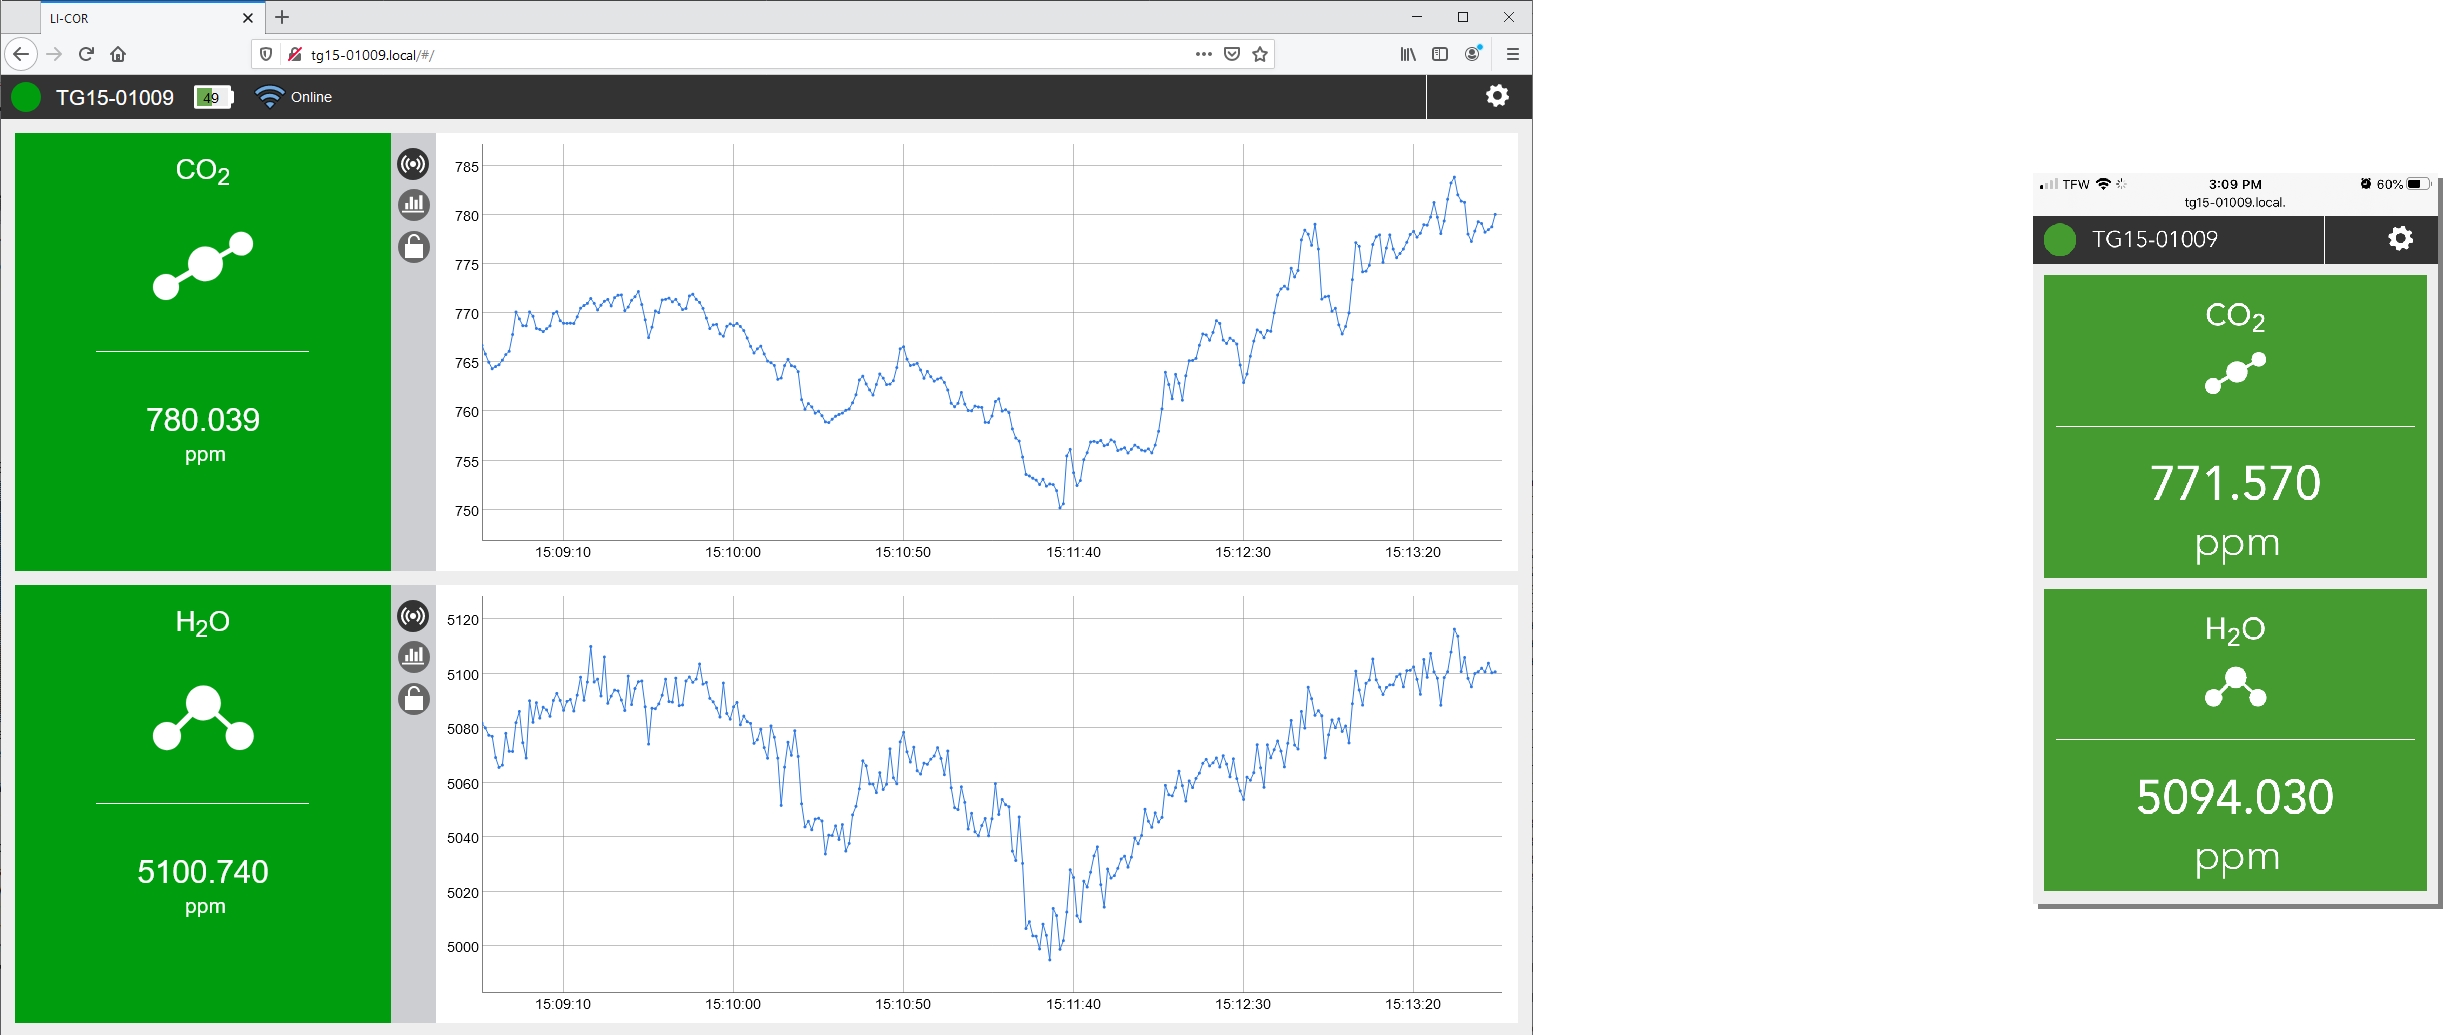
When you first connect to the instrument, it will display a home page with measurements, graphs, and options.
Indicators and buttons
You'll see the instrument serial number and status in the upper left. Normal operation is indicated by a green dot. A warmup or other status is indicated by an exclamation point in a yellow or red dot beside the instrument name.

|
Status indicator displays the performance status of the instrument. Green indicates normal operation. Red with an exclamation point indicates that the instrument is warming up or in an error state (see Performance status indicators). |

|
Battery charge status. The value (%) is the total charge available. Two fully charged batteries = 100. (50 can mean one fully charged battery or two half charged batteries). Check the charge gauge on each battery or the instrument display to determine which is depleted. |

|
Wi-Fi and network status information (see Wi-Fi). |

|
Click to return to the home page (only visible when not on the home page). |

|
Click to view the Options menu. |
Remarks
Remarks are user-entered information (15 characters maximum) that is recorded in the dataset along with other data in the database, including gas densities and diagnostics. For example, you might enter some information about the current measurement or data that you want to associate with the measurement in the records.

To enter a remark, simply type it into the field and click Start Remark. The remark will be recorded with each data record until you click End Remark.
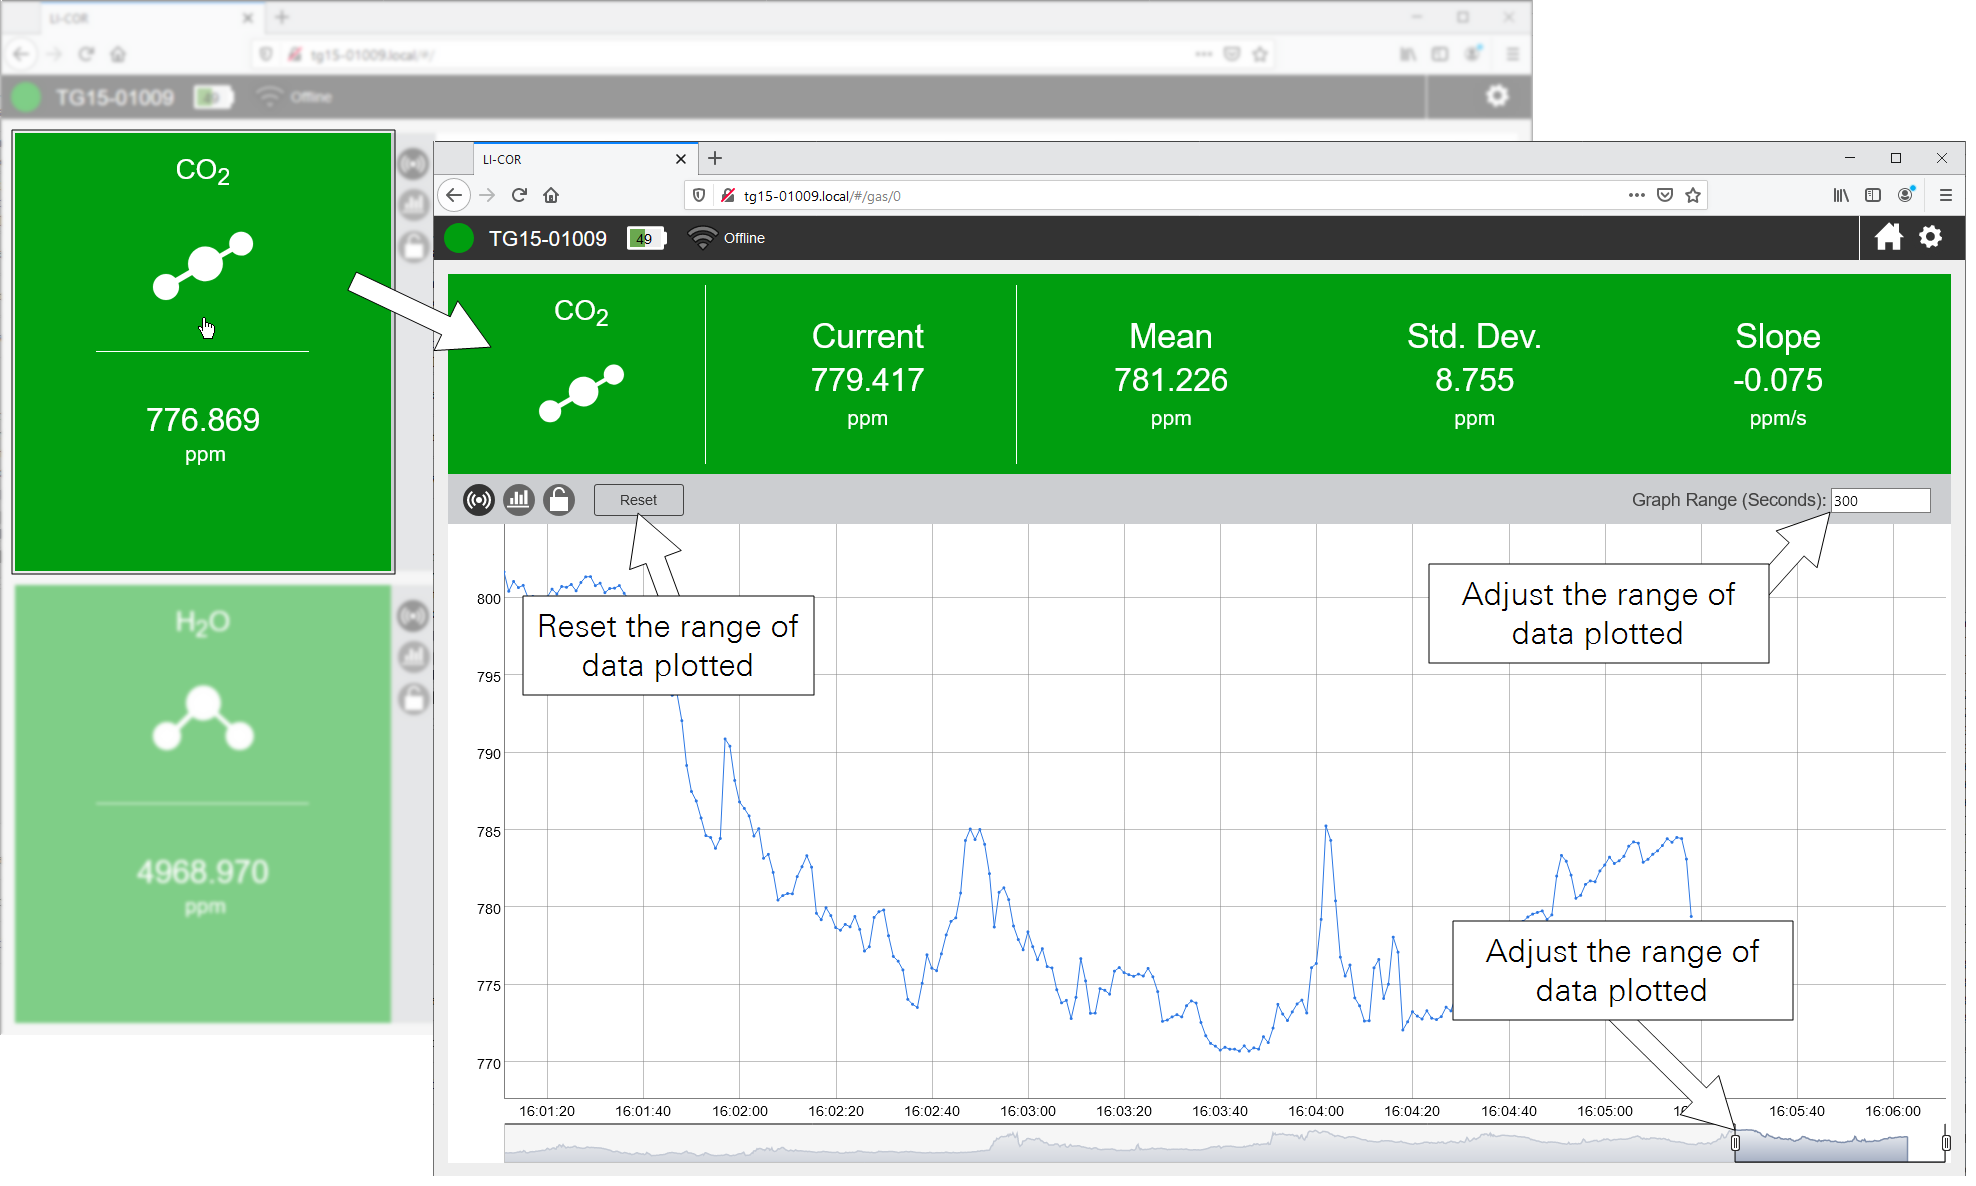
Graphs
In the graphs, you can click and drag to zoom in and reset the zoom by double-clicking the graph. For any gas, you can click the rectangular panel to view more details, including the current measurement, mean, standard deviation, and slope for the displayed time range. You can adjust the plotted time range with a slider or by typing in the number of seconds in Graph Range (Seconds). Click Reset to restore the default range of 300 seconds.

|
Click to display the entire history of measurements of this variable. |

|
Click to hide or show anomaly stripes (to indicate when a measured value exceeds a threshold (see Thresholds). |

|
Click to lock the graph to the current view. Click again to restore live graphing. |
Settings
Click Options > Settings to view a menu with basic instrument settings, including software updates and language, instrument configuration, time, networking, Wi-Fi, and connection to peripheral instruments.
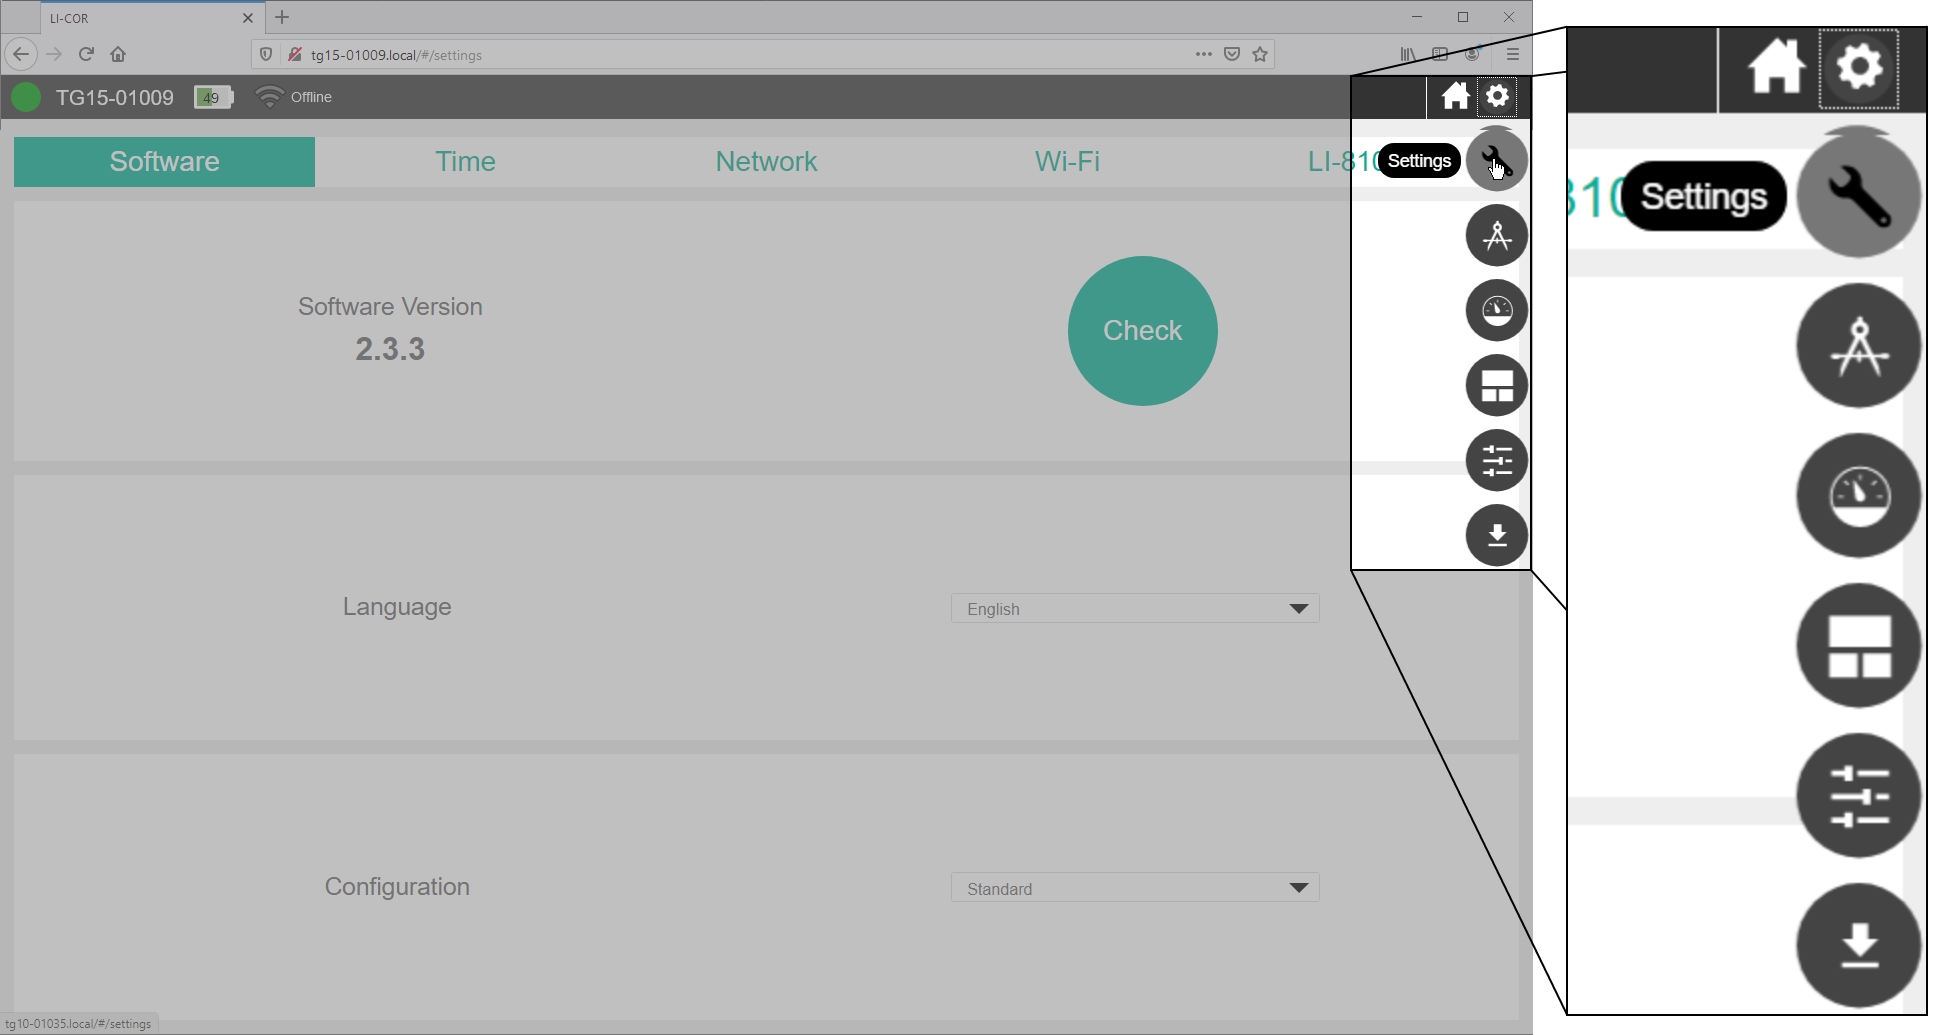
Software
Under Settings > Software, you can view the software version and check for updates. Click Check to check for software updates. The instrument must be online to check.
See Software updates for update instructions.
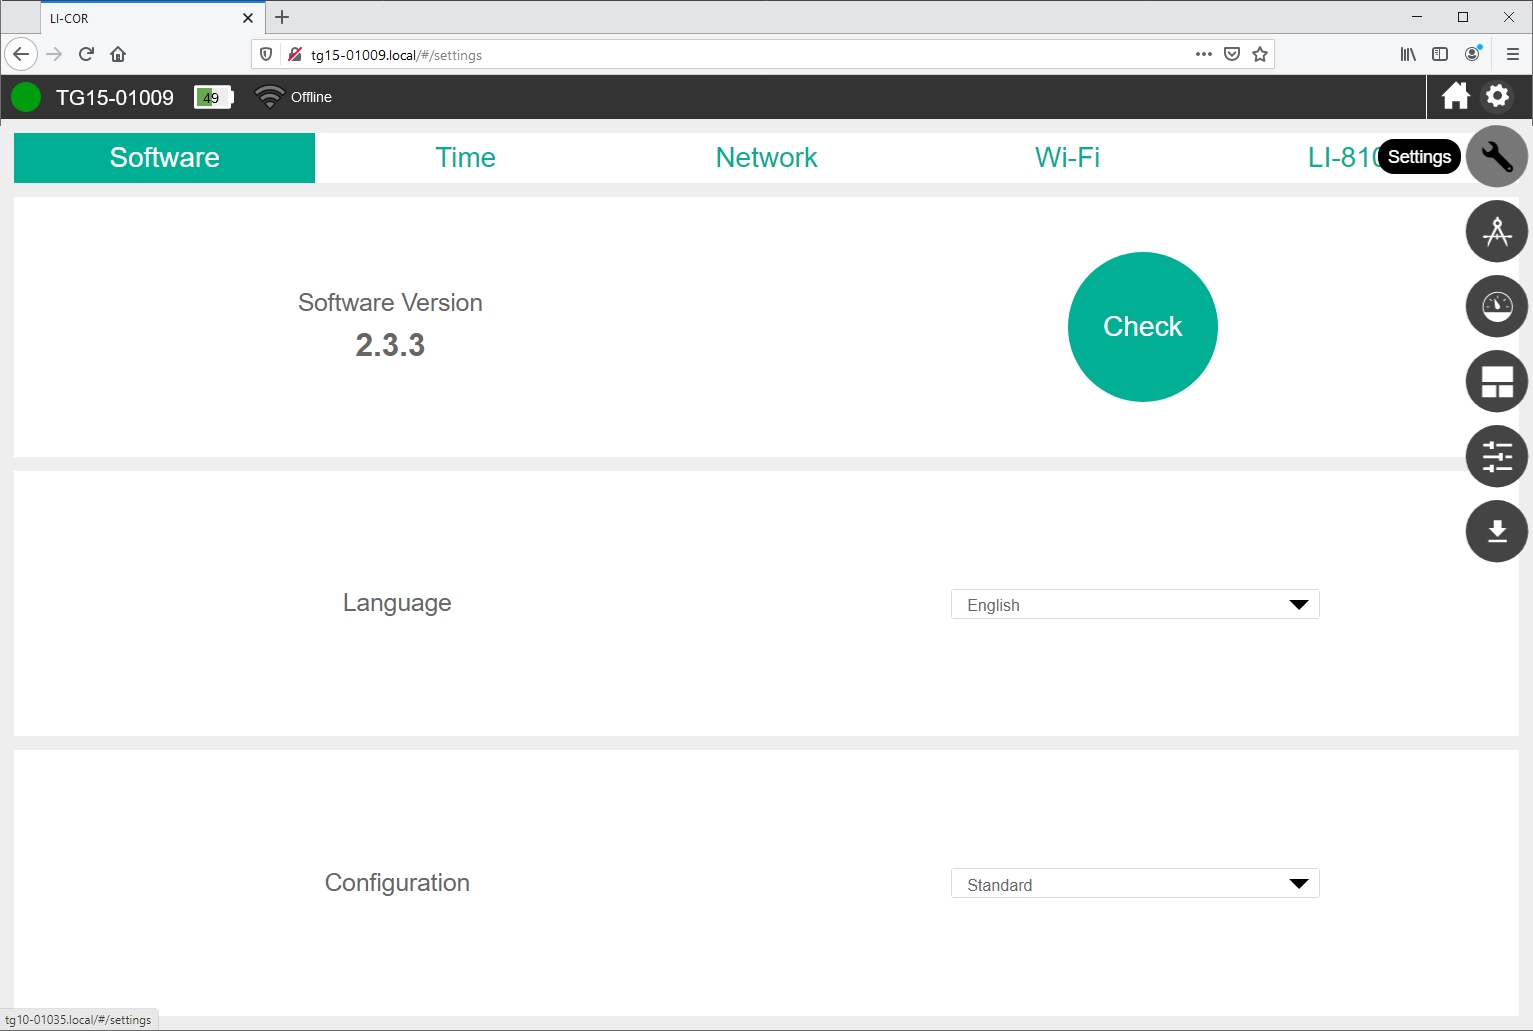
The Language setting is configured under software settings. The interface can be displayed in English, Spanish, and simplified Chinese languages. The language setting is retained in the web browser, not the instrument. If you connect with a different browser or different computer, or if you clear your browser cache, the default language setting will be applied (English).
The Configuration option provides two instrument configurations, described below. Note that the instrument must be restarted after changing the configuration. A third option - reduced flow rate - was removed from the interface with version 2.4 and newer. With this firmware, the option is automatically applied when instrument starts up and the reduced flow rate kit is installed. If there is no reduced flow rate kit, the instrument starts up in the standard mode.
- Standard: Nominal flow rate of 250 sccm; Operating pressure range of 70 to 100 kPa.
- High Altitude: Nominal flow rate of 150 sccm; Operating pressure range of 50 to 110 kPa. See High altitude.
Time
Under Settings > Time, you'll find two subtabs related to the time settings: Instrument Time and Time Zone.
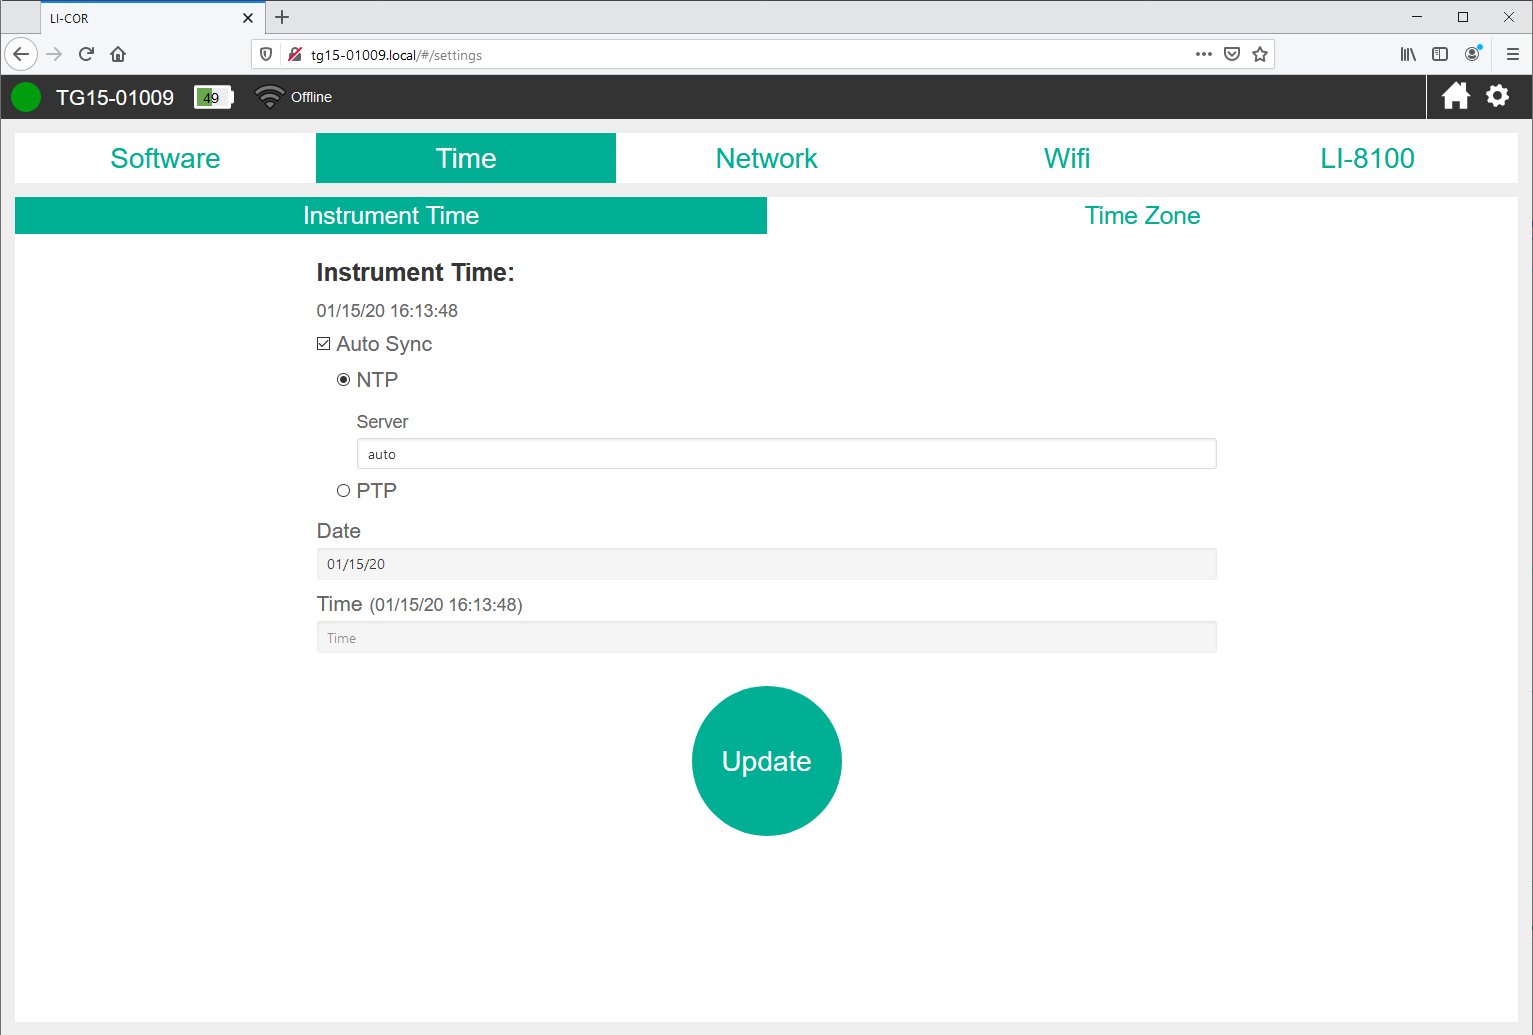
Instrument time
These settings specify how the device should set its time. See The relationship between Unix Epoch time and the time stamp for more details.
-
Auto Sync: We recommend using this setting at all times to prevent clock drift. When selected, the instrument will set its clock according to the local network time. When not selected, you must enter the desired time manually. The Auto Sync options are:
-
- NTP: Network Time Protocol. A time protocol designed for low-cost time synchronization between computers and devices. You can use the default settings of auto or select an NTP server, either from your network or the internet. A list of NIST time servers is available from https://tf.nist.gov/tf-cgi/servers.cgi.
- PTP: Precision Time Protocol. A network time protocol designed for high accuracy (microsecond to nanosecond) time synchronization between clocks.
-
Date: If Auto Sync is cleared, you can enter a date manually.
-
Time: If Auto Sync is cleared, you can enter the time manually.
When the instrument time setting is set to Auto Sync and the instrument is connected to the internet, it will maintain very accurate time, in sync with NTP or PTP clocks. If Auto Sync is disabled, or the instrument is not online, expect the clock to drift up to several seconds per month, or more.
Time zone
Here you can select a time zone that applies an offset to the Unix epoch time. If you change any of the time settings, click Update to apply the changes.
Note: We recommend standard time (do not adjust for daylight saving time). Arbitrary changes to the clock can cause data to have the appearance of gaps and overlaps.
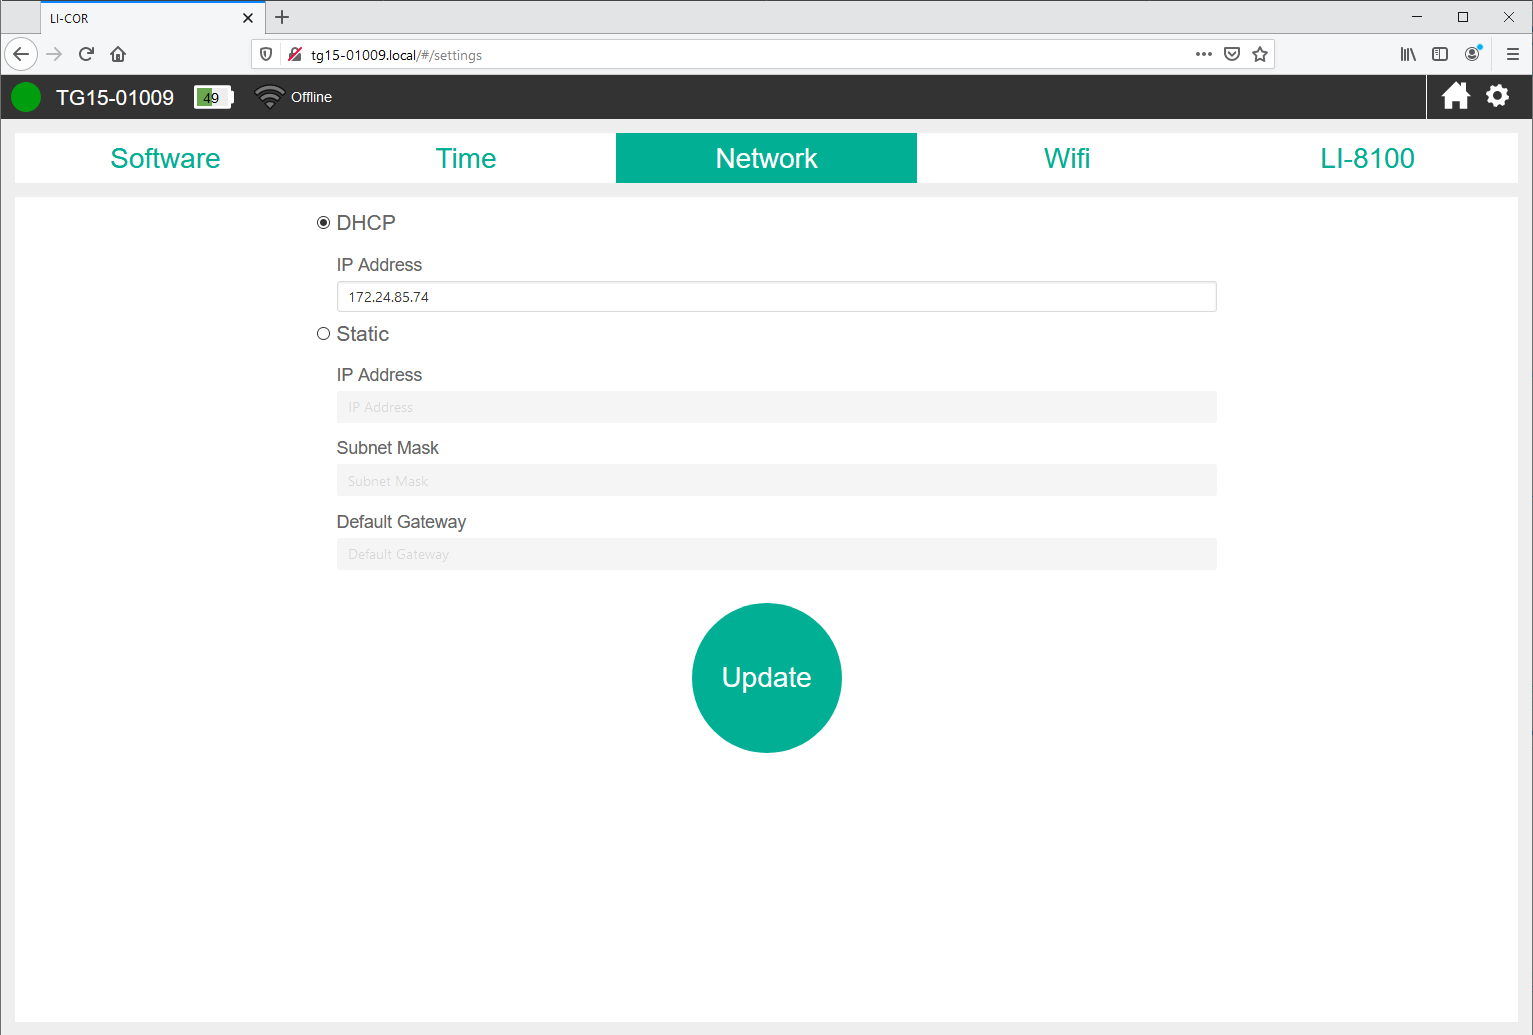
Network
Under Settings > Network, you configure the network settings. If you change the settings, click Update to apply them.
-
DHCP: Dynamic Host Configuration Protocol; This setting is suitable for most networks. When selected, the network assigns an IP address to the instrument.
- IP Address: The assigned IP address is displayed here (and on the instrument display).
-
Static: Used to set a static IP address. This setting is used when configuring the instrument to communicate over a cellular gateway, such as the Sierra Wireless RV-50X AirLink. When selected, you manage the networking manually by setting the IP address, subnet mask, and possibly the gateway.
- IP Address: Enter the desired IP address. For a local network, you will use something like 172.24.1.nn, where the values represented by nn are octets that uniquely identify this instrument on the network.
- Subnet Mask: Typically 255.255.255.0.
- Default Gateway: Set the first two octets to match those of the IP address.
Wi-Fi
Under Settings > Wi-Fi you can configure the wireless network settings, including whether the wireless network is on or off, and which channel it uses. You can always use the default setting, but if there are many devices using that channel, you may have better results with a channel that has fewer devices. If you have difficulty connecting, try changing the channel that the instrument uses.
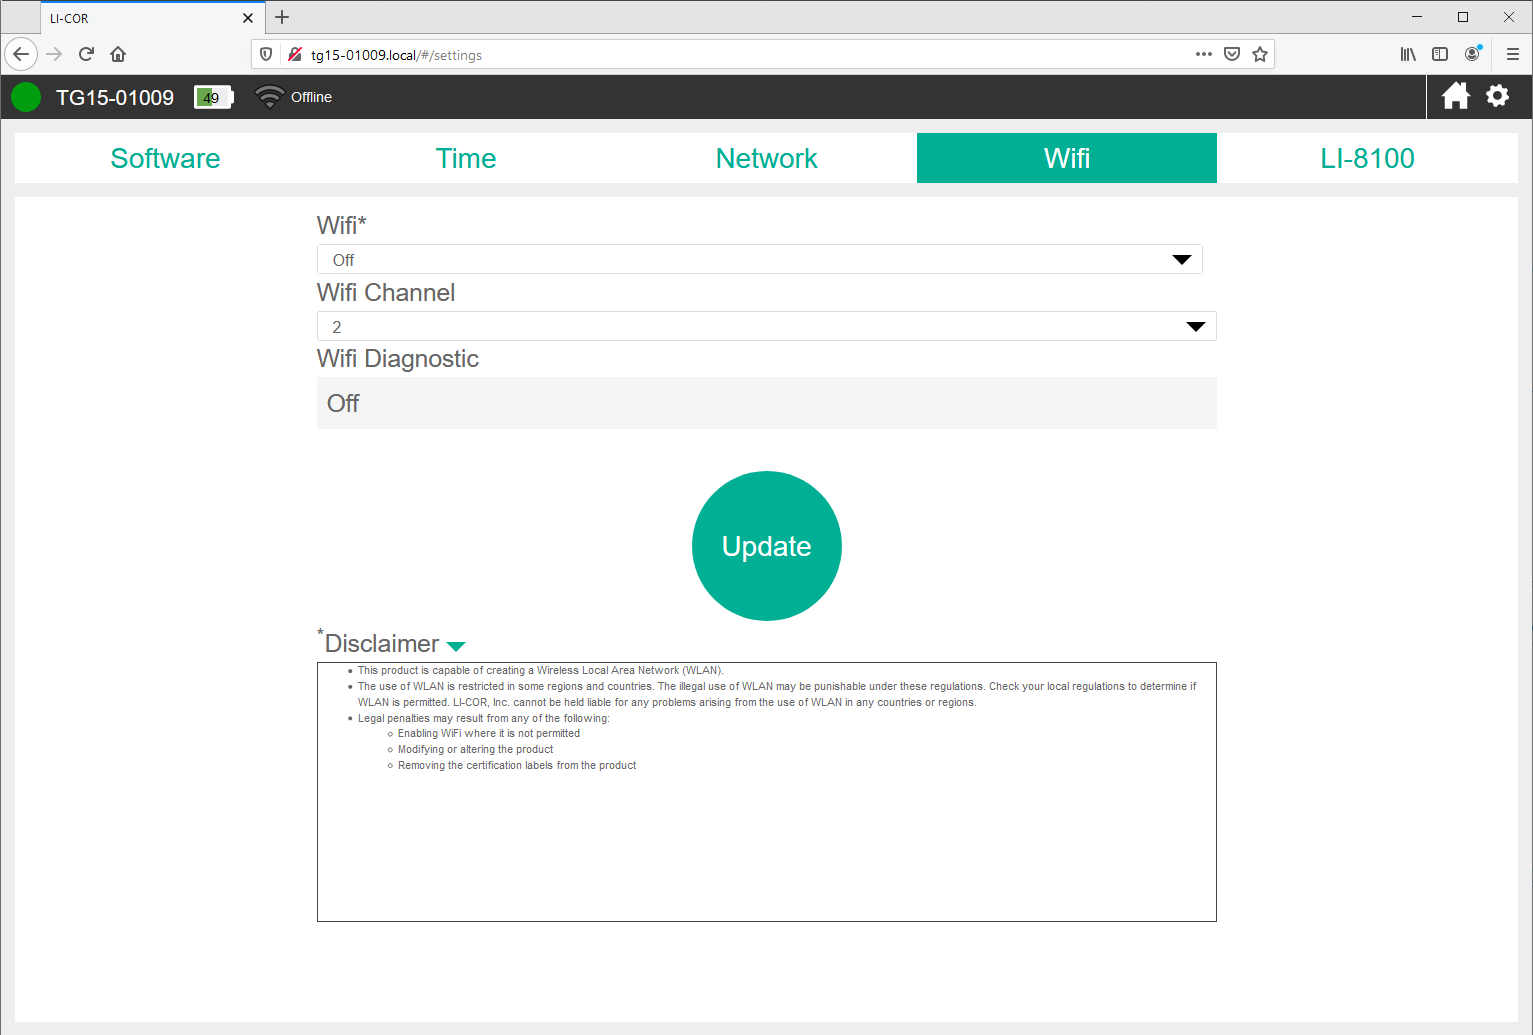
When Wi-Fi is on, the instrument will create a local network that is not connected to the global internet. You should see the network on the list of available networks. The network name is the same as the instrument serial number. If you change the settings, click Update to apply them. You can also choose a channel for communication over the wireless network. When there are many Wi-Fi networks available in one location, you can assign a specific channel for a more reliable connection.
LI-8100(A)
Under Settings > LI-8100 you configure communication with the LI-8100A instrument.
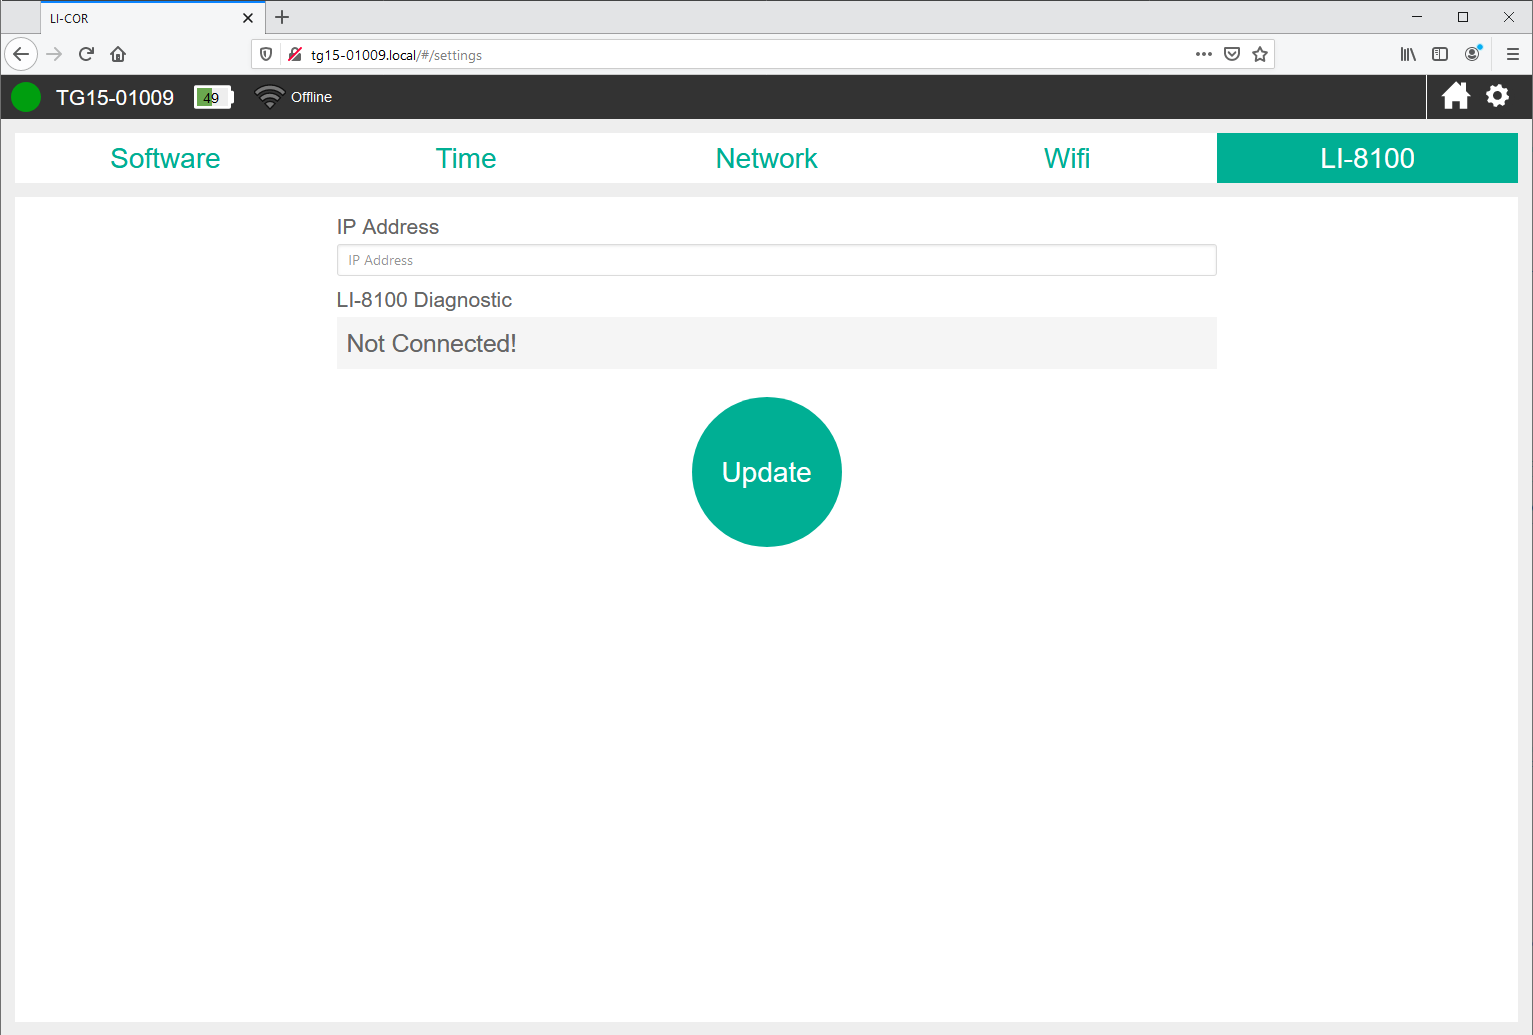
IP Address: To connect with an LI-8100A, enter the LI-8100A IP Address here. Additional details are provided in an application note: licor.com/support/LI-8100A/topics/LI-78xx-integration.html
Calibration
User calibration settings are configured under Options > Calibration.
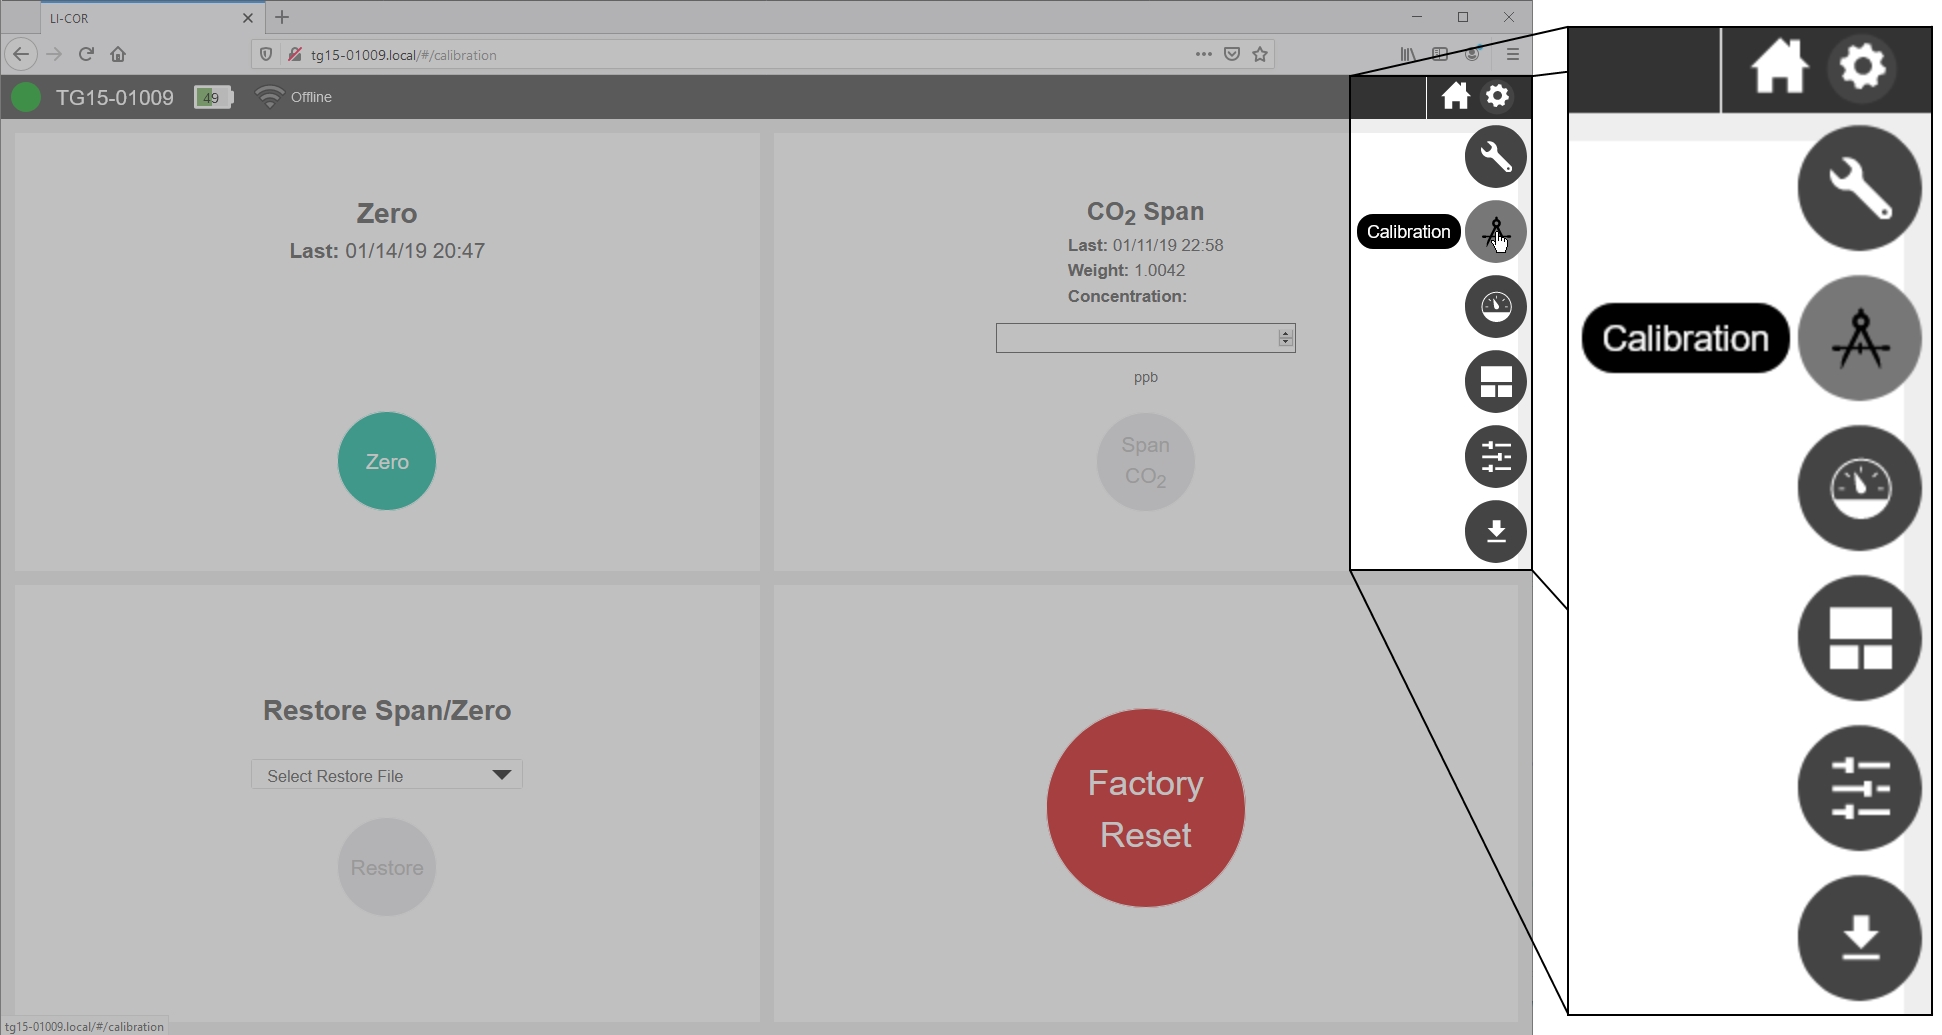
Zero gives the date of the most recent zero calibration. See Instrument calibration for details on the Zero button.
CO2 Span presents information about the previous span setting, including the date that the span was set (Last), the span value (Weight; the multiplier that is set when you span the CO2 measurement), and the CO2 Concentration (ppb) entered in the previous span. Do not change the settings unless you are certain that your actions will improve the performance of the instrument. See Instrument calibration.
Restore Span/Zero allows you select a previous zero and span setting.
Factory Reset reloads the factory original zero and span calibration parameters.
Diagnostics
The Diagnostics section provides instrument performance information, including the status, warnings, and diagnostic information.
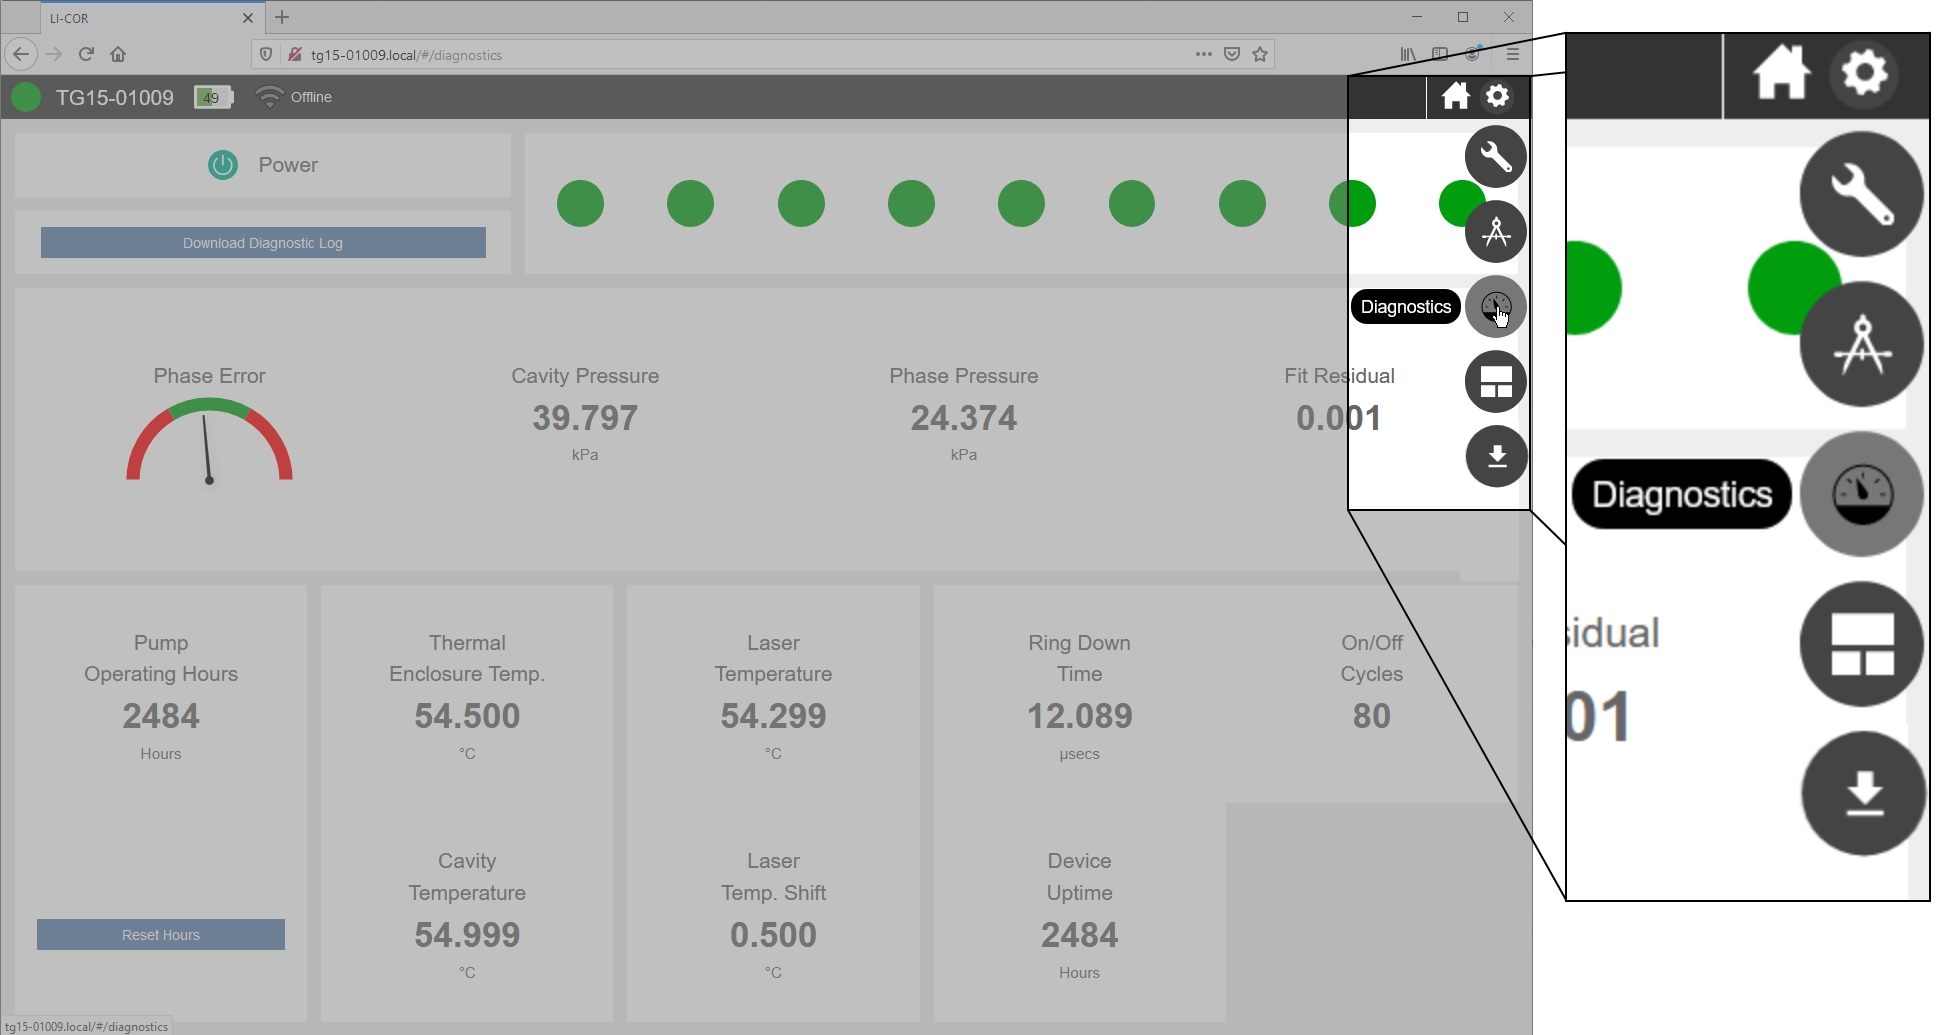
Power

In the upper left, the Power option allows you to power off or restart the instrument. The instrument cannot be powered on remotely.
Performance status indicators
In the upper right, nine bubbles provide more detailed status information. Normal operation is indicated by green bubbles. An exclamation point inside one or more bubbles indicates that the instrument is not in a normal operating state. Typically these are displayed when the instrument is warming up, and the status message will disappear when the warmup is completed. Click a bubble to view the status message. See Status codes for more information. If your instrument is displaying warnings that do not resolve themselves over the course of a few hours or by restarting, contact technical support.
Diagnostic log
Download Diagnostic Log is to download a dataset that includes detailed performance information. This option should be used in consultation with LI-COR technical support in order to resolve performance issues. Diagnostic log files can be very large, (hundreds of MB, depending on the time and date range), so we recommend that you constrain the dates to a narrow time window when downloading a diagnostic log.
Performance monitor
The central portion of the window provides more details about the instrument performance.
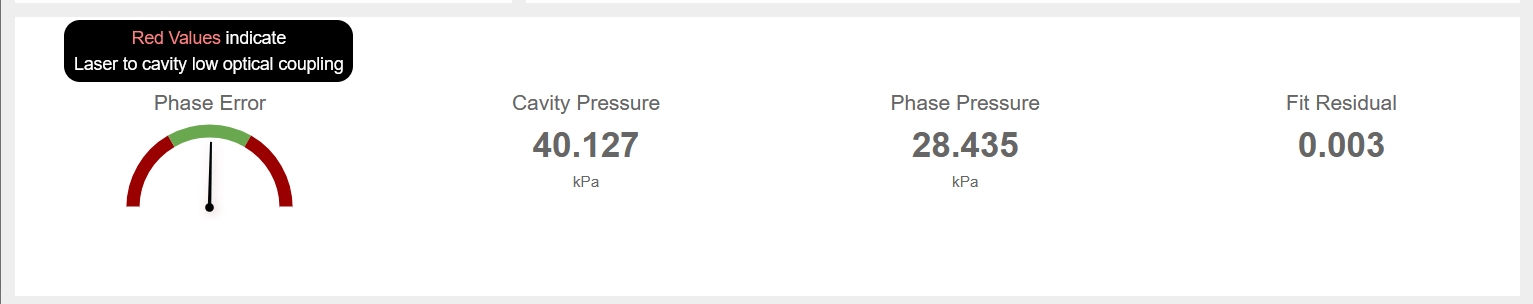
- Phase Error is an indicator of the symmetry of cavity modes. During normal operation the needle will be within the green part of the dial.
- Cavity Pressure is measured in the optical cavity. The instrument operates around 40 kPa typically. If the values are colored red, that indicates that the instrument is unable to regulate the cavity pressure. Normally this value is within 1 kPa of the setpoint.
- Phase Pressure refers to the pressure for the phase adjuster volume. If red, the instrument is unable to regulate the pressure to get optimal phase adjustment. Normally this value is within 1 kPa of phase pressure setpoint.
- Fit Residual is the difference between the raw spectra and the best fit spectra which generates the measured concentrations. If the residual is red, it indicates that the instrument is unable to process the data properly and that the concentrations are not being reported accurately. Data will be flagged in this case.
Operating information
The bottom portion of the window provides more details about the instrument operating history and status.
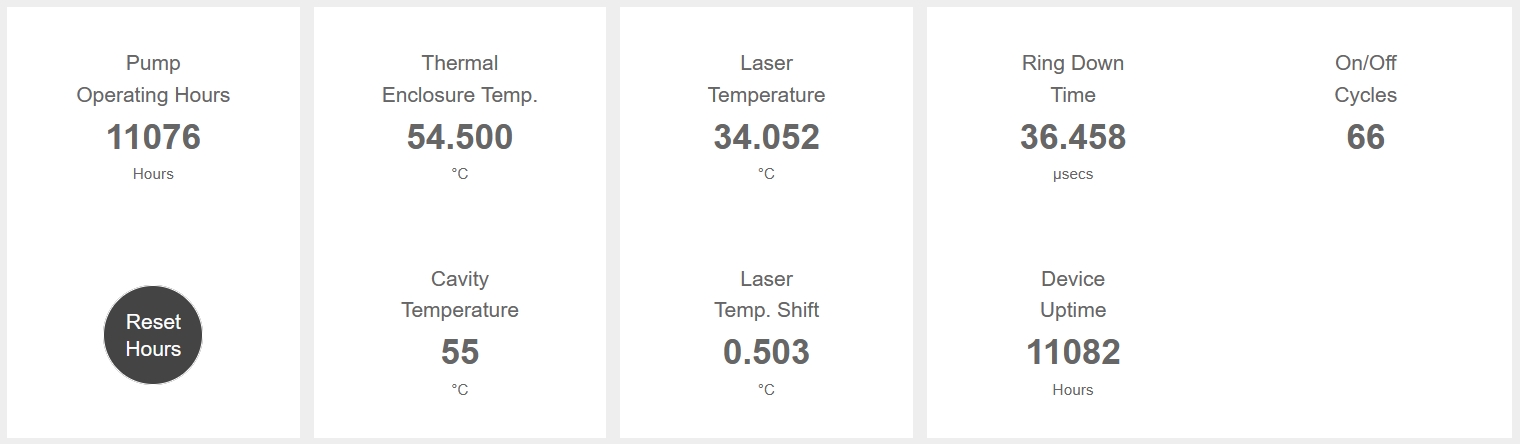
- Pump Operating Hours is the number of hours that the pump has operated.
- Thermal Enclosure Temp is the temperature of components inside the foam insulating enclosure. If red, the instrument is either too hot and unable to regulate the enclosure temperature, or too cold and in a warmup state. Normally this is between 51.5 °C and 57.5 °C.
- Cavity Temperature is the optical bench temperature. If red, the instrument is either too hot and unable to regulate the cavity temperature, or too cold and in a warmup state. Normally this is between 52 °C and 58 °C.
- Laser Temperature is the temperature of the diode laser. If red, the instrument is unable to regulate the laser temperature.
- Laser Temp. Shift is the shift in the laser center wavelength from the factory calibration.
- Ring Down Time is a parameter indicating cavity resonance.
- Device Uptime shows the number of hours that the instrument has been powered on.
- On/Off cycles is the number of times the instrument has been powered on.
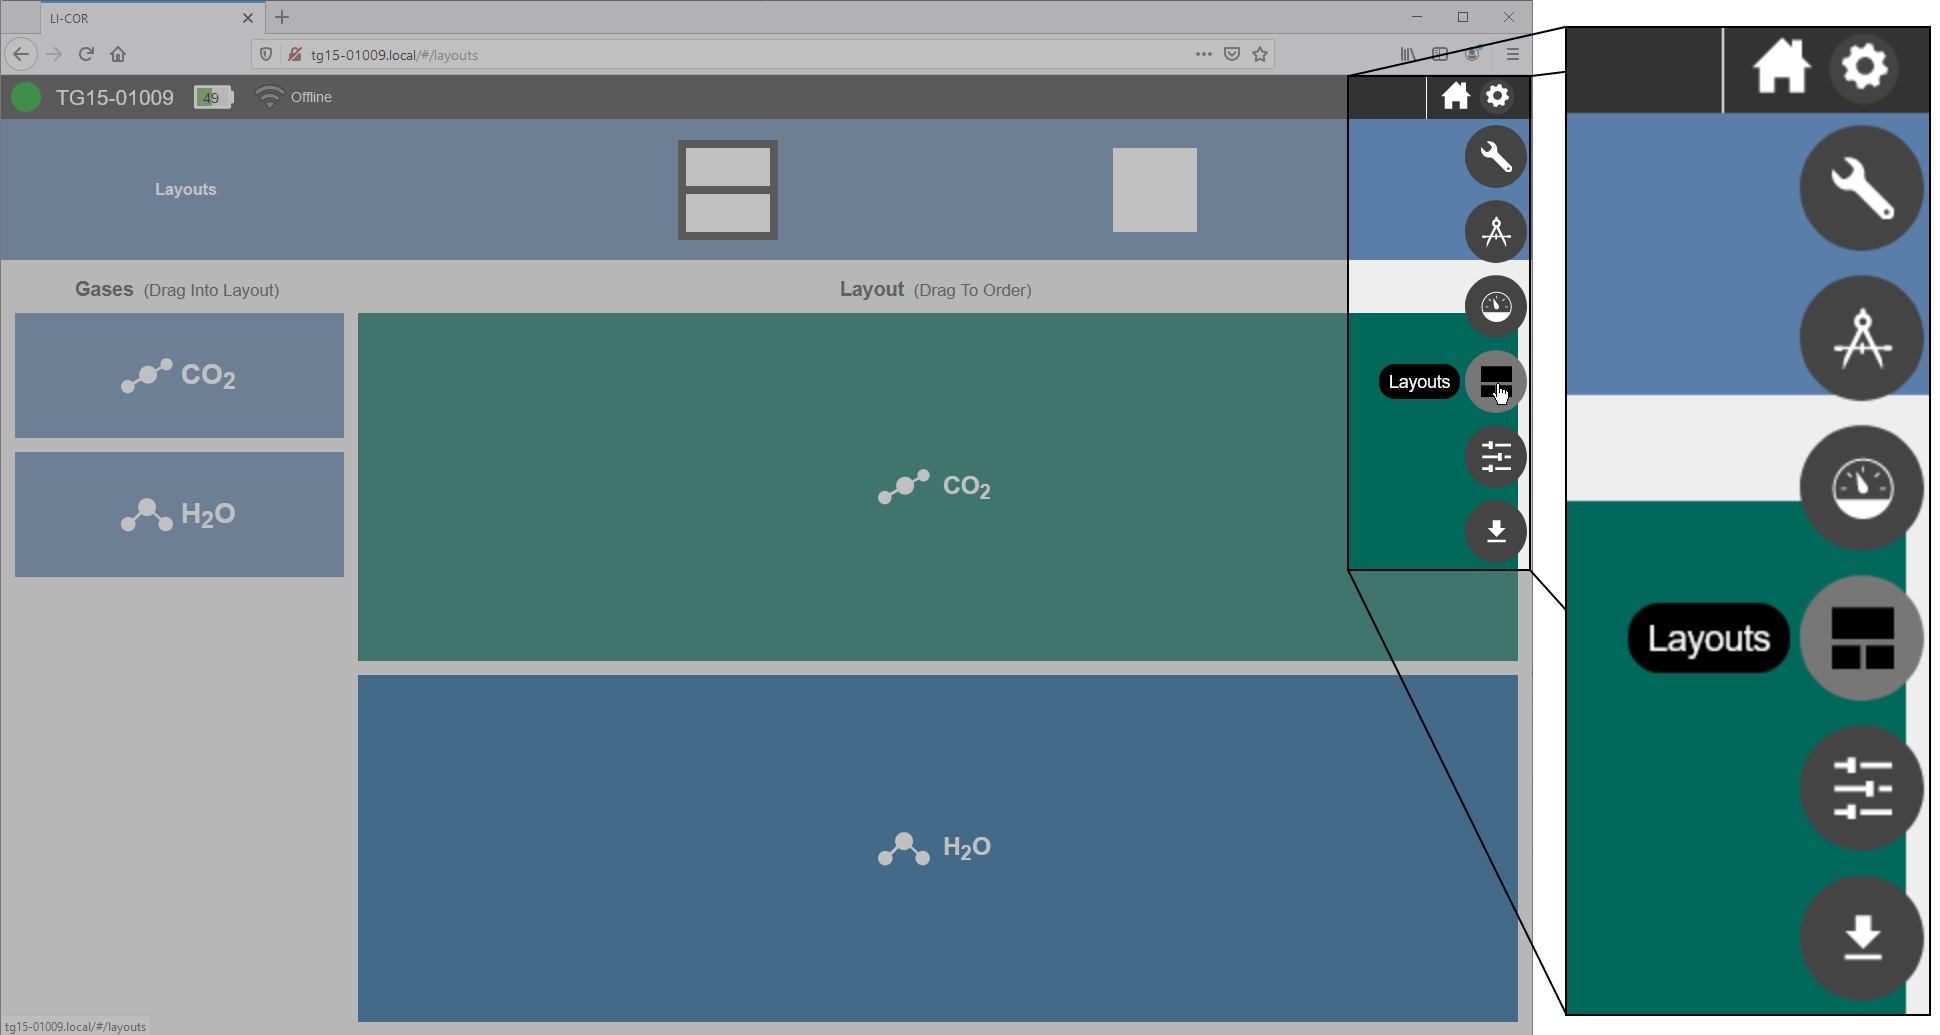
Layouts
You can customize the graphical layout. If, for example, you are only interested in viewing CO2 measurements, you can select a layout that displays one gas and then select the gas of interest.
Thresholds
The software provides simple, configurable indicators that show if a measured gas concentration falls outside a threshold. Color-coded indicators are displayed when measurements are outside the specified range. If you have set a Low Threshold or High Threshold for a gas, the home page will show if the measurement falls outside that range. Click Hide/Show Anomaly Stripes () to show excursions outside the specified range. You can change indicator colors as well. Thresholds are for display only; they are not recorded in the data file.
Export
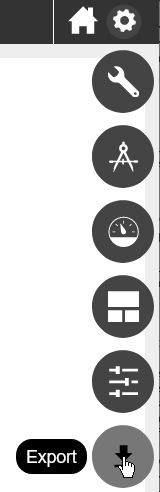
Data are downloaded from the instrument using the Download option under Options > Export. See Retrieving data from the instrument.