The Devices tab allows you to view and manage devices. When you first open the tab, you can see a list of active devices for your organization.
Don't see your devices? Be sure they are registered and configured properly.
-
To register an RX device, see Registering HOBO RX stations.
-
To register an MX device, see Registering HOBO MX data loggers.
-
To register an IoE Module for a Water Node or Carbon Node, see Registering LI-COR IoE modules.
View options
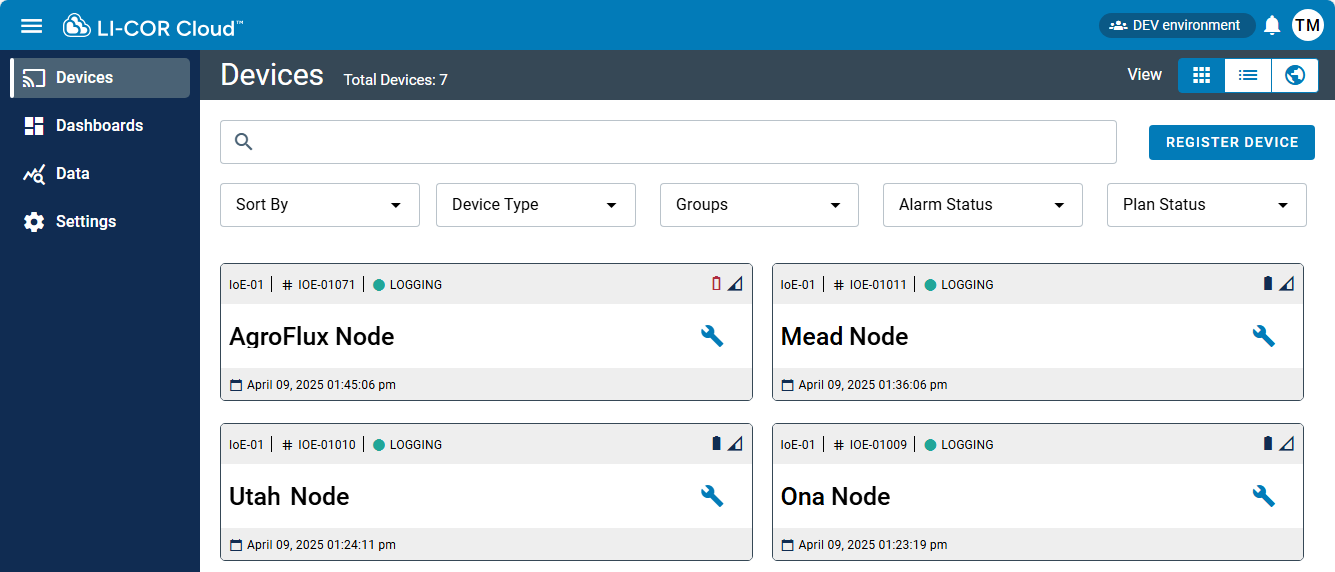
In the upper right corner of the display, you can use the View buttons to select from different view styles. Tile View presents devices in tidy tiles, with a color-coded tile for each device. List View presents a table of devices along with details. Map View presents a map with devices at their locations.
Tile view
Tiles display information about the device.
MX Gateways, RX stations, and IoE modules
The following information is presented for all devices, including IoE Modules, RX stations, and MX devices.
-
Device Name: The name assigned to the device is the most conspicuous information in a tile. If no name has been assigned, the serial number is displayed instead.
-
Device Type: The type of device, such as RX3000, MX1104, or IoE module.
-
Serial Number: The serial number reported by the device.
-
Date and Time: The date and time of the last device connection.
RX stations and IoE Modules only
RX stations and IoE modules present the following details.
-
Logging Status: The latest status of data storage reported by the device.
-
 Green indicates that logging is active.
 -
 Red indicates an issue.
-
-
Alarm Status: If an alarm has been triggered, it will be indicated.
-
 Battery or Power Status: The charge status of the device battery, or an indicator that the power is steady. A fully filled graphic indicates a charged battery. An empty, red outline indicates a missing or depleted battery.
 -
 Signal Strength: Wi-Fi or cellular signal strength. The tile does not display an icon for Ethernet stations.
 -
 Edit Button: Shows that you can change the device configuration.
MX data loggers only
MX data loggers report the upload method.
-
Upload Method: The upload method can be the HOBOconnect app or a gateway; depending on how the device is configured.
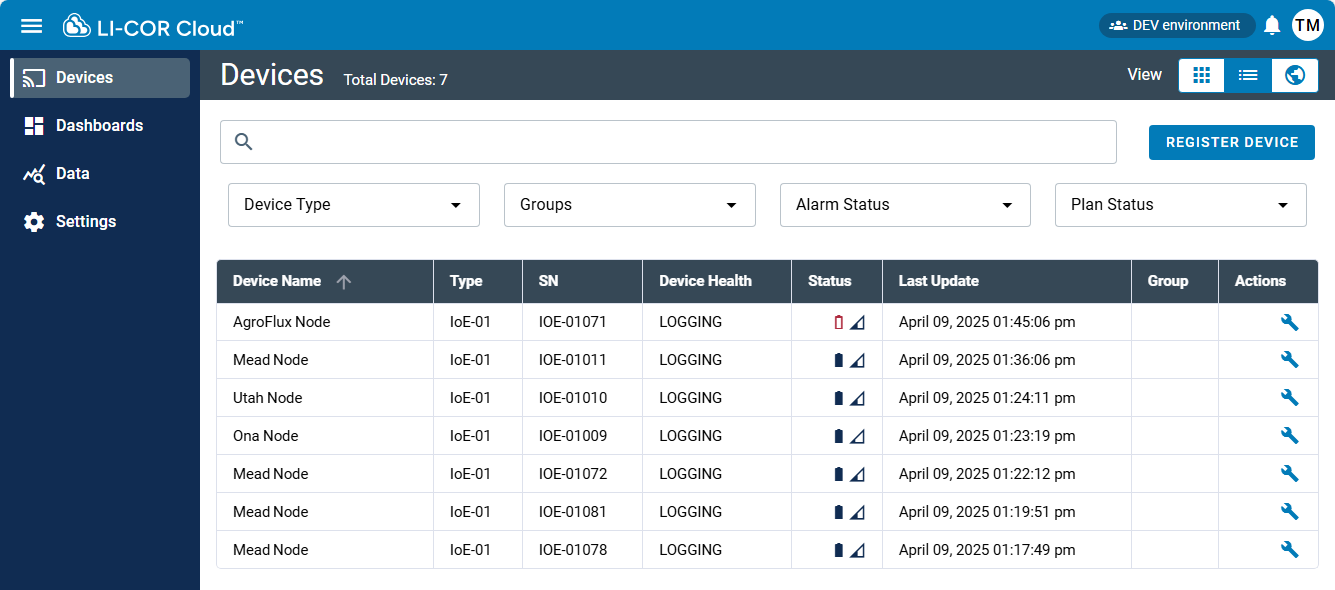
List view
Click List View to view a list of devices in a table. The information presented in list view is the same as that described in Tile view.
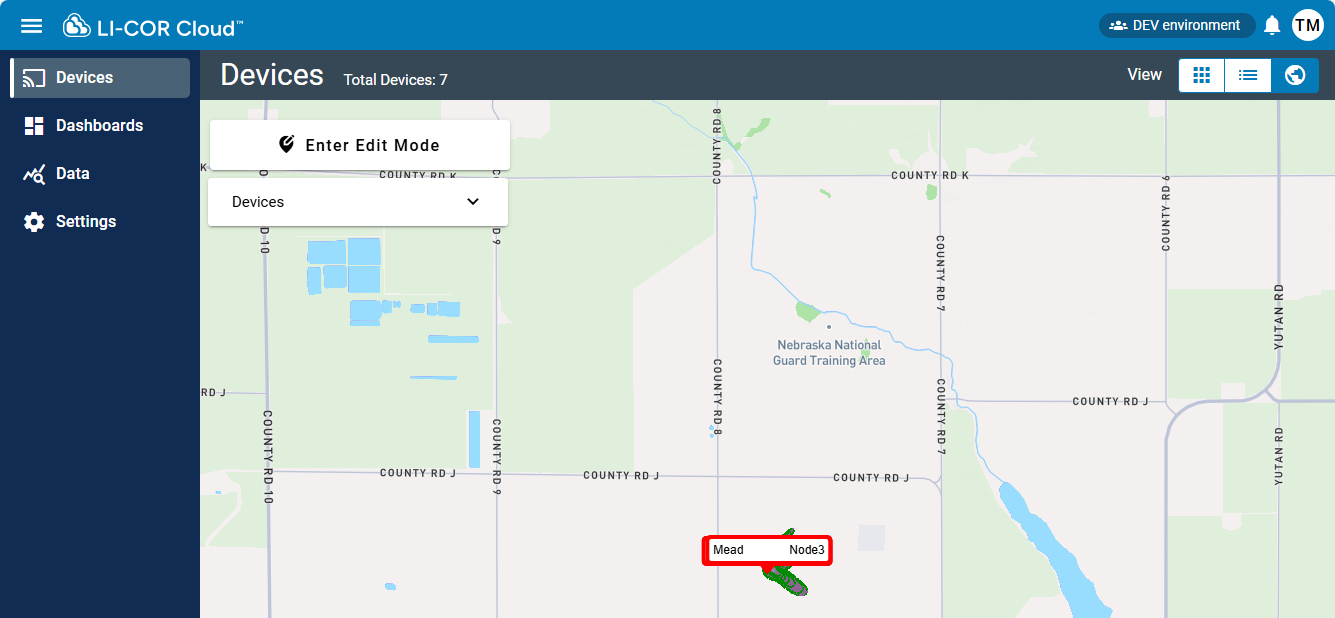
Map view
Click the Map View button to view your devices on a map. This view shows where your devices are currently located and allows you to view some of the details about those devices in a menu.
-
RX stations should be added to the map following the steps in Adding RX stations to the map.
-
MX data loggers can be added to the map manually.
-
LI-COR IoE Modules report location automatically and will be displayed on the map when they are registered.
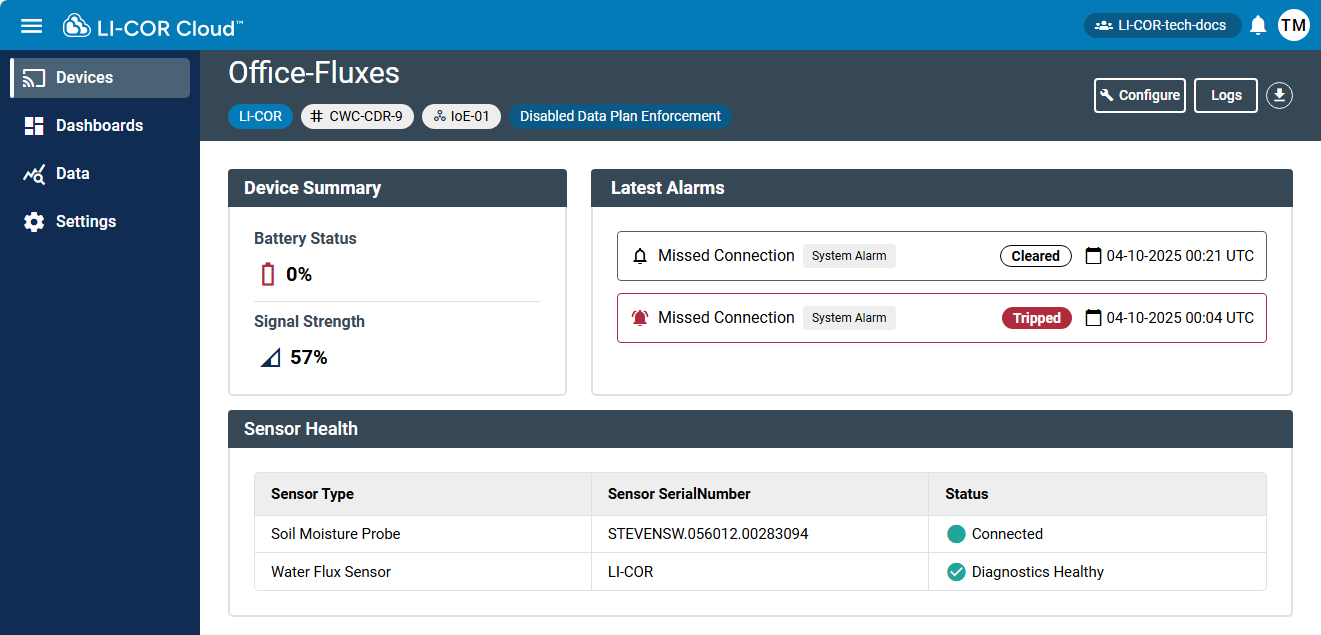
Device information
Click a device in the Dashboard to view the Device Information. This section shows this history of deployments, including the logger configurations for this device. Each deployment is marked by the configuration date and time, logger name, and date and time of the last data upload associated with this configuration.
For RX stations, the summary includes information about the device itself, including status information, groups, and data plan details (see RX station details).
For MX stations, the summary includes deployment history and measurements (see MX data logger details).
For Water Nodes and Carbon Nodes, the you can apply site settings and view other parameters (see Water Node (LI-710) and Carbon Node (LI-720) device details).
Alarms and notifications
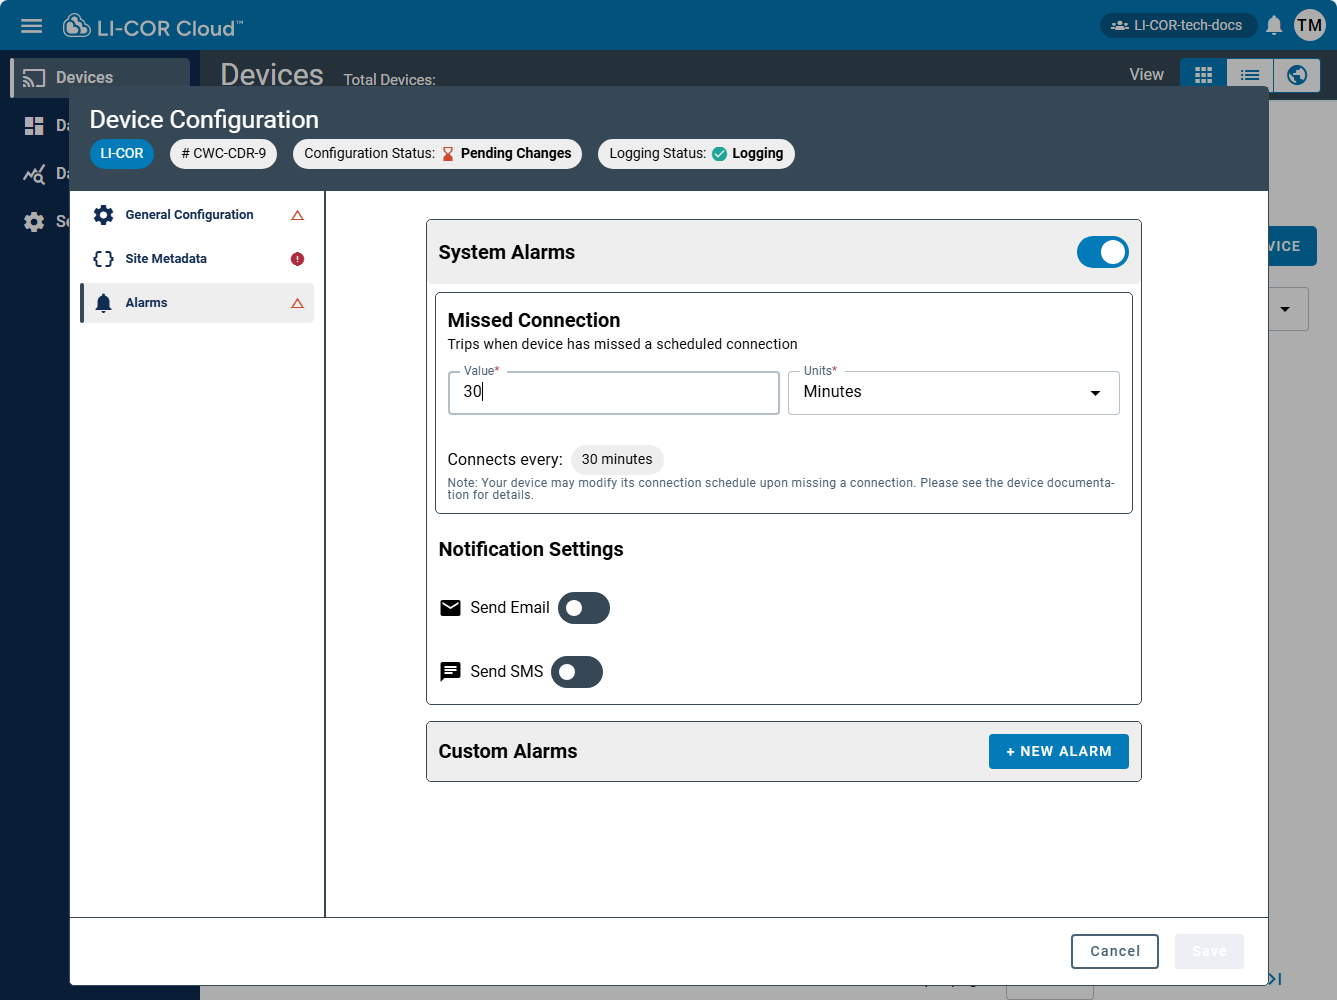
System alarms
System alarms are triggered by events, such as a missed device connection, low battery (station or sensor), or a sensor error.
| Field | Status | Description |
|---|---|---|
| System Alarms | Optional | Alarms appear in the LI-COR Cloud software and on your device. You can add Actions that are initiated when alarms are triggered. System alarms cover issues with the station or sensors including missed connections, low battery on a station or wireless sensors, and sensor failures. |
| Email Action | Optional | Select to use email to report alarm conditions. Enter one or more email addresses and select if you want an email when alarms clear. |
| SMS Action | Optional | Select to use SMS to report alarm conditions. Enter one or more phone numbers and select if you want a text message when alarms clear. |
Custom alarms
Custom alarms are configurable to be triggered if a measured value exceeds a threshold.
| Field | Status | Description |
|---|---|---|
| Alarm Nickname | Optional | Name the alarm something that will help you remember it. |
| Sensor | Required | Select the sensor you are creating this alarm for. |
| Value range | NA | Reports the range of possible values for this sensor. |
| Latest value | NA | Reports the latest logged value. |
| Condition | Required if you are setting an alarm. | Select above, below, or outside range. |
| Limits | Required if you are setting an alarm. | Specify the upper limit, lower limit, or both. |
| Logged Data Points | Required if you are setting an alarm. | Specify how many logged data points are outside the specified limit for the alarm to trip. |
| Actions | Optional | Select Email or SMS, as for other alarms. |
| Alert Content | Optional | Content of the alert when the alarm trips. |
Configuring alarms
To configure an alarm:
-
From Devices tab, select a station and click
 Configure >
  Alarms.
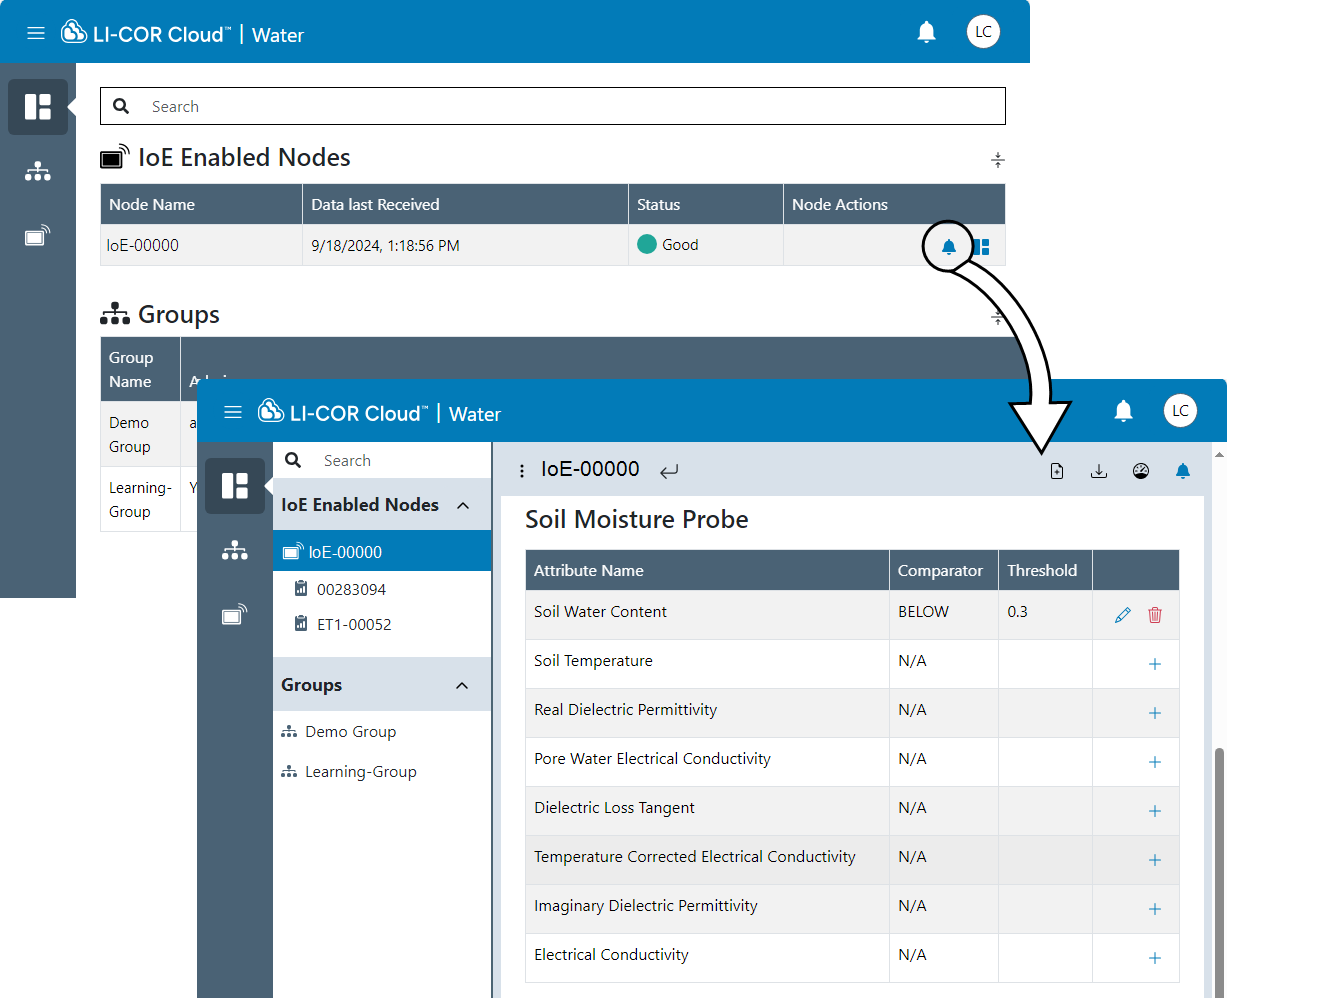
-
Activate system alarms and create custom alarms.
You can configure the timing of System Alarms and choose how to receive the notification (email or SMS), as well as the content of the notification. You can also choose to be notified when the alarm is cleared.
-
Or you can configure the parameters for custom alarms.
-
To add a custom alarm, click + NEW ALARM and then configure the settings.
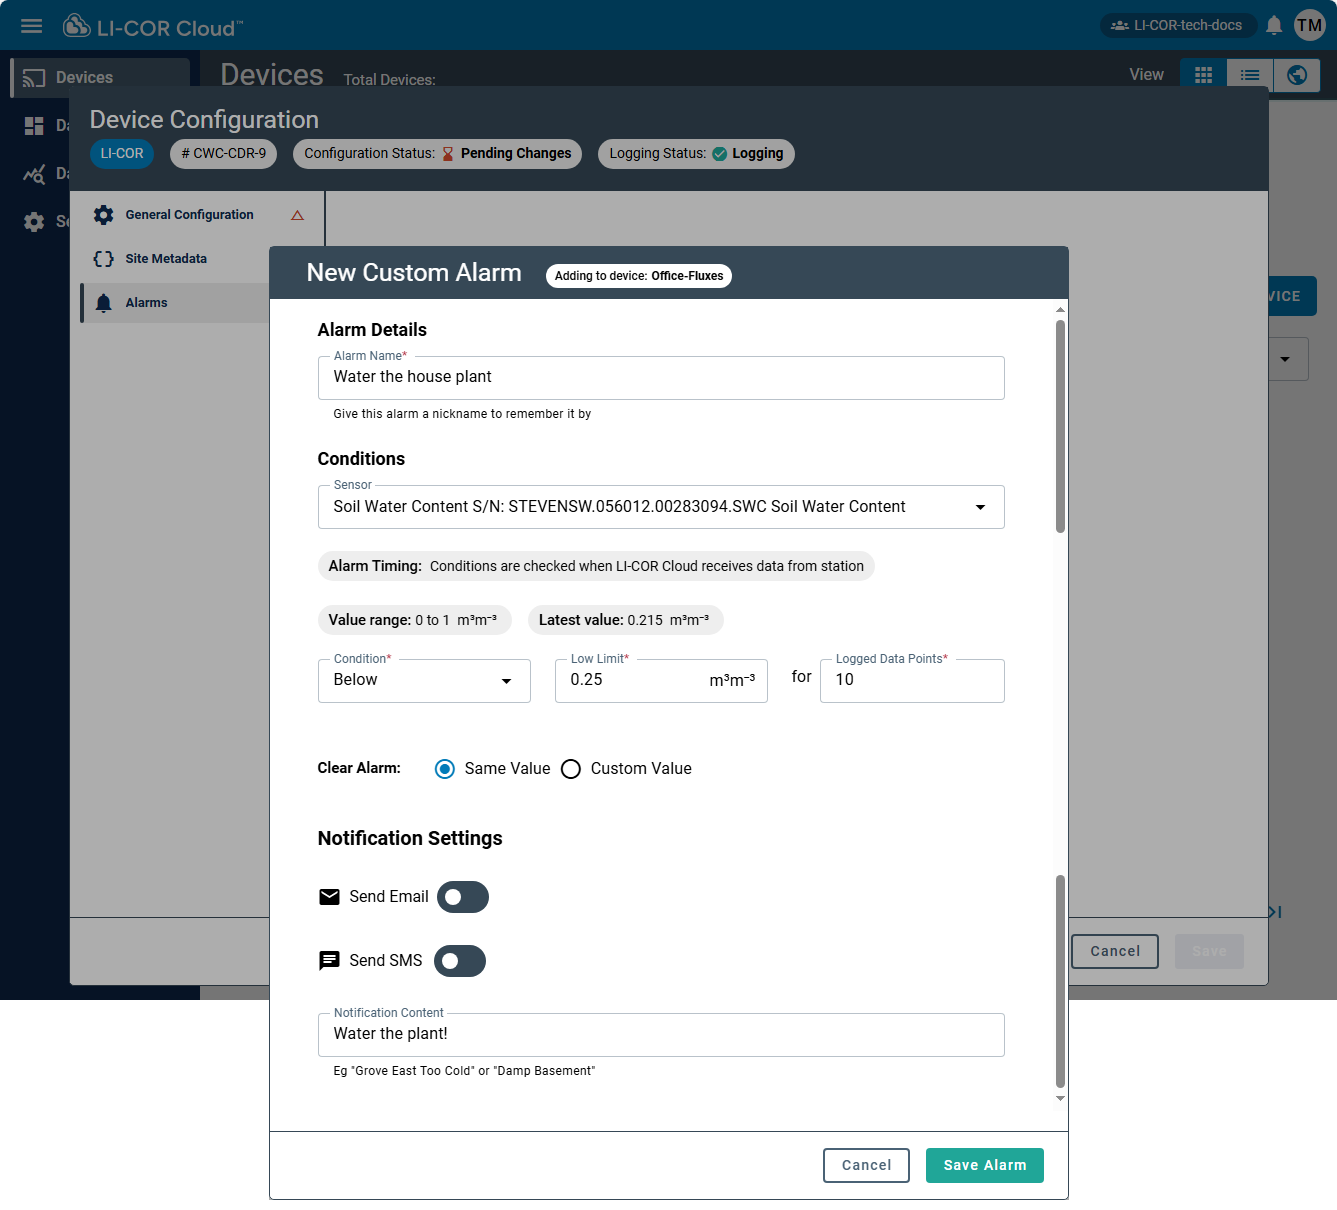
Some settings are required, including the name, condition, and limits.
- Conditions: Above, below, or outside range. For each option, you will also specify the threshold or range.
- Logged Data Points: The number of points out of range before the alarm is triggered.
Alarms for calculated measurements
See LI-COR for details about calculating new parameters from data. After creating the new parameter, you can create alarms for calculated measurements using the following fields.
| Field | Status | Description |
|---|---|---|
| Alarm Nickname | Required | Name the alarm something that will help you remember it. |
| Condition | Required | Select Above, Below, or Outside Range. |
| Limits | Required | Enter High, Low, or a Range of Limits, depending on what you selected in Condition. |
| Logged Data Points | Required | Specify how many logged data points are outside the specified limit for the alarm to trip. |
| Actions | Optional | Select Email or SMS, as for other alarms. |
| Alert Content | Optional | Content of the alert when the alarm trips. |
Viewing alarms
Select a Device to see alarms that have been tripped and cleared.
Notifications that have been configured (whether you subscribe or not) can be viewed by clicking the notifications button
![]()