


TGA data and groups
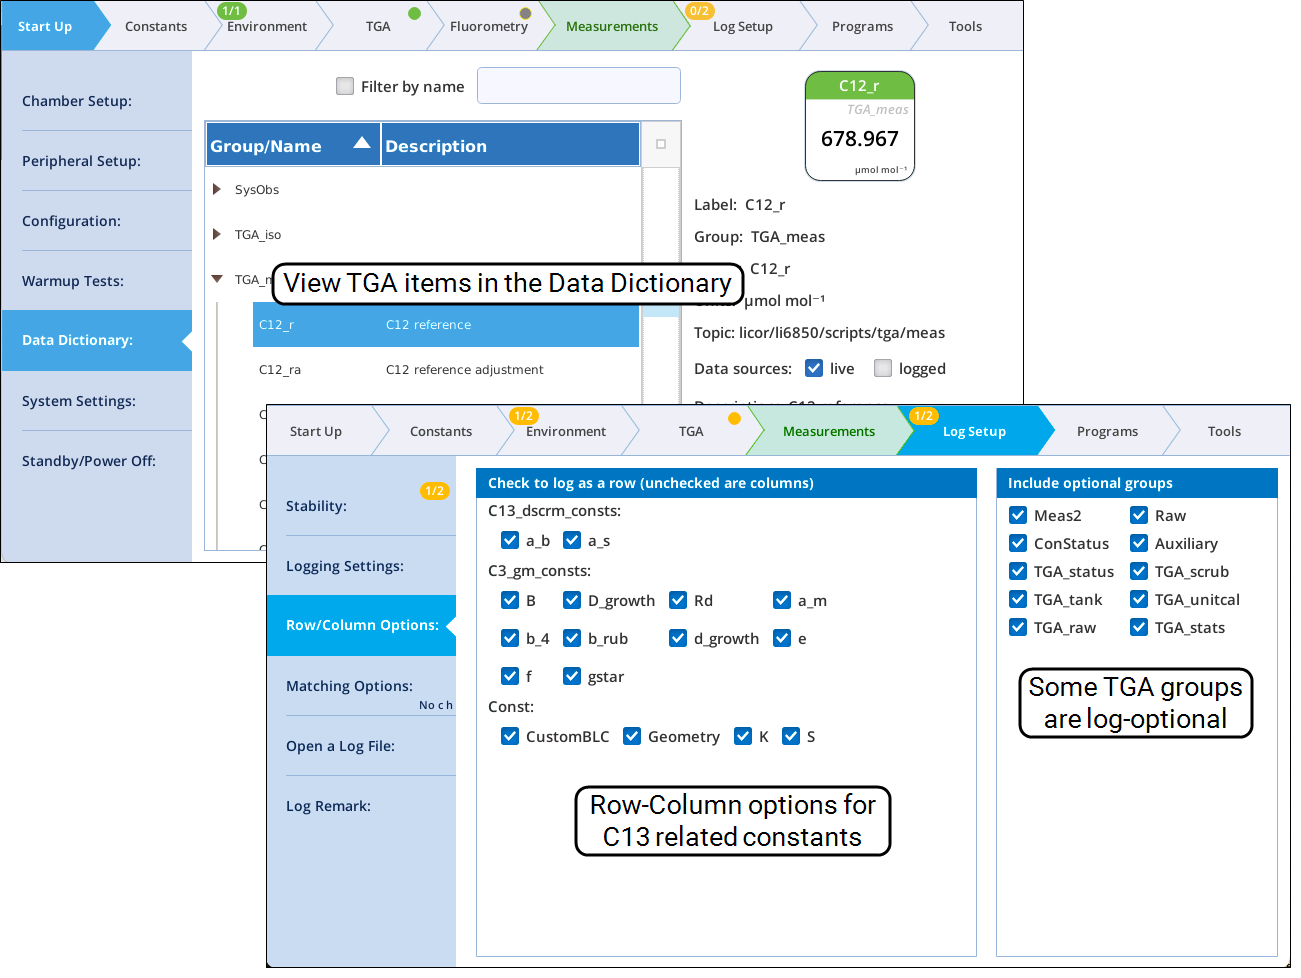
TGA support includes a number of LI-6800 data groups, which makes the data available for viewing, logging, graphing, etc.
| Group | Description | Logged? |
|---|---|---|
| C13_dscrm | The computed values that go into mesophyll conductance. See Group C13_dscrm (computations). | Yes |
| C13_dscrm_consts | The user input constants that go into mesophyll conductance See Group C13_dscrm_const (user constants). | Yes |
| C3_gm | The computed values that go into mesophyll conductance. See Group C3_gm (computations). | Yes |
| C3_gm constants | The user input constants that go into mesophyll conductance. See Group C3_gm_const (user constants). | Yes |
| TGA_iso | Isotopic cal summary info. See TGA_iso. | Yes |
| TGA_flux_xxx | Flux computations for xxx (where xxx = C12, C13, NH3, and so on, as selected by the user). See Trace gas flux equations. | Yes |
| TGA_meas | TGA_stats mean values partitioned into sample or reference, with isotopic calibration corrections. See TGA_stats. | Yes |
| TGA_raw | 1 Hz values incoming the TGA. See TGA_raw. | Optional |
| TGA_scrub | The settings of the TGA interface box (flow source, tank names, drier pump speed). See TGA_scrub. | Optional |
| TGA_stats | Selected values from TGA_raw, averaged with rates of change and standard deviations. See TGA_stats. | Optional |
| TGA_tank | Selected values from latest tank measurement. See TGA_tank. | Optional |
| TGA_unitcal | The current values of the calibration parameters available for the TGA. See TGA_unitcal. | Optional |
Computing C13 discrimination
Group C13_dscrm (computations)
| Label | Symbol | Eqn | Description | Units |
|---|---|---|---|---|
| ξ | ξ | 12‑20 | Cin / (Cin − Cout), equivalent dry CO2 | |
| R_ref | Rr | 12‑22 | Ratio of 13CO2 to 12CO2 in reference | |
| R_sam | Rs | 12‑23 | Ratio of 13CO2 to 12CO2 in sample | |
| ∆_a | ∆a | 12‑21 | Discrimination of air | ‰ |
| ∆_obs | ∆obs | 12‑19 | Measured leaf discrimination of 13CO2 | ‰ |
| CO2_sfc | Cf | 12‑14 | CO2 at leaf’s surface | µmol mol−1 |
| a_bar | a | 12‑13 | Weighted stomatal and boundary layer fractionation | ‰ |
| t | t | 12‑12 | Ternary correction coefficient |
Group C13_dscrm_const (user constants)
| Label | Symbol | Description | Units |
|---|---|---|---|
| a_s | as | Fractionation in air | ‰ |
| a_b | ab | Fractionation in boundary layer | ‰ |
Computing Mesophyll Conductance for C3 Plants
Group C3_gm (computations)
| Label | Symbol | Description | Units | Label |
|---|---|---|---|---|
| ∆_sim | ∆sim | 12‑27 | Discrimination for 13CO2 if gm infinite, simplified | ‰ |
| b’_3 | b′3 | 12‑16 | Carboxylation fractionation | ‰ |
| e* | e∗ | 12‑18 | Respiratory fractionation accounting for differing substrate | ‰ |
| e’ | e′ | 12‑17 | Total respiratory composition | ‰ |
| Γ* | Γ* | 12‑26 | CO2 photocompensation point, respiration in the absence of mitochondrial respiration | Pa |
| ∆_i | ∆i | 12‑24 | Discrimination if Cc equals Ci (i.e., gm is infinite) | ‰ |
| gm_Pa | gm(Pa) | 12‑10 | Mesophyll conductance | µmol m−2 s−1 Pa−1 |
| gm_bar | gm(bar) | gm(bar) = gm(Pa) / 10 | mol m−2 s−1 bar−1 |
Group C3_gm_const (user constants)
Equations
In the following equations, the symbols are defined in Table 12‑7, Table 12‑8, and Table 12‑9. The equations are based on Busch et al. (2020)[3], Ubierna et al. (2018)[4], and Evans et al. (1986)[5].
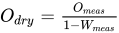
Mesophyll conductance is from Ubierna [4] (equation 43 in the publication):
where
12‑11


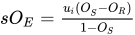
The ternary correction coefficient t is from Ubierna [4]; (equations 9 and 10 in the publication):

Leaf surface CO2 concentration Cf is
12‑15

Carboxylation fractionation b′3 is from Ubierna [4] (equation 25 in the publication)

Respiratory fractionation follows Ubierna [4] (equation 29 in the publication)
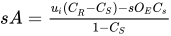
and Busch [20]

The observed discrimination of 13CO2 is from Evans [5] (equation A11 in the publication)

where


Discrimination Δi with infinite gm comes from Ibierna [4] (equation 41 in the publication)
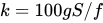
where


A simplified formulation for discrimination in C3 species of 13CO2 is given by Ubierna [4] (equation 22 in the publication)

Computing trace gas fluxes
Flux computations are enabled on the Computations page (see The Computations page).
Flux groups
Each flux computation selected has its own group with three entries. For example, if computing C13 flux, there will be a TGA_C13_flux group containing C13_s_dil, C13_r_dil, and C13_flux.
In the table below xxx = the gas selected for flux computations. If xxx = C12, C13, O18, or O17, the units are as shown in the table. If xxx = NH3, the concentration units are nmol mol−1 and flux units are nmol m−2 s−1.
| Label | Symbol | Eqn | Description | Units |
|---|---|---|---|---|
| xxx_flux | F | 12‑28 | Flux of xxx | µmol m−2 s−1 |
| xxx_s_dil | Xds | 12‑29 | xxx sample, corrected for CO2 dilution and cross sensitivity | µmol mol−1 |
| xxx_r_dil | Xdr | 12‑30 | xxx reference, corrected for CO2 dilution and cross sensitivity | µmol mol−1 |
Trace gas flux equations
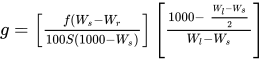
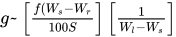
Flux F of trace gas X from the leaf is given by

where Xds and Xdr are concentrations of X as reported by the TGA for sample and reference flows that have been corrected (the d subscript) for the background concentration of CO2 (below). f is flow through the chamber in μmol s−1, Ws is H2O mole fraction in the chamber as measured by the LI-6850 in mmol mol−1, and s is leaf area in cm2.
The diluting effects of CO2 on the trace gas is computed by
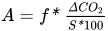
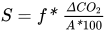
where Xs and Xr are the sample and reference concentrations reported from the TGA_meas group (e.g., C13_c and C13_rc, or NH3_s and NH3_r). Sx is a cross sensitivity factor for CO2 on gas X, and is always 0 as of this writing.
TGA_iso
The TGA_iso group (Table 12‑10) contains a brief summary of the current isotopic calibration (Isotopic calibrations).
TGA_meas
The TGA_meas group (Table 12‑11) uses the TGA_stats group (Table 12‑14) for input, and adds two factors: a sample/reference designation (depending on the state of the match valve), and corrections from the isotopic calibration (Isotopic calibration details).
The label extensions _s and _r (e.g. CO2_s) denotes whether the TGA was seeing air that has passed through the leaf chamber (normal mode), or air that has bypassed the leaf chamber (match mode).
The Isotopic Calibration is applied to the C13, O18, and O17 measurements based on the concentration of C12. The subscript extension _c denotes a corrected value (e.g. C13_sc is a corrected sample value), and the subscript extension _a indicates the correction’s value. Thus
C13_sc = C13_s + C13_sa
Note: If there is no isotopic background calibration in place, then neither corrections nor corrected values are computed for C12, C13, O18, and O17.
The corrected per mille values (e.g. δC13_sc) are computed from the corrected concentrations (e.g. C13_sc)
12‑31
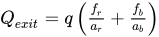
12‑32

12‑33

TGA_raw
LI-COR TGAs output concentration data at 1 Hz. The LI-6850 captures this and packages it into a data group named TGA_raw (Table 12‑12 shows this for the LI-7825). Note that the per mille values are relabeled from what the TGA outputs.
While the LI-6800 is communicating with the TGA, it maintains a daily log of TGA_raw records, updated at 5 minute intervals, in folder named for the TGA serial number:
/home/licor/logs/tga/raw/<serial>
The files are named by month-day-year (e.g. 2025-04-30.txt). Selected contents of these time series can be viewed on the console (View daily log).
TGA_scrub
The TGA_scrub group (Table 12‑13) captures some of the settings on the TGA Source & Cal page.
TGA_stats
The TGA_stats group (Table 12‑14) uses the gas concentrations from the TGA_raw group as input, and adds an item named period, which is the (user-settable) time period over which the running stats (mean, standard deviation, and rate of change) for that record were computed. The update frequency is driven by the 1 Hz TGA_raw output frequency.
TGA_status
The TGA_status group (Table 12‑15) represents much of the information on the right of the TGA Status screen.
| Display Label | Example Value | Description |
|---|---|---|
| Active | true | Are data being received? |
| Battery | 49 | Capacity (%). 100% = two fully charged batteries |
| CommCode | 0 | Comm error code. Codes show in Table 12‑1 |
| Flow to TGA | 360.7 | Flow_s corrected for its Sample Cell Cal |
| H2O | 7.31 | TGA H2O, 30 minute average (mmol mol-1) |
| H2O trend | 0.44 | 10 minute trend in H2O (mmol mol-1 hr-1) |
| Model | LI-7825 | TGA model in use |
| PowerSRC | 1 | 0 = Battery; 1 = Main Power |
| Received | 510 | Incoming packet count |
| S/N | TG25-01057 | TGA serial number used |
| Stable | true | Are stability criteria met? |
| Tank Active | false | Is scrub box source a tank or not? (as in, not the LI-6850) |
TGA_tank
The TGA_tank group captures a subset of what is in the most recent Tank Measurement (TM) file. This group is optionally included in logged data files.
| Display Label | Example Value | Description |
|---|---|---|
| ID | TM0244 | Identifier |
| Timestamp | 2025-09-20 16:43:56 | Time of measurement |
| CO2 | 1000 | Tank value (µmol mol-1) |
| Diff CO2 | -0.4 | Measured - Tank (µmol mol-1) |
| δC13 | -29.7 | Tank value (‰) |
| Diff δC13 | 0.12 | Measured - Tank (‰) |
| δO18 | -12.1 | Tank value (‰) |
| Diff δdO18 | -0.12 | Measured - Tank (‰) |
| δO17 | -3.5 | Tank value (‰) |
| Diff δdO17 | -0.06 | Measured - Tank (‰) |
| C12 | 984.3714 | Tank value (µmol mol-1) |
| Diff C12 | -0.37485 | Measured - Tank (µmol mol-1) |
| C13 | 10.733 | Tank value (µmol mol-1) |
| Diff C13 | -0.0027 | Measured - Tank (µmol mol-1) |
| O18 | 4.0617 | Tank value (µmol mol-1) |
| Diff O18 | -0.00204 | Measured - Tank (µmol mol-1) |
| O17 | 0.7751 | Tank value (µmol mol-1) |
| Diff O17 | -0.00031 | Measured - Tank (µmol mol-1) |
TGA_unitcal
The TGA_unitcal group (Table 12‑17) summarizes the current state of the TGA’s calibration.