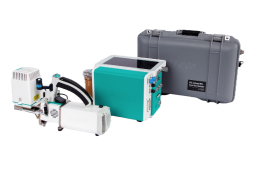
Elements of the interface
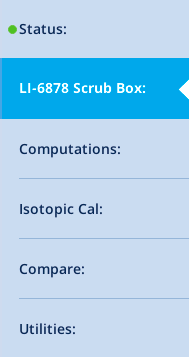
When TGA support is enabled (Figure 12‑9), tapping the TGA tab will display the main TGA tabs down the left side of the screen. Figure 12‑11 gives a brief description of each.
| Tank indicator when the source of air to the TGA is a tank. | TGA status. Reasons for warnings (yellow or red) are displayed under the Status tab. |

|
|
|
|
|
|
|
The Status page
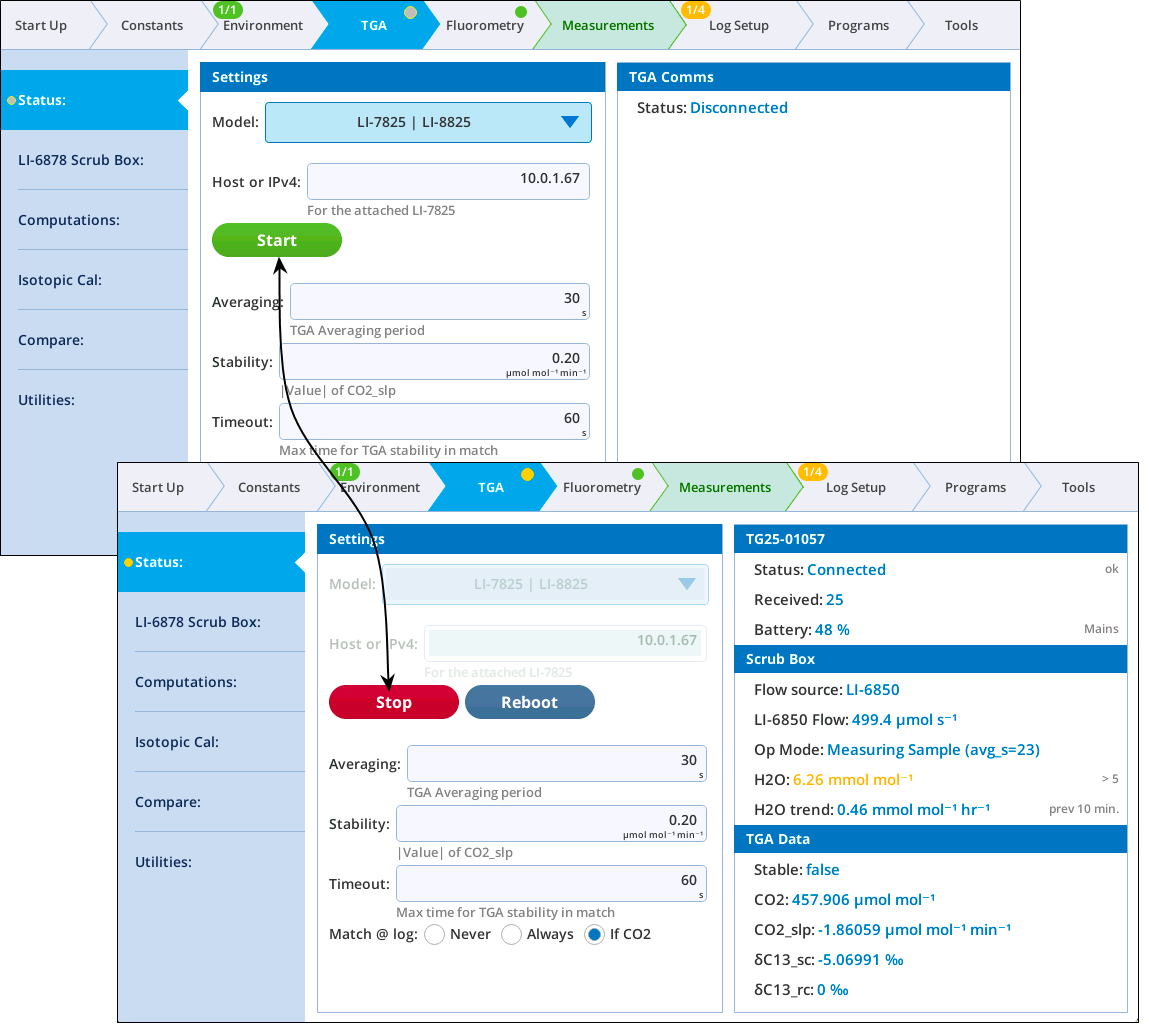
The Status Page (Figure 12‑12) serves as a high-level dashboard for the TGA. It is where you start/stop communications, view some basic measurement variables, set stability criteria, and monitor the state of the TGA interface box air stream drying.
-
To connect with a TGA, see Communication control.
-
For a summary of options below the Start/Stop button, see TGA stability and matching.
-
Scrub box properties are described in Scrub box values.
-
TGA Data is described in Incoming TGA data groups.
Communication control
To begin communication with a TGA, enter the host or IPv4 address in the edit box and tap the Start button. Once communication is established with the TGA, an incoming packet count (which should increment at 1 Hz) and serial number will be shown on the upper right.
Tapping Stop will disconnect from the TGA.
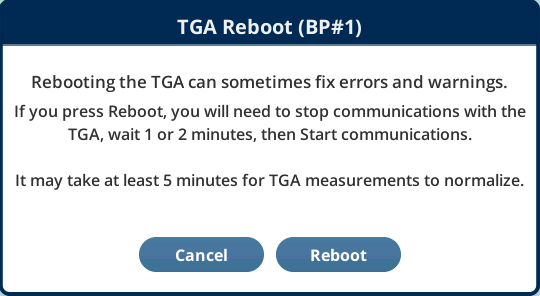
The Reboot button will reboot the TGA (after the prompt shown below). This can become necessary if the TGA experiences a large abrupt shift in bulk air constituents (O2, N2, etc.) when switching to or from tank air. This can cause loss of linelock, and require a reboot. See Low oxygen experiment for a way to avoid this problem.
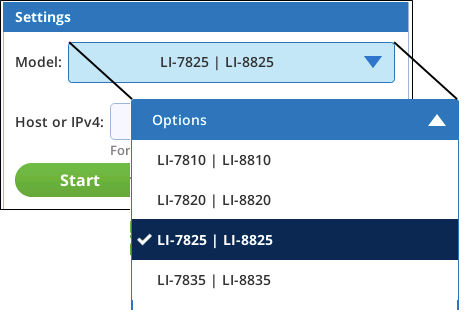
It does not matter how the Model menu is set when you tap Start: the software determines what model is being communicated with and configures itself accordingly. When communication is not active, however, setting Model will configure the interface for that model type. For example, the computations available on the Computations page depend on the model, and the Isotopic Cal page is essentially disabled for models besides the LI-7825 / LI-8825.
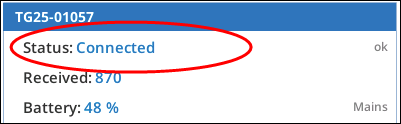
Status shows the state of the TGA connection. If there are any diagnostic flags set on the TGA, they are shown in the Status line. There are numeric codes associated with each, described in Table 12‑1 and Figure 12‑13.
| Label | Code | Meaning |
|---|---|---|
| Connecting | -3 | Attempting to Connect |
| Not Found | -2 | Host or IPv4 not found |
| Disconnected | -1 | Disconnected |
| Connected | 0 | OK. Connected and DIAG = 0 |
| Warning: or Error | >0 | DIAG value. See Figure 12‑13 |
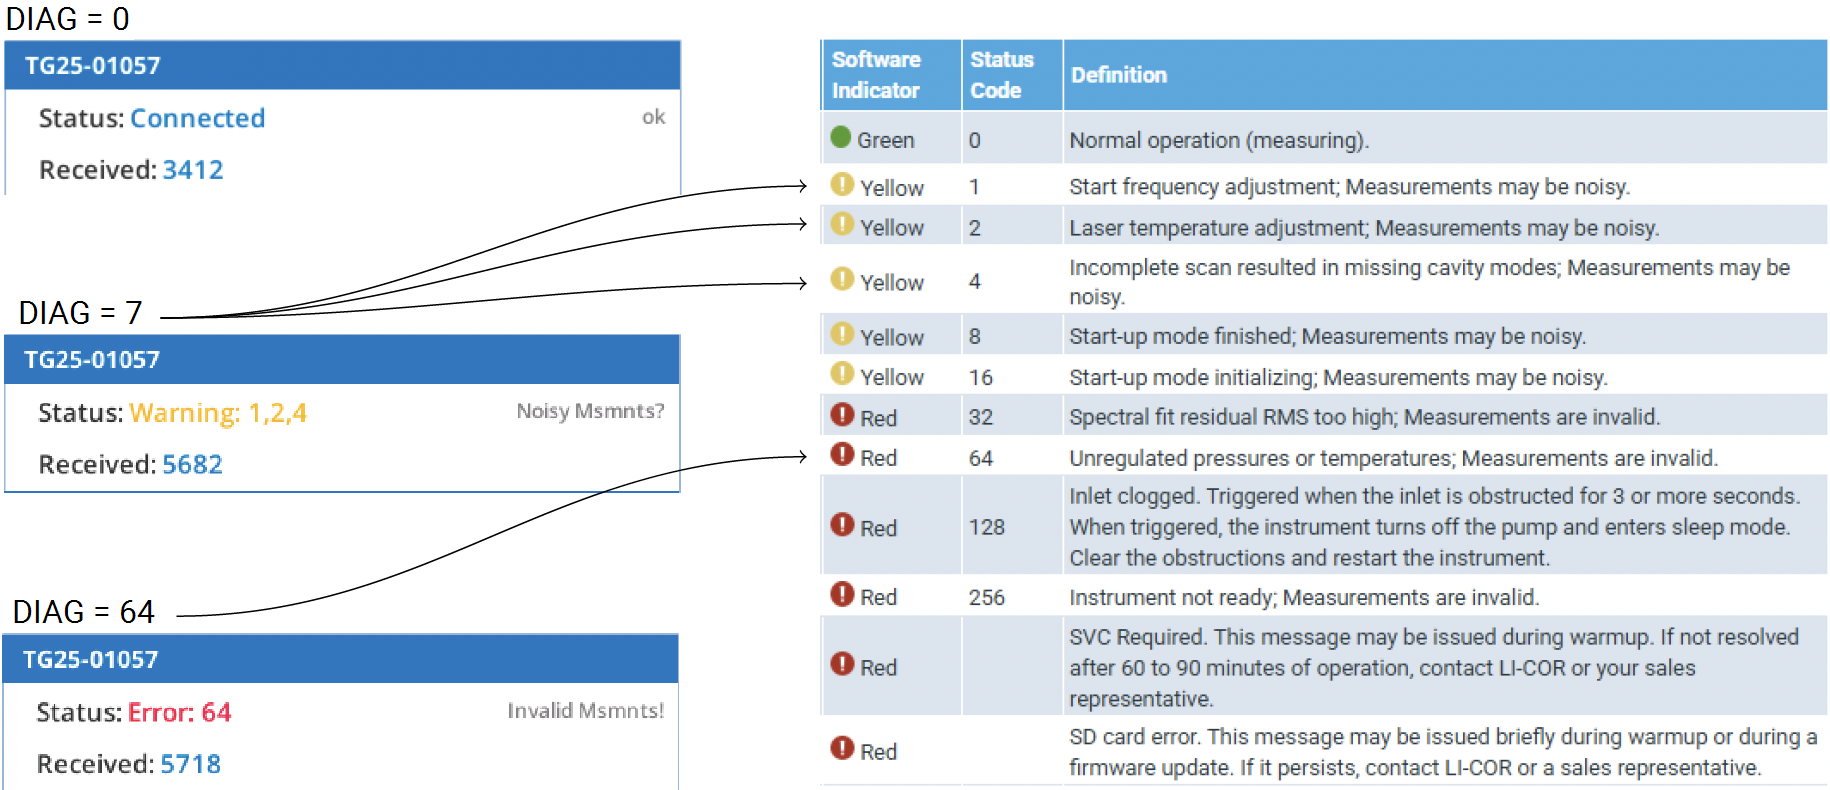
DIAG in group TGA_raw) are shown on the Status line.
-
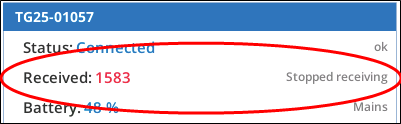
Received will increment at 1 second intervals, as each new concentration payload is received from the TGA. But, if something goes wrong (e.g. the cable is unplugged) you will be alerted to the lack of incoming data.
-
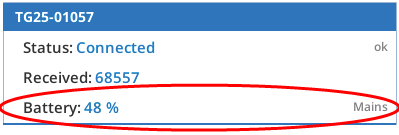
Battery shows the percent life remaining in the battery. 100% indicates the presence of two fully charged batteries. When not on mains power, a battery value below 40% is shown in yellow with a Charge soon message, and below 20% in red with a Low Battery! message.
TGA stability and matching
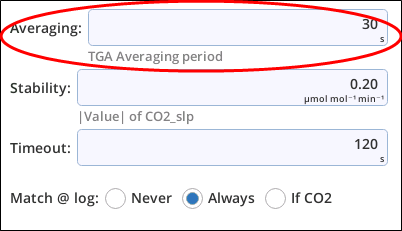
Averaging represents how much to average the TGA data (specifically, the TGA_stats group, which is used for TGA_meas, computations, etc.). This averaging goes on all the time, which means what you view on the console and what is logged in a data file are the same.
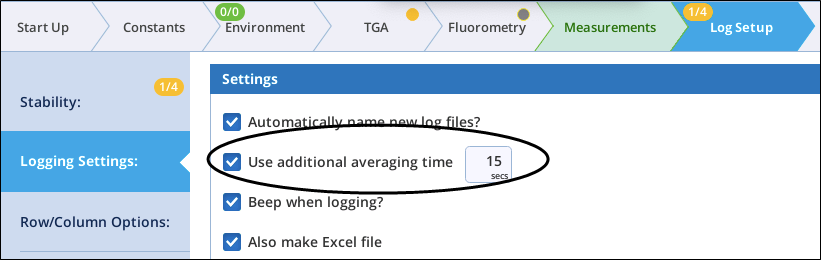
Note: The extra averaging option that can be applied when logging (Figure 12‑14), does not apply to the TGA data groups.
Stability is used to determine when TGA readings are stable. The value is a time rate of change (per minute) of the target gas, which depends on the TGA model in use.
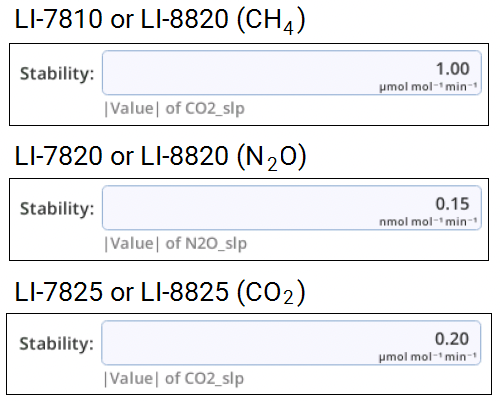
TGA stability is defined as three successive readings where the absolute value of the rate of change of CO2 with time is smaller then the value you have specified.

The Stable item under TGA Data is set using the above definition. It, along with the Timeout parameter, is used in the Automated Tank calibration routine.
The Match @ Log radio buttons answer this question: During an Automatic Match, do you want to wait for the TGA to stabilize?
Matching for the TGA is the opportunity to measure reference instead of sample air flows, and regardless of this setting, entering match mode will always update the TGA reference settings. This setting merely determines if those readings need to stabilize.
Matches that wait for TGA stability (or timeout after Timeout seconds) may take much longer than a normal CO2 and/or H2O match, depending on the averaging time being used for the TGA. For further information, see Matching and the TGA.
Note that the Match @ Log setting (and a number of other TGA-related settings) can also be set from a background program during data collection (see TGA:Match).
Scrub box values
The Scrub Box (refers to TGA interface box) section of the Status Page contains the following items and potential warnings:
-
Flow source: LI-6850, Tank A, or Tank B. This can be changed in the TGA Source & Cal panel (below).
-
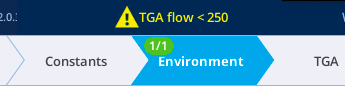
LI-6850 Flow: The flow exiting the LI-6850’s sample cell. Since the TGA is drawing from this air stream, the flow should be kept above 250 μmol sec-1. Below 250 is a yellow warning, and below 200 is red.
-
Op Mode: Self-explanatory messages.
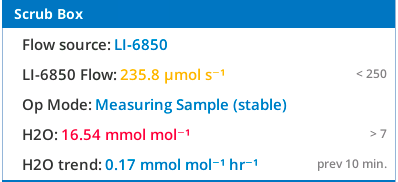
Note: In match mode, the reference flow is split between sample and reference, so you might want to run the pump a little higher all the time (e.g. Medium) so the Flow_r value is well above 500, allowing LI-6850 Flow to easily exceed 250 when a match occurs.
Low LI-6850 Flow warnings and alerts will also show up on the system messages:
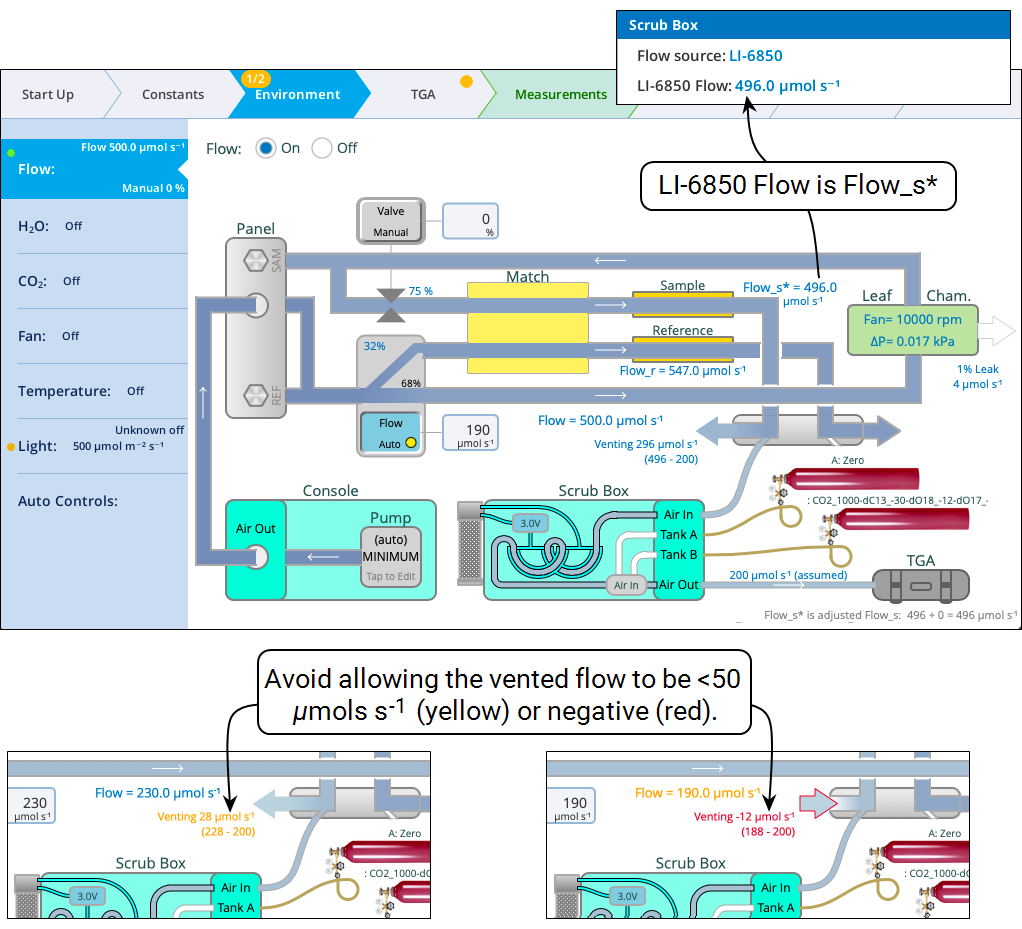
The LI-6850 Flow value comes from the sample cell exhaust flow meter with a correction applied (Figure 12‑15). The correction is determined during the Sample Cell Cal warmup test.
H2O_s is an averaged value from the TGA_stats group, but converted to mmol mol−1. To maximize the accuracy of the TGA’s isotopic measurements, the water in the air stream needs to be kept as low and stable as possible. Values above 5 mmol mol−1 will yield a yellow warning, and above 7 mmol mol−1 merit a red condition.
H2O trend comes from a 10 minute running average of H2O from the TGA_raw data (converted to mmol mol-1), updated every 10 seconds. Absolute values above 1 mmol mol-1 hr-1 yield a yellow warning, and above 2, a red warning.
Incoming TGA data groups
There are three main LI-6800 data groups maintained for incoming TGA data (see TGA data and groups for details), each flowing into the next.
TGA_raw → TGA_stats → TGA_meas
TGA_raw data arrives at 1 Hz, and is essentially the content to the TGA licor/niobrara/output/concentration topic. The gas concentrations from TGA_raw group flow into the TGA_Stats group, which computes (for the gas concentrations) averages, standard deviations, and rates of change, computed over a running period set by the Averaging time specified in Figure 12‑12.
If the flow source is the LI-6850 head (and not Tank A or Tank B), the TGA_stats data serves as an input to the TGA_meas group, which differentiates between sample and reference.
TGA_meas is NOT updated while the source is Tank A or Tank B.
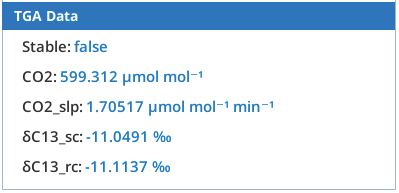
An LI-7825 example of the TGA Data on the bottom of the status page is shown to the right: CO2 and CO2_slp values come from the TGA_stats group. The δC13_sc and δC13_rc values come from the TGA_meas group. The s and r "subscripts" denote sample and reference, and the c denotes corrected, using the current isotopic cal (see The Isotopic Cal page).
The LI-6878 Scrub Box page
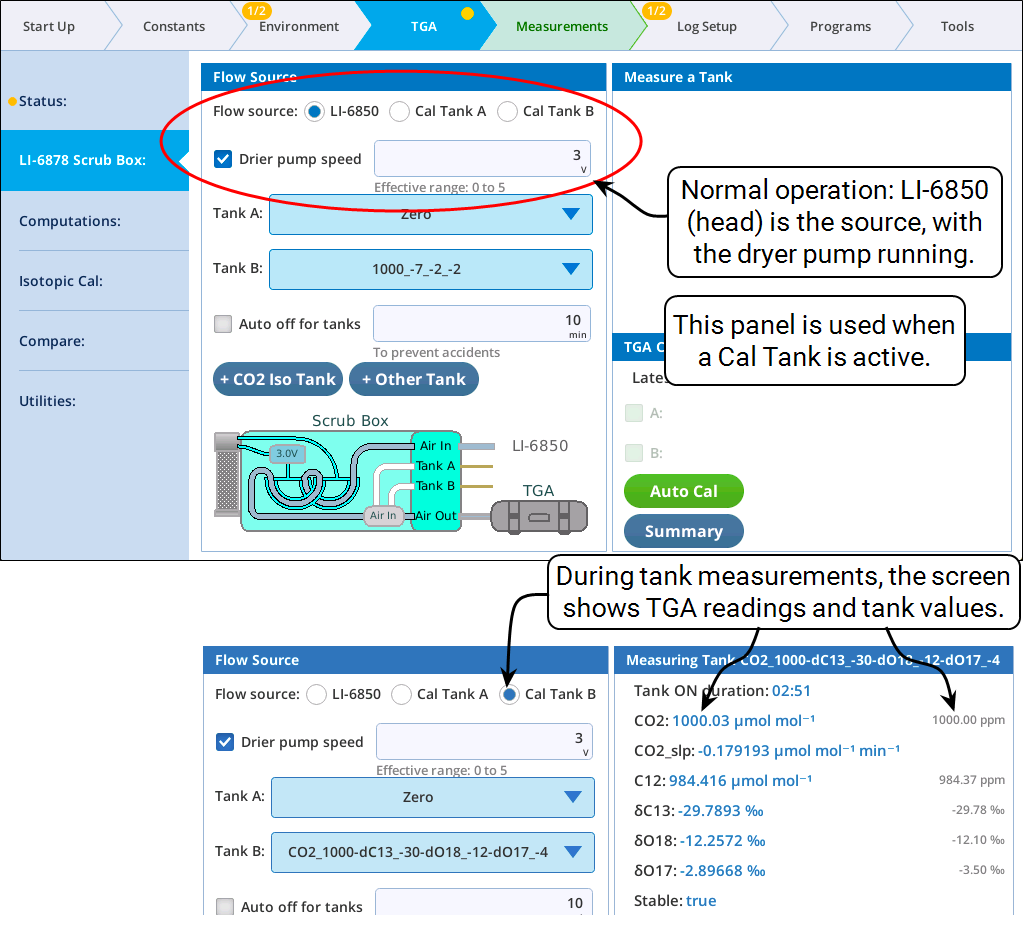
The control panel for the TGA interface box is presented in Figure 12‑16. The figure shows the configuration needed for all measurements involving the LI-6850: The flow source is the LI-6850, and the drier pump is running (make sure you have fresh desiccant in the TGA interface box scrub tube).
TGA calibrations are described in Calibrating the TGA.
See User I/O controls and the TGA interface box for implementation details.
Flow source
Flow Source selects between the three available inputs for the TGA: air coming from the LI-6850, or from one of two tank ports.
Note: If a tank port is selected but no tank is actually connected (and turned on and properly regulated), the TGA will be measuring ambient room air.
Tank A and Tank B are menus that let you identify the tank connected to that port. There are two default settings (None and Zero). Defining tanks is discussed in Adding tanks.
Drier pump speed: This checkable edit box controls the TGA interface box internal pump that circulates air between the desiccant column and the outside of the Nafion tubing. Clearing the box effectively sets the voltage to 0 (although the value in the edit box does not change). Checking it sets the control to the value in the edit box.
The Computations page
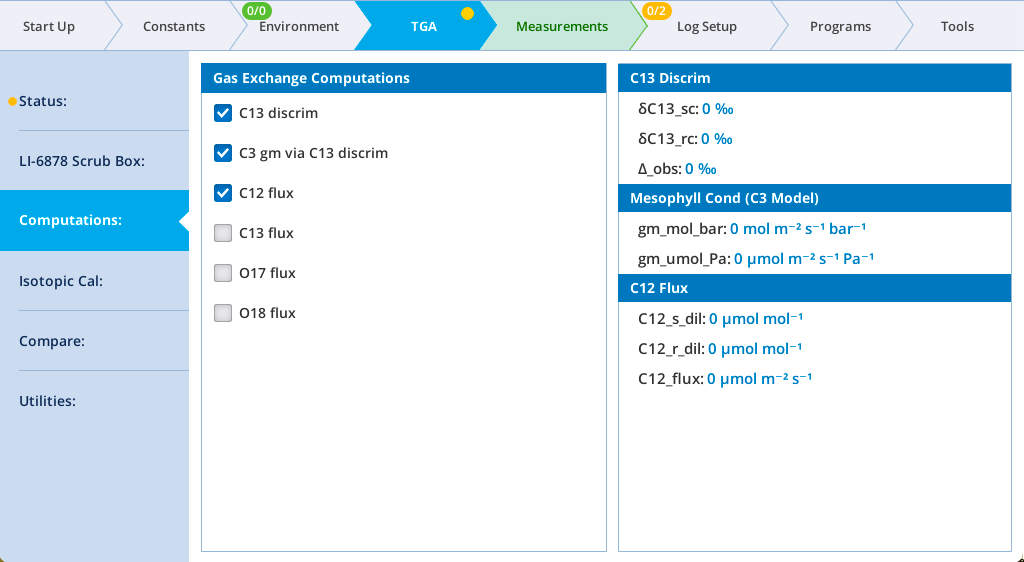
Computations are dependent on the type of TGA. The LI-7825 / LI-8825 supports mesophyll conductance and isotopic fluxes. The other TGAs have support only for flux computations. Computations can be selected or not as long as a log file is not open.
C13 discrimination
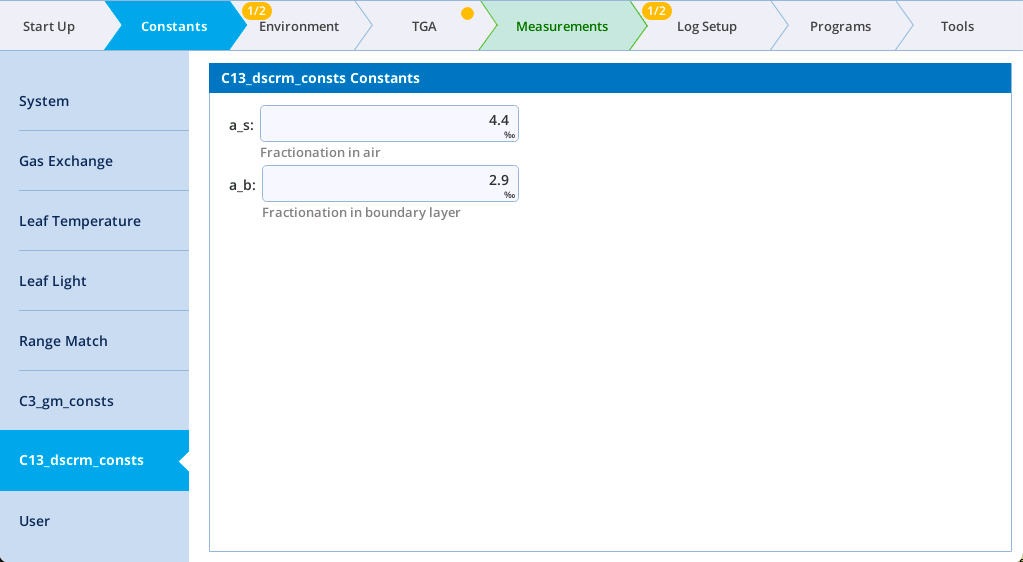
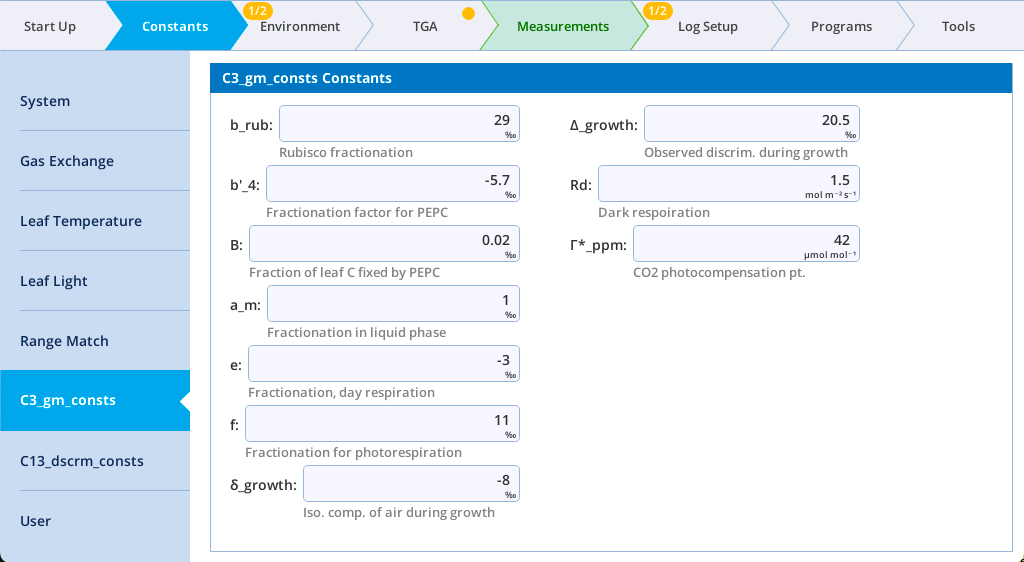
When the C13 discrim option is selected, a constants page is added for the computational inputs. See Computing C13 discrimination for more details.
Mesophyll conductance
When the C3 gm via C13 discrim option is selected, a Constants page is added for the computational inputs. See Computing C13 discrimination for more details.
Fluxes
Flux computations groups and equations are presented in Computing trace gas fluxes. There are no constants pages for flux computations.
The Isotopic Cal page
Designed for the LI-7825 / LI-8825, the Isotopic background calibration is the empirical calibration that should be done at least daily, or whenever the LI-6800 CO2 cylinder is changed. Operational guidance can be found in Isotopic calibrations. Computational details can be found in Isotopic calibration details.
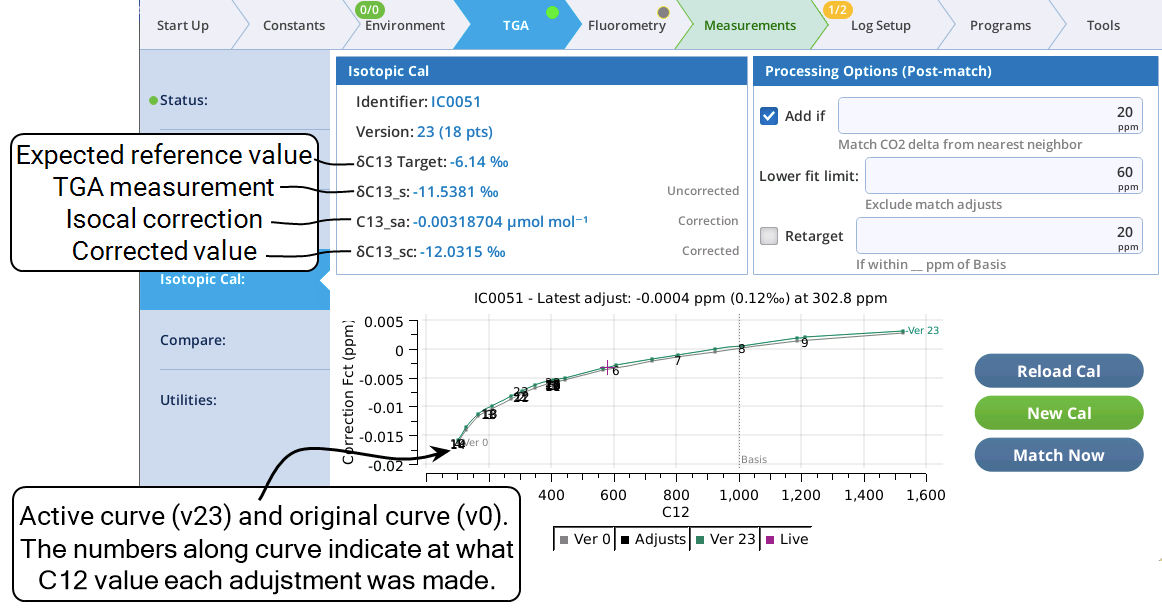
The Isotopic Cal screen (Figure 12‑20) shows the state of the current isotopic calibration, if any.
-
For a summary of Processing Options (Post-match), See Post match adjustments.
-
To load a previous a calibration (Reload Cal), see Loading a previous cal.
-
To establish a calibration (New Cal), see Measure a new cal.
-
To match (Match Now), see Using match now.
The Identifier is the short name of the current isotopic cal. Each time a cal is done, the IC number will increment. Each time the isotopic cal is adjusted (a match or a TGA cal), the Version number increments. Version starts at 0, before any adjustments (matches or TGA cals) occurred.
Each isotopic cal, along with any subsequent adjustments, is recorded in a text file in the /home/licor/logs/tga/isocals/ directory, grouped in folders by TGA serial number. File format details are described in File structure.
The graph on this page always shows the original curve (Ver = 0) in gray and the curve following the latest adjustment in color (Ver = 23 in Figure 12‑20). Version numbers appear along the curves indicating at what 12CO2 concentration each match (resulting in that version) happened.
The Compare page provides tools for looking at isotopic cal data in more detail.
The Compare page
The Compare screen (Figure 12‑21) provides some tools for analysis of current and previous isotopic cals.
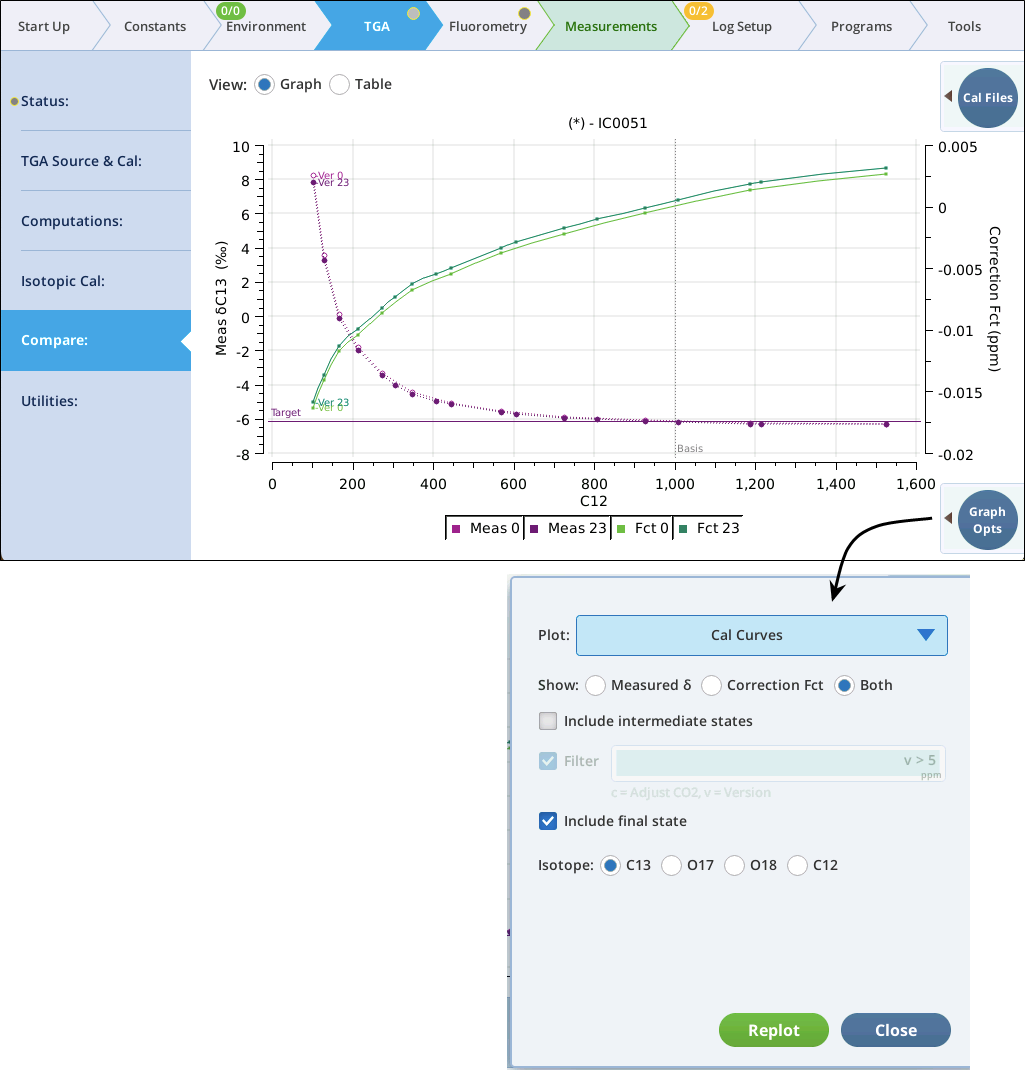
The Compare Page graph can show not only the correction function (in green above), but also the data on which it is based (in purple above). (The graph options drawer has a radio button selector for one, the other, or both). Version 0 measured data is the data collected when the isotopic cal was measured. The measured data shown for subsequent versions is simply computed using the adjustment determined by the match or TGA cal applied to the measured data of the previous version. The correction curve is then computed from this adjusted data set.
The graphing options for isotopic calibration data and corrections are discussed in Cal curve options. In addition, you can also look at the time series of events associated with an isotopic cal (Time series options). Either style can be applied to multiple isotopic calibrations (Comparing isotopic calibrations).
Cal curve options
Figure 12‑22 illustrates how to select which part of the isotopic calibration to plot: the measured data and/or the correction function.
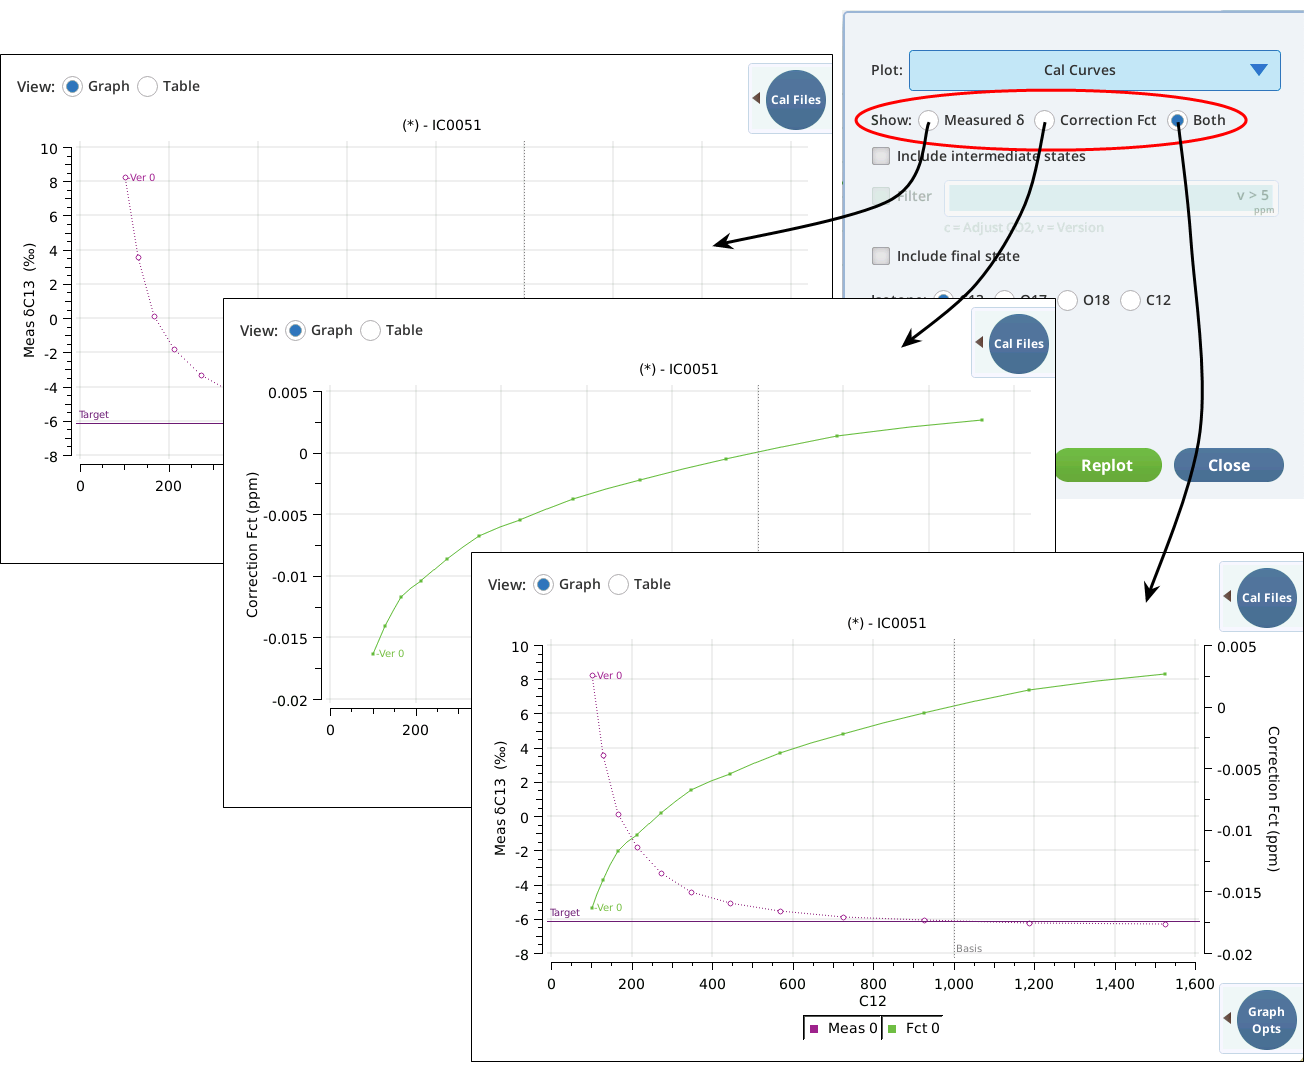
Figure 12‑23 illustrates how to add the highest version of a cal to the plot.
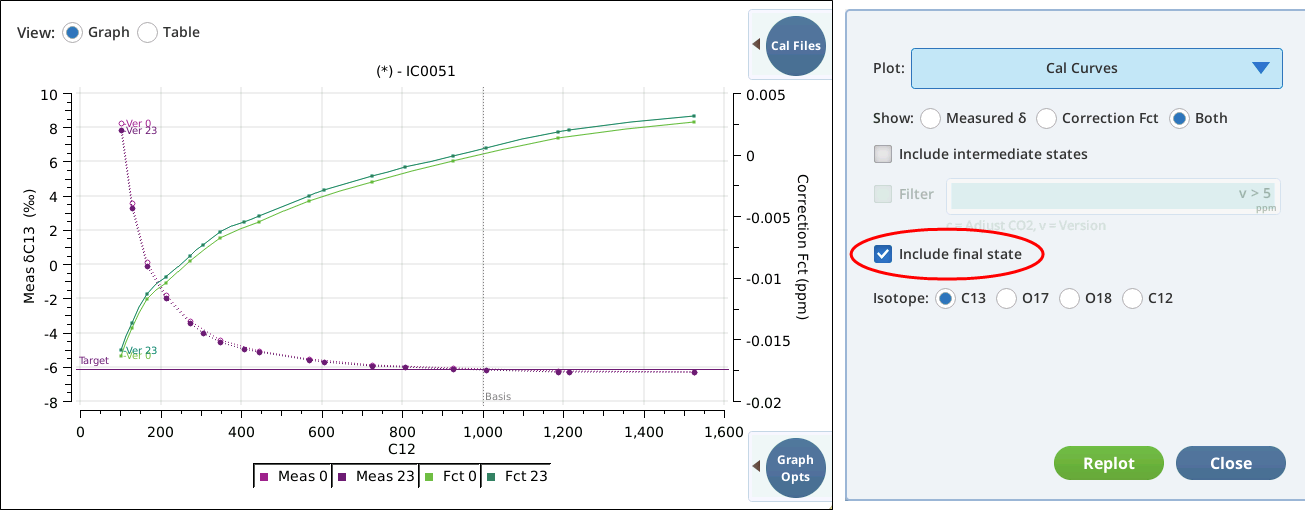
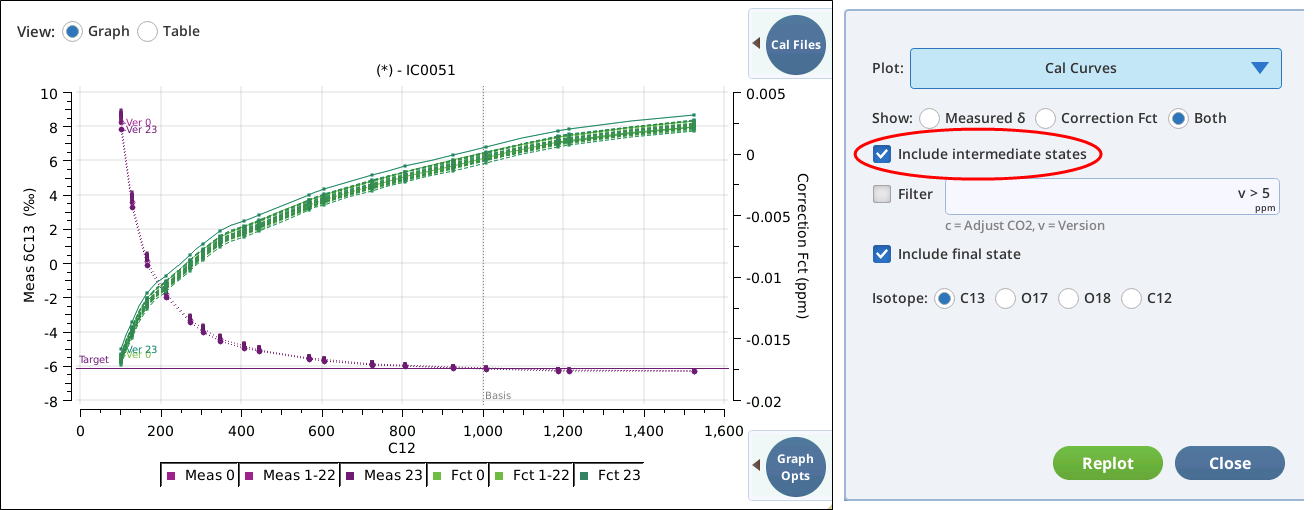
Intermediate versions can also be plotted (Figure 12‑24). Note that you can filter which ones are shown using a simple logical expression.
All intermediates can be shown...
...or they can be filtered. c < 190 means only show adjustments that occurred below 190 ppm.
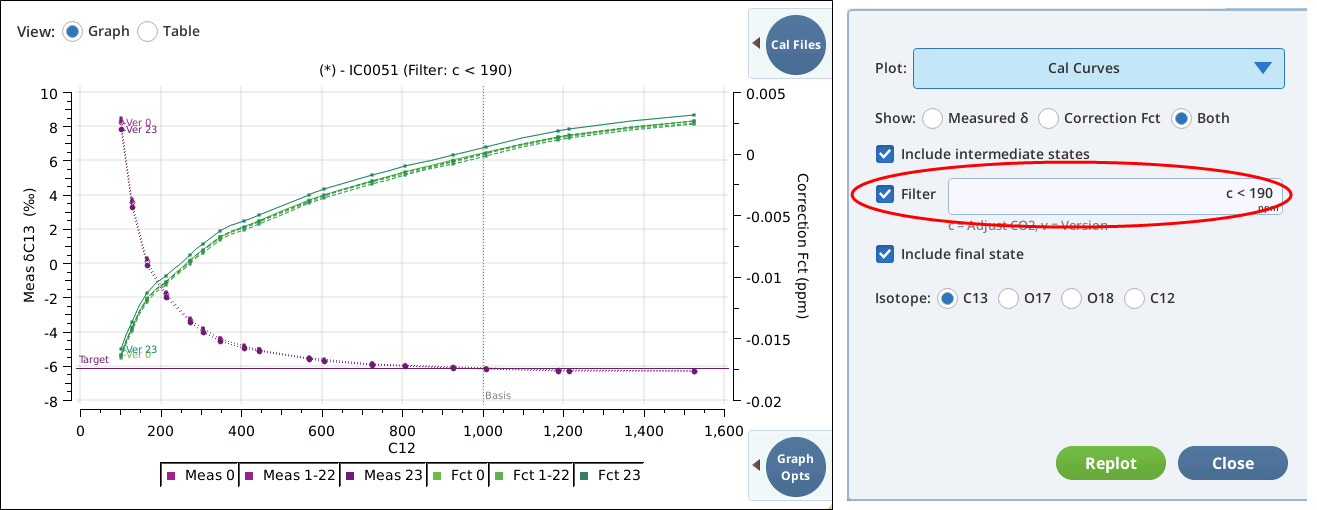
The filtering box selects which intermediate versions are displayed. The entry is evaluated as a python Boolean expression in which there are two defined variables: v for the version number, and c for the concentration at which the cal adjustment took place. Table 12‑2 gives some examples.
What’s the relation between version number and C12 adjustment concentration? That is one of the insights readily available using the tools in the next section, Time series options.
Time series options
The time series options allow you to view the adjustments made to the isotopic cal over time. To illustrate, we’ll use it to try to gain some insights into IC0051, which we’ve been using in all of the figures in this section.
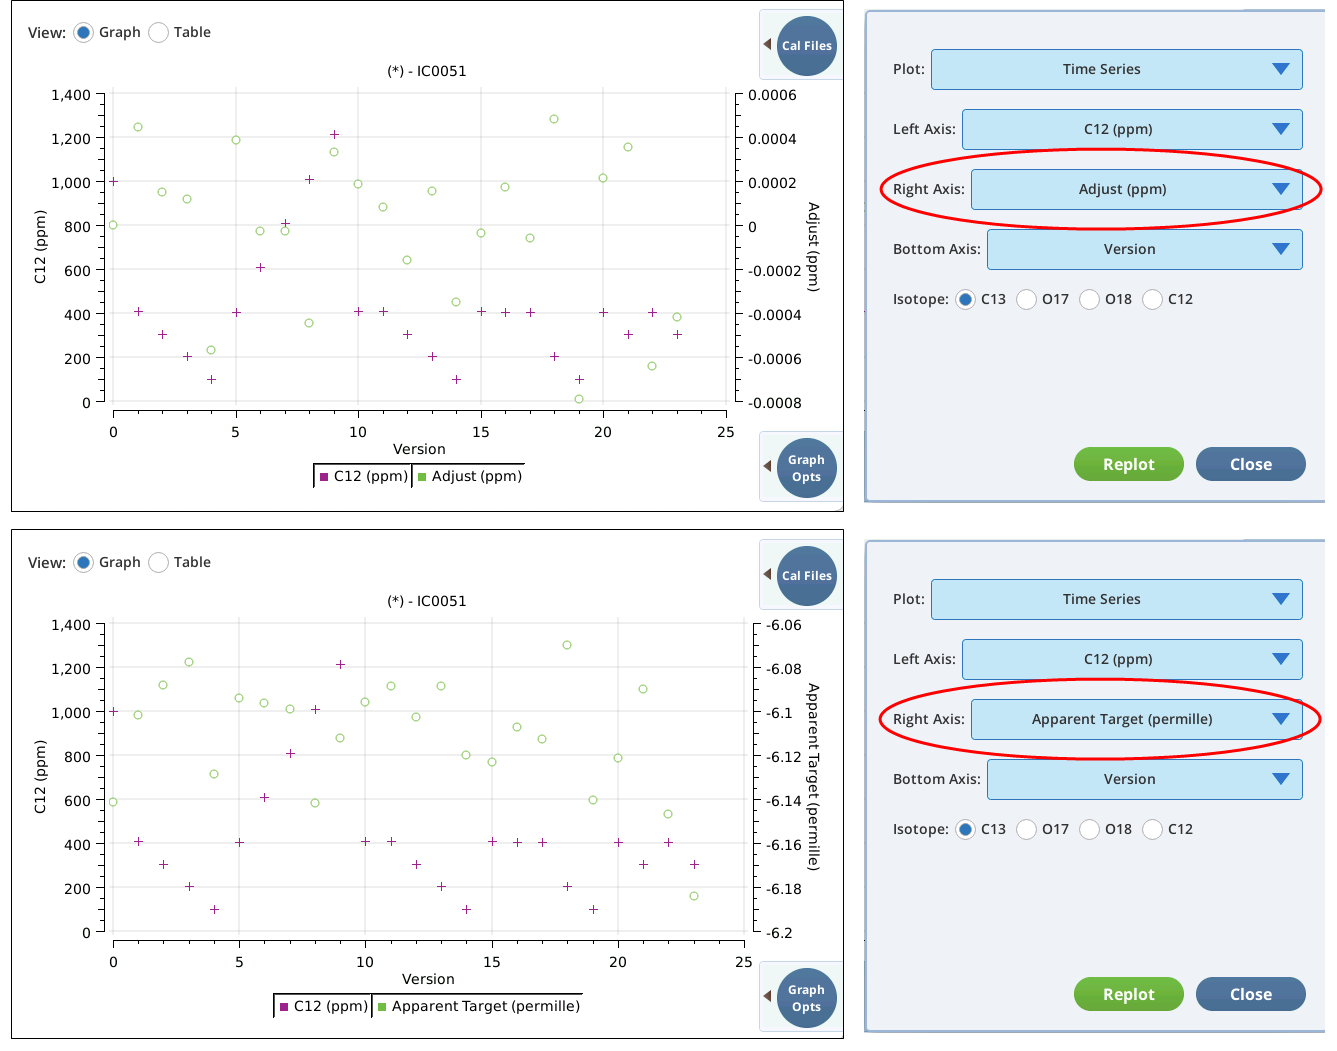
Figure 12‑25 shows the version history of IC0051, with version on the bottom axis, adjustment (e.g., match) C12 value in red pluses on the left, and the target per mille value (measured during the isotopic cal) in green circles on the right. Since all adjustments were made assuming the target wasn’t changing (the Retarget box in Figure 12‑20 was left unchecked), the targets all have the same value.
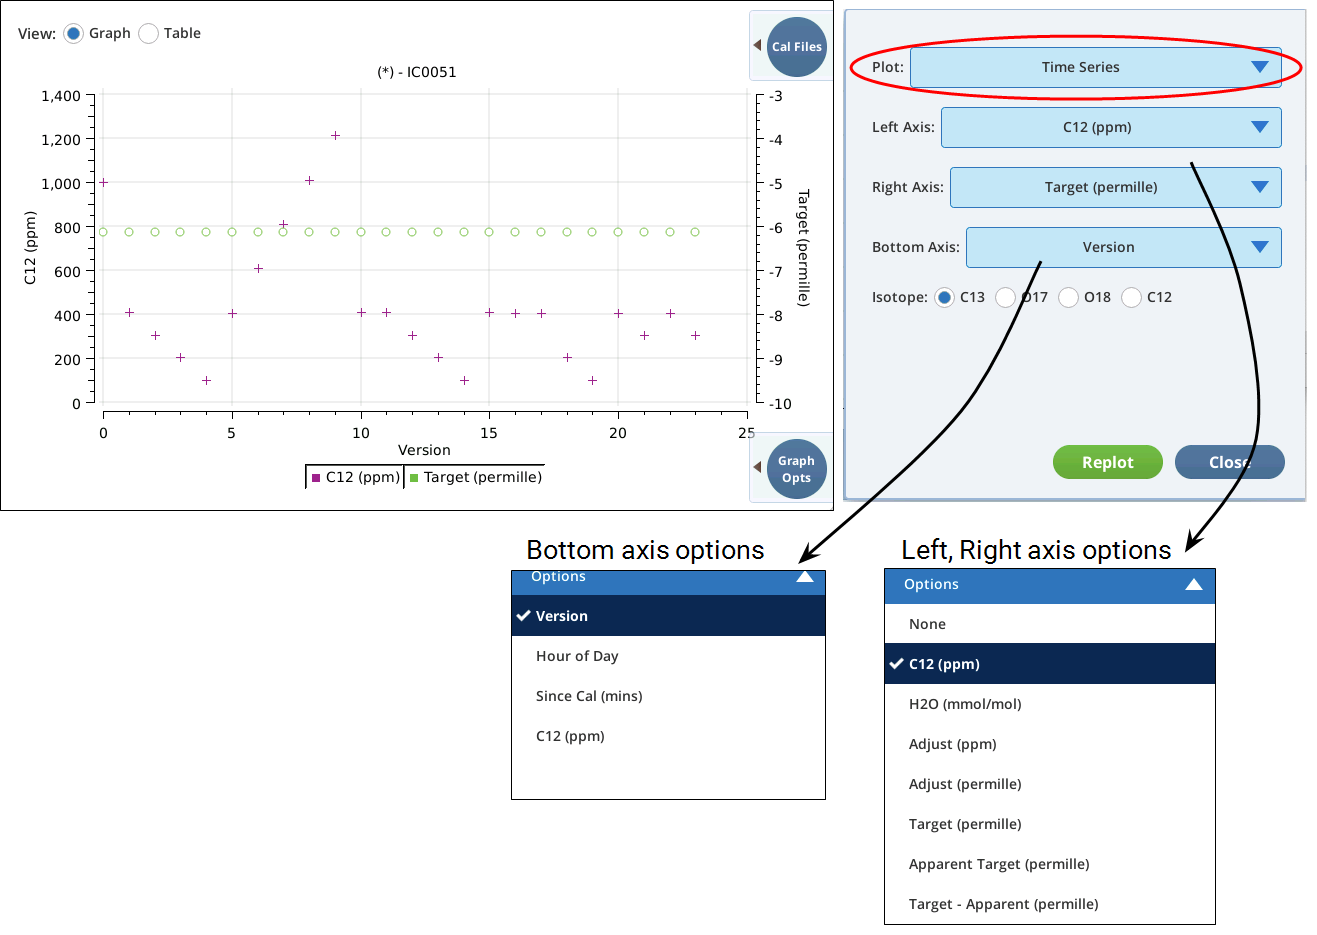
We know from the spread of the correction curves (Figure 12‑24) that corrections had to be made to keep the target at its -6.14 value, and a number of the choices are available to see this. Two of the options are shown in (Figure 12‑26). The upper figure shows the adjustments in units of ppm, and the lower as the apparent (pre-correction) target value of δC13.
It is important to remember that all adjustments are cumulative. That is, only version 1 is an adjustment from the original isotopic cal data. Version 2 is a correction to version 1, and so on. So, in the figure, we start at version 0 (1000 ppm is the basis concentration) with a 0 correction and -6.14 apparent target. The next three adjustments (at 400, 300, 200 ppm) are positive but decreasing (0.00042, 0.00018, 0.0001), in terms of ppm (top graph), corresponding to an apparent target value that marches upward (-6.1, -6.09, -6.08, bottom graph). When we get to 100 ppm (version 5), there is a large correction in the other direction (-0.0006) roughly equivalent to the accumulated adjustments so far.
Note that the corrections at 100 ppm tended to be the most negative, especially for version 19. This is not unusual: the lower the concentration, the larger the effect of an offset is on the per mille value, since computing per mille entails dividing by the background concentration.
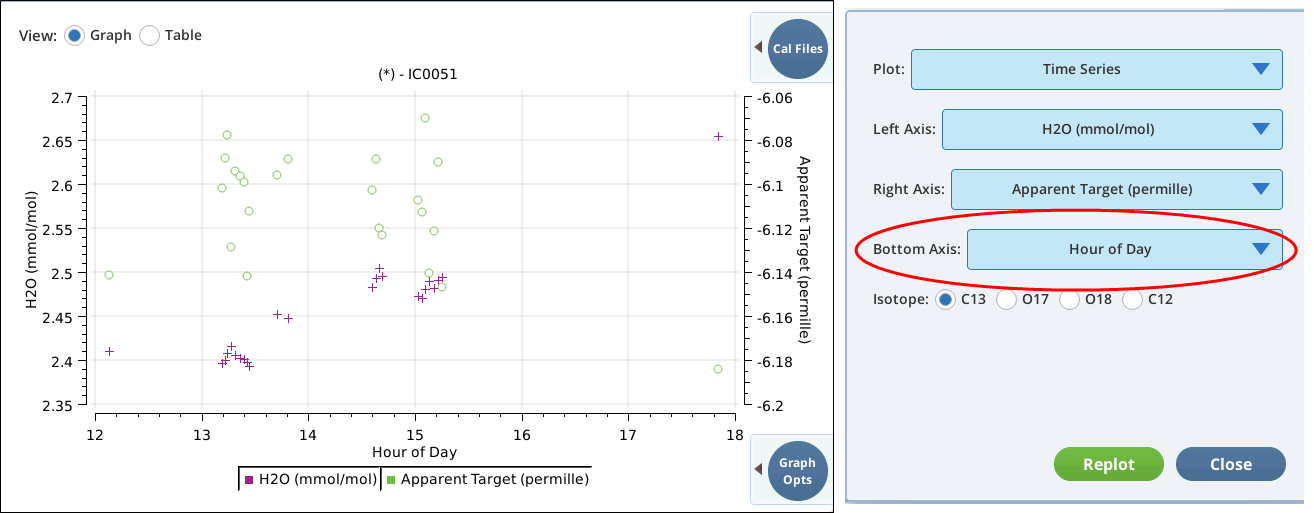
Useful insights can come from plotting against time, instead of version number (Figure 12‑27). This view helps explain why the final state correction curve of IC0051 is so out of line with the original and intermediates. The figure plots water (red pluses) on the left, and apparent target (green circles) on the right. From the H2O curve, we can see a steady degradation of the interface box drying ability, which may or may not be contributing to the drop in apparent target at the end. The more likely candidate for the change is simply time: by the end, the CO2 cartridge had been installed for at least 6 hours, and it is very possible that as the cartridge is used and its internal pressure drops, changes in fractionation will cause the apparent target to shift.
Comparing isotopic calibrations
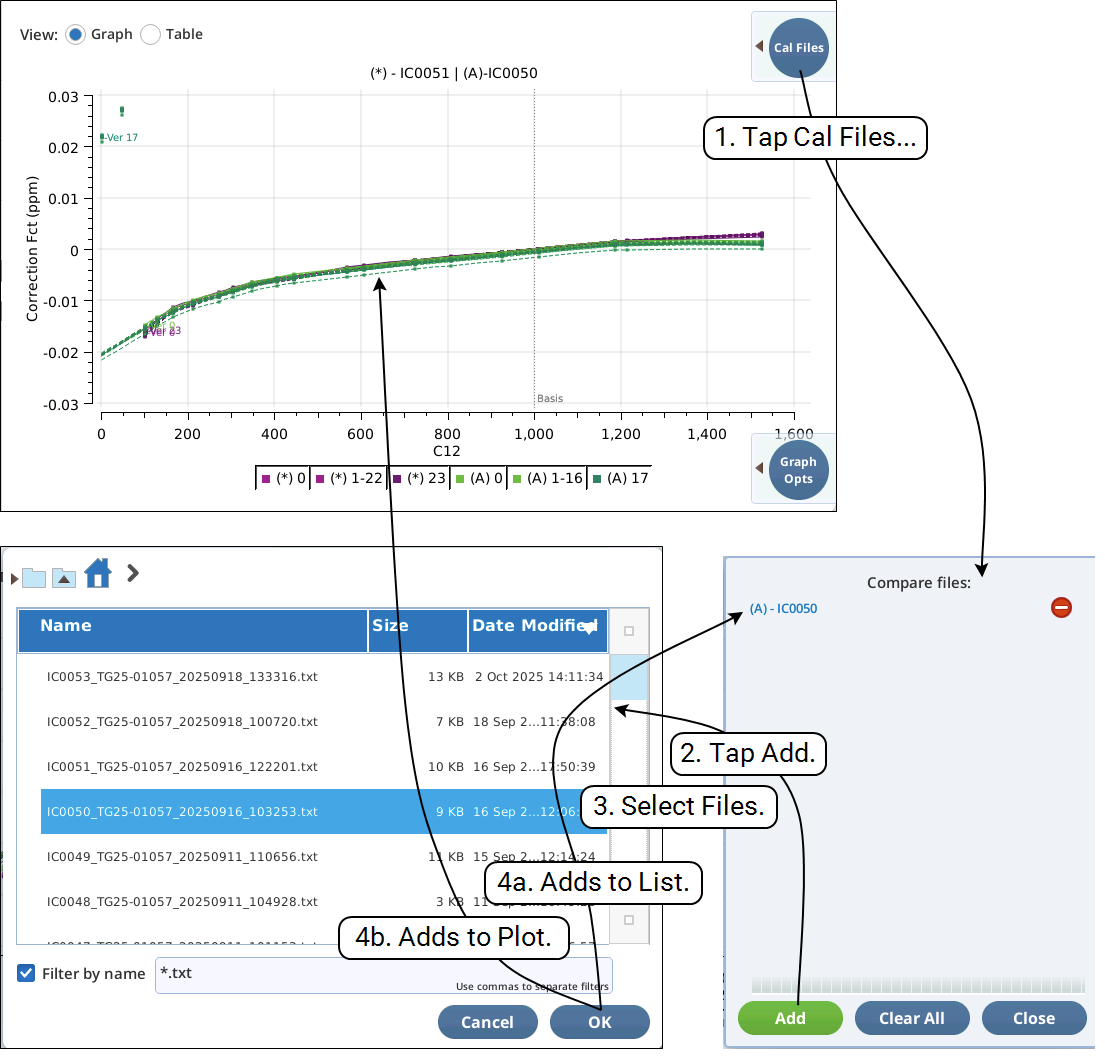
The current calibration can be compared to previous cals, by loading the prior cal using the Cal Files pullout drawer (Figure 12‑28).
Hints:
-
Any of the Cal Curves or Time series settings work with multiple cal curves.
-
When showing multiple curves, a common color is used for a given file.
-
If you wish to compare calibrations without having the current one on the graph, load one of the older calibrations as the current (Loading a previous cal), then add the others using the Cal Files drawer. Don’t forget to reload the latest cal when you’re done.
The Utilities page
The utilities page contains a collection of potentially useful programs related to TGA Support.
-
View Daily Log - provides a graphical view of the daily TGA log files (TGA_raw data sampled at 5 minute intervals while a TGA is connected).
-
Min Flow Finder - empirically determine the minimum safe LI-6800 flow rate to avoid contaminating the TGA measurement with ambient air.
-
Gas Transition - provides a slow transition to or from tank gas being used as a source for the LI-6800 that is very different from ambient air (e.g. low oxygen tank), to avoid losing line lock and having to reboot the TGA.
The choices are shown in the main menu. Select an item, then tap Start to launch it.
View daily log
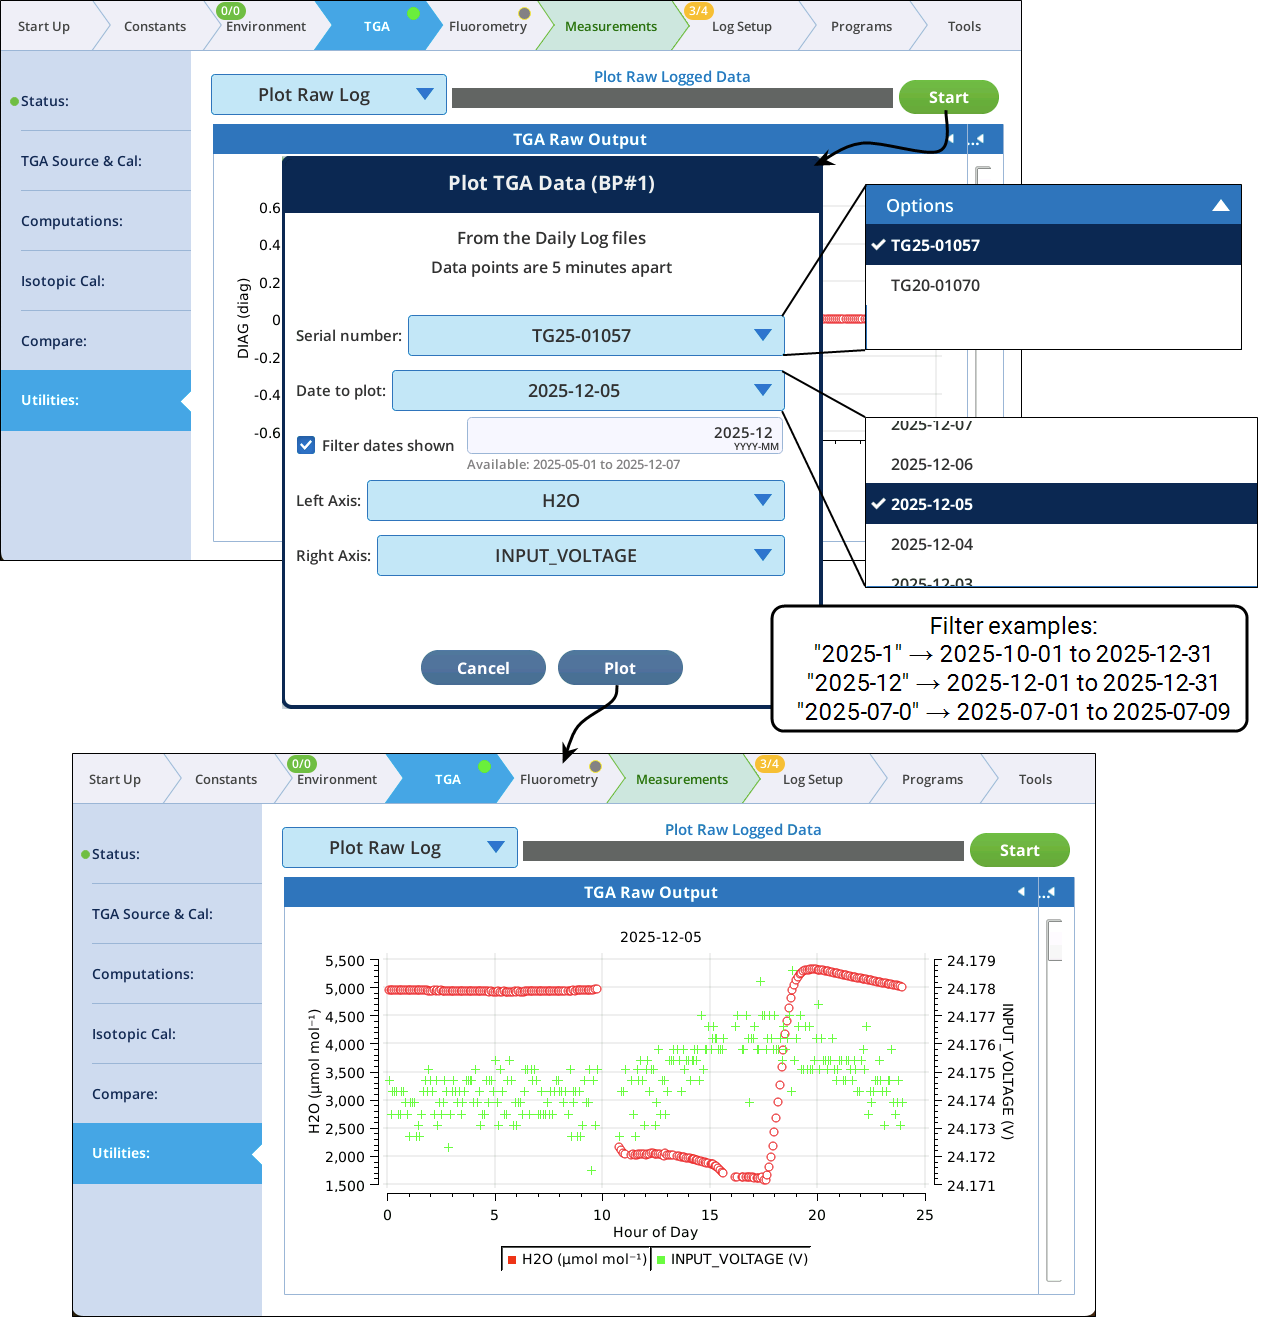
While the LI-6800 is in communication with the TGA, the TGA_raw data (see TGA data and groups) is logged every 5 minutes to daily files stored in /home/licor/logs/tga/raw/<serial>. The View Daily Log utility (Figure 12‑29) allows you to pick a file to view.
Use the Filtering option to limit the size of the Date to plot menu to a reasonable number. The filtering is simply by string compare with the file names, which are named using YYYY-MM-DD.txt format (see Figure 12‑29 for examples).
Min flow finder
The minimum flow finder empirically determines the minimum flow rate to prevent ambient air incursion into the TGA. Since the TGA flow rate is assumed and not measured, this program should be used as a check for what the TGA flow appears to be.
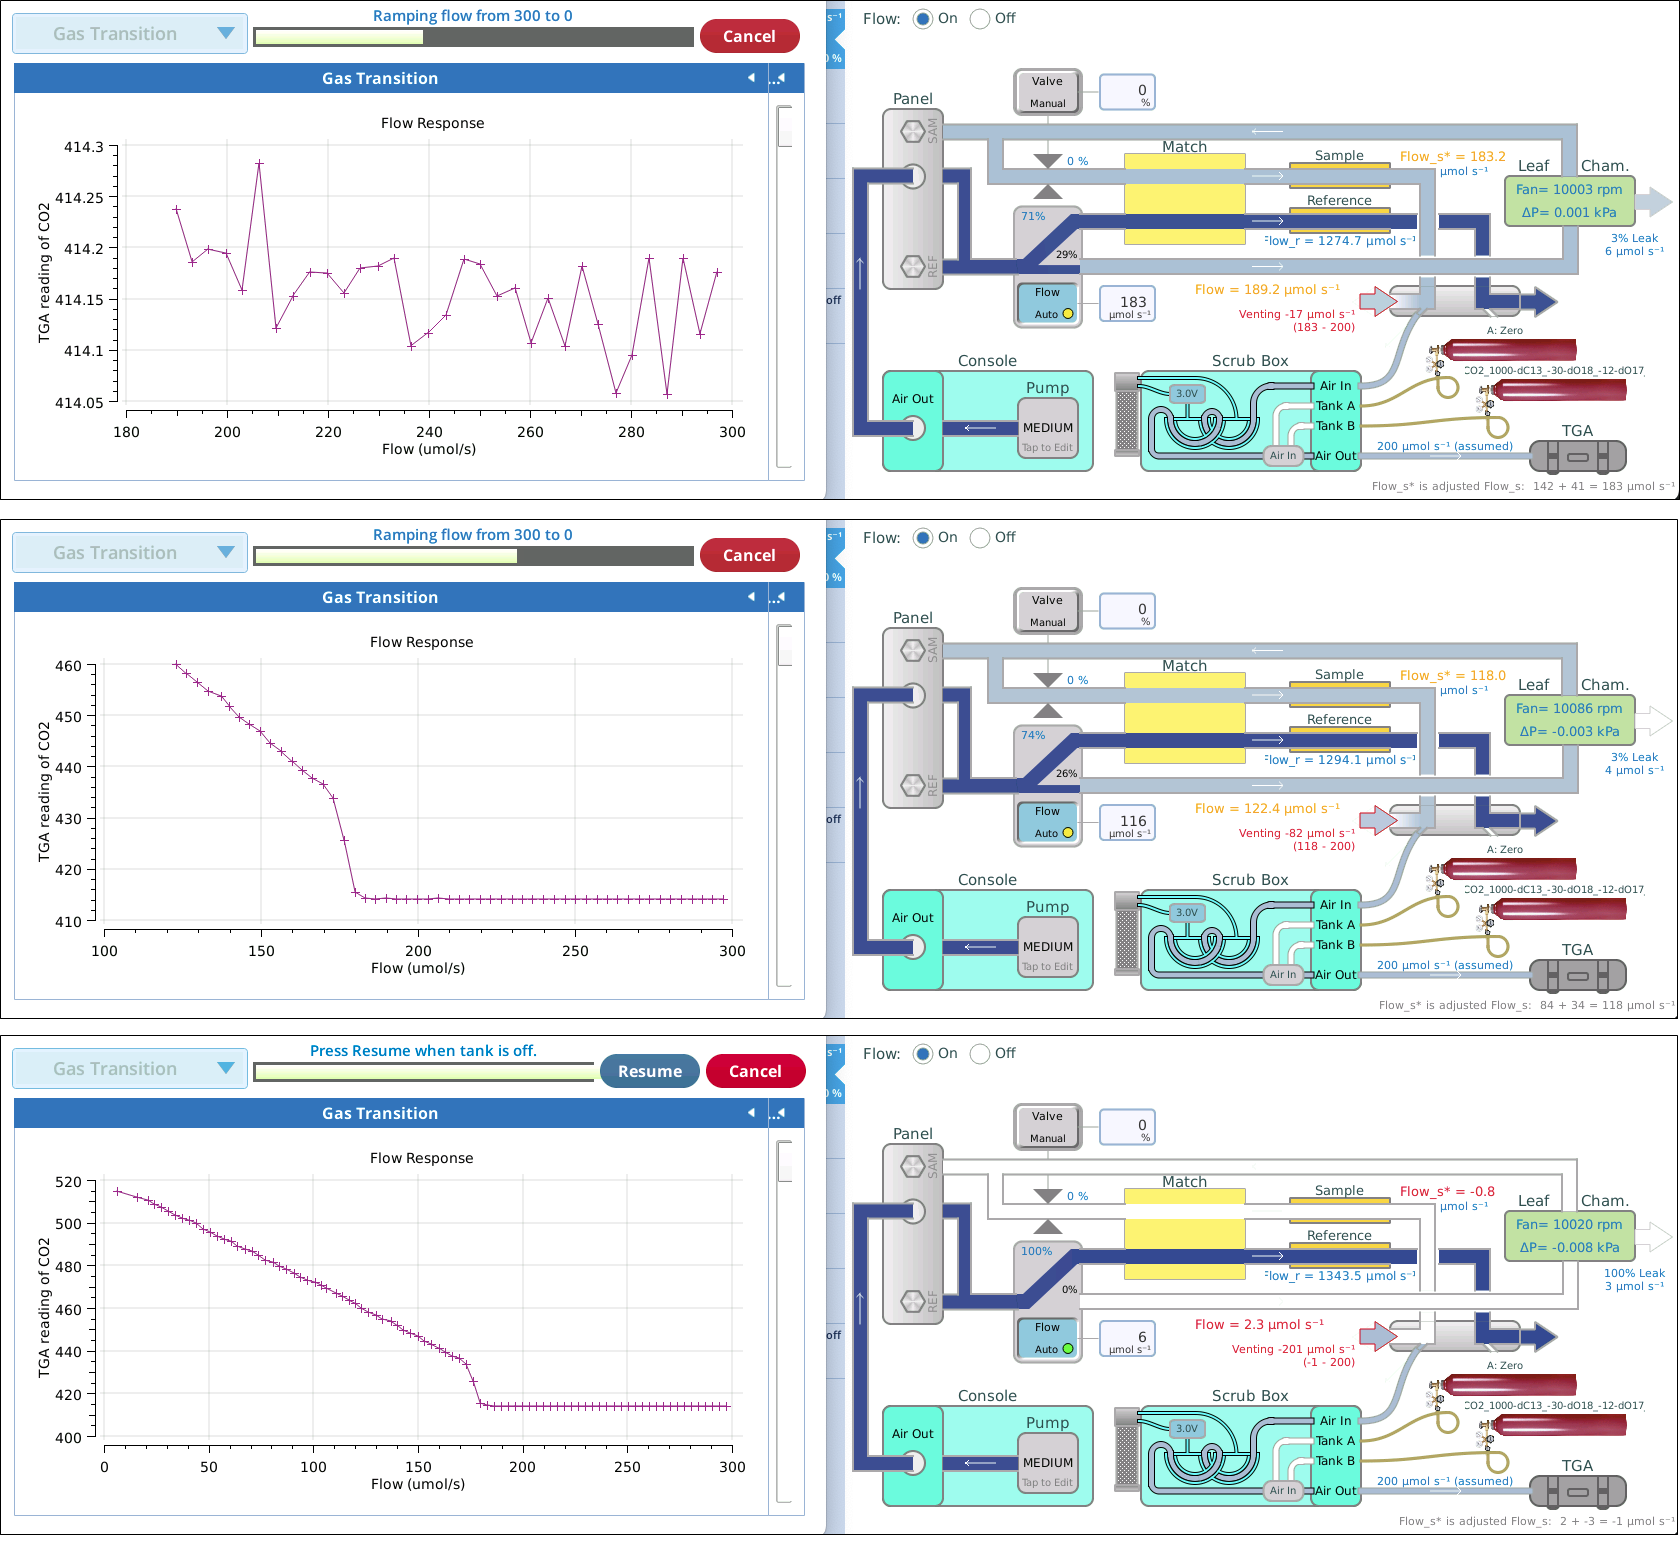
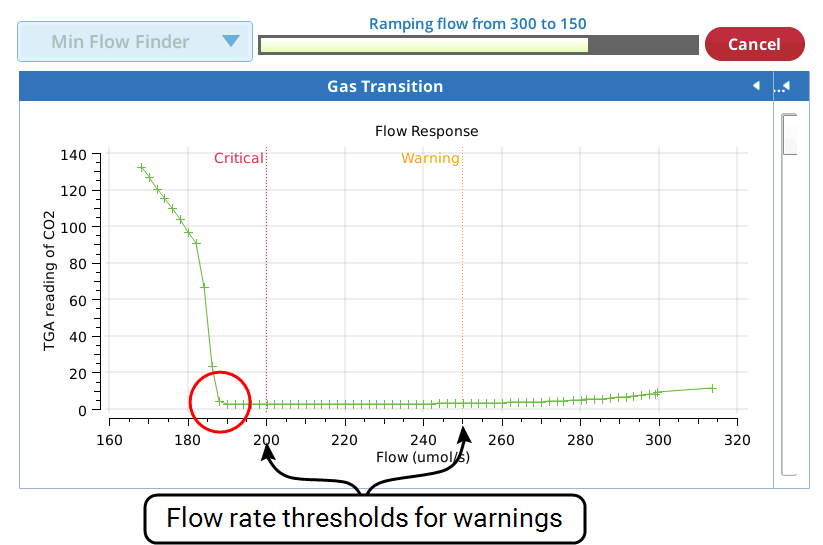
The test is done by using turning the CO2 mixer off and leaving the soda lime scrub on, providing CO2 free air. The program then ramps the flow rate that goes to the chamber (and thus to the TGA) from an upper “safe” value (e.g. 300 μmol s-1) to a “very unsafe” value (e.g. 150 μmol s-1). A plot of the TGA’s measure of CO2 as a function of flow rate will clearly show the flow rate that ambient incursion begins.
Since it used CO2-free air, this test is designed for TG10s and TG25s (LI-7810s and LI-7825s). To do a similar test with a TG20 (LI-7820. which measures N2O), use the Gas Transition utility described below with a suitable zero tank (normal N2 and O2, but zero N2O); it’s graphical output can be used to detect the minimum safe flow.
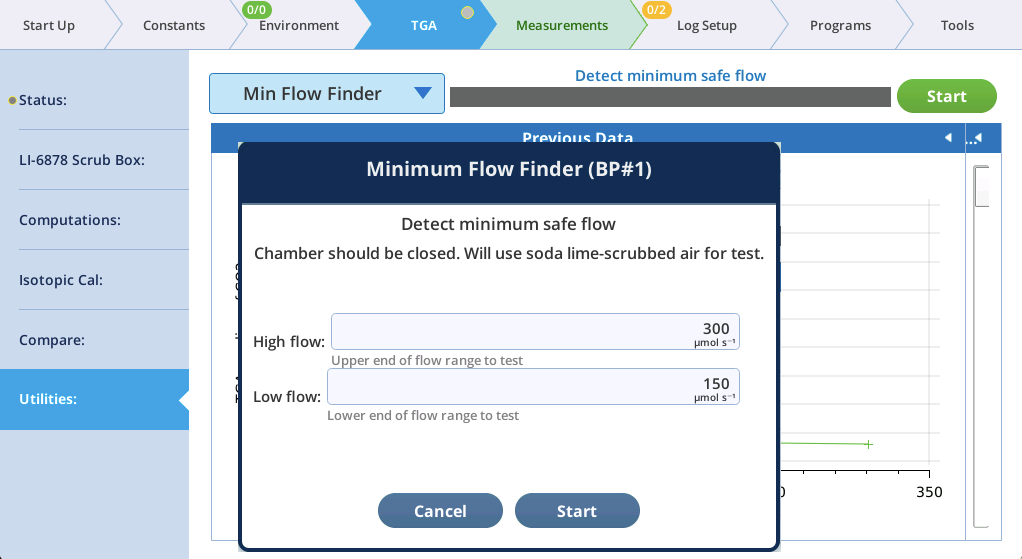
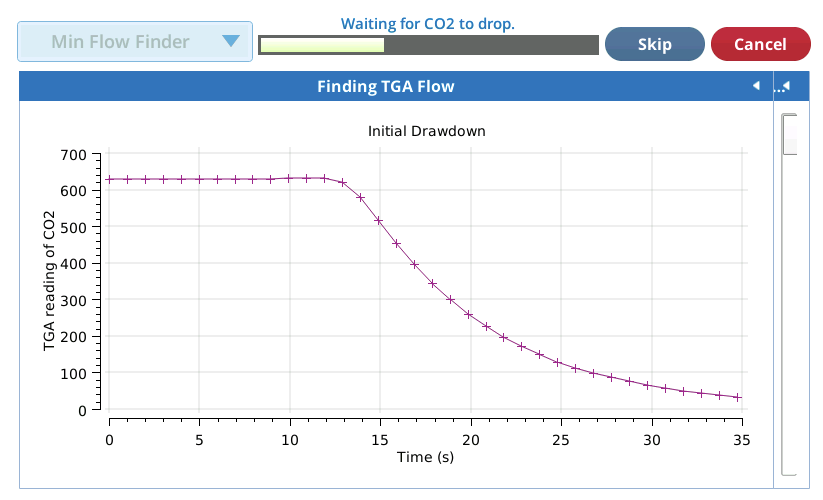
When Start is tapped, the CO2 control is turned Off, but the soda lime left on, to scrub the air (Figure 12‑31). Wait for CO2 to drop. You can tap Skip once CO2 is well below ambient to speed things along.
The flow rate begins a slow ramp from 300 down to 150. When the flow is low enough to allow ambient air incursion, the CO2 will rise abruptly (Figure 12‑32).
Gas transition
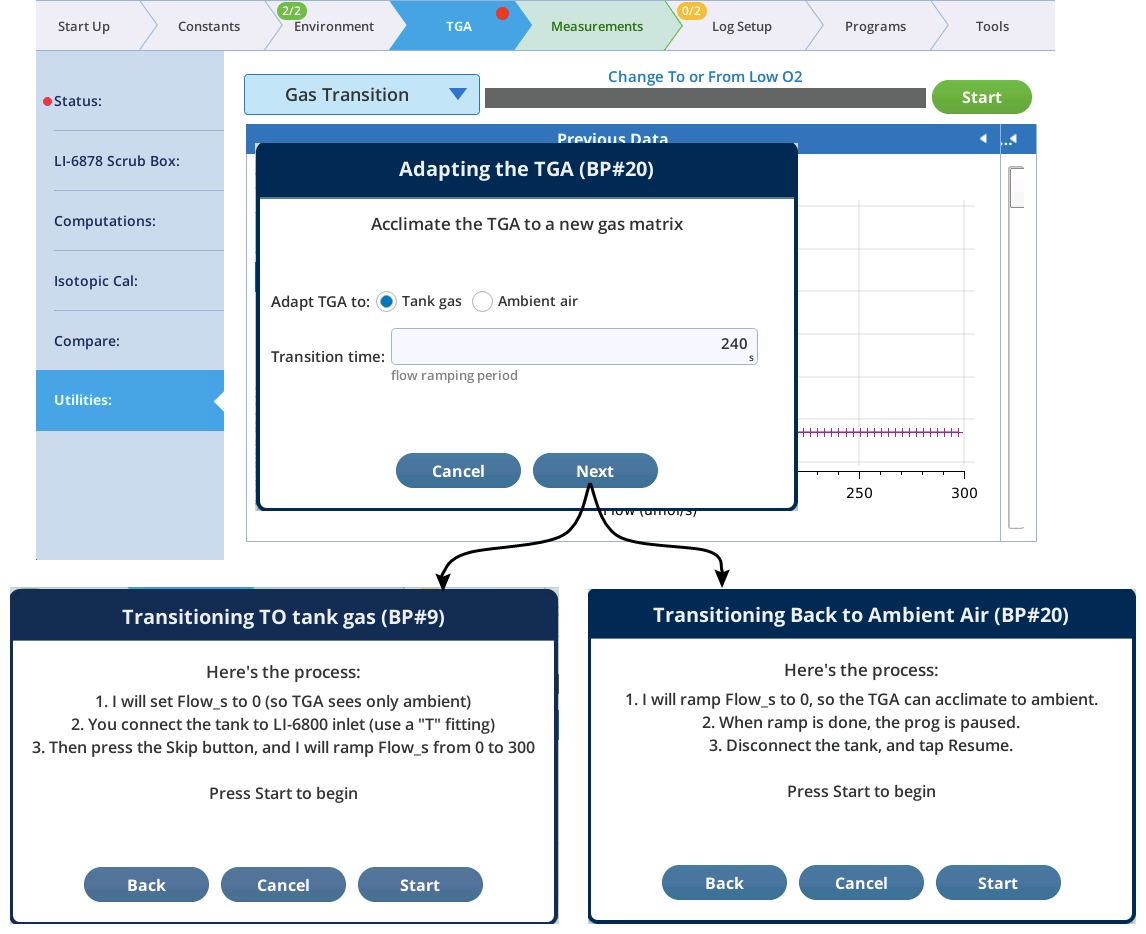
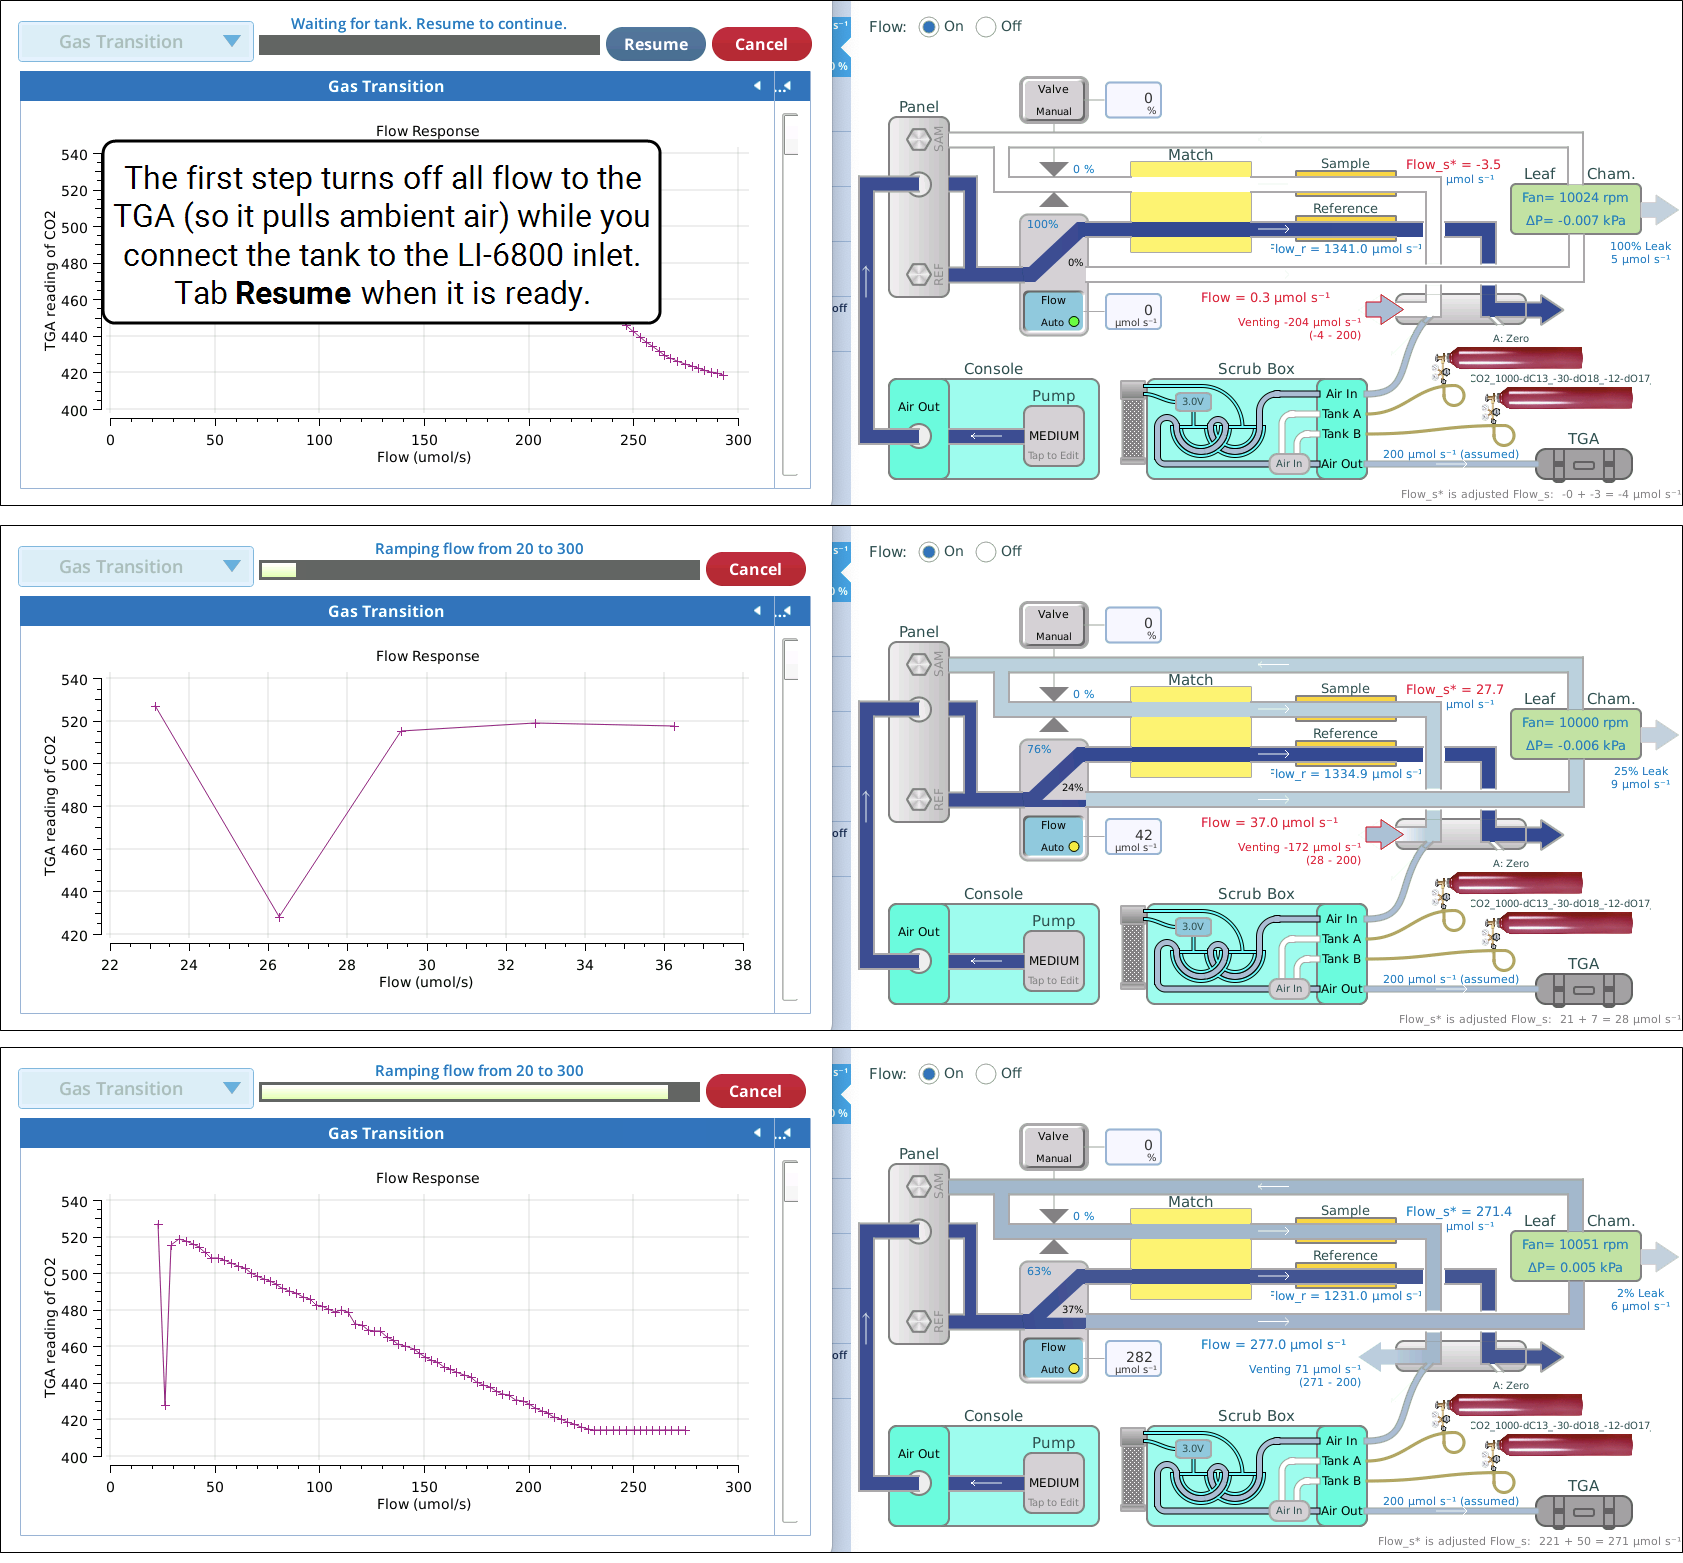
The Gas Transition utility provides a method of slowly transitioning the TGA between ambient air and air from a tank that has a significant difference in its background (N2, O2) makeup, since abrupt transitions can cause the TGA to lose line lock and require rebooting.
Note: “Tanks” in this discussion refer to a tank you might be connecting to the LI-6800 air input (using a “T” fitting so the LI-6800 pump draws from the tank regulator’s flow, and the excess flow is vented.). Low oxygen experimental configuration is a case in point. We are NOT referring to calibration tanks that might be connected to the LI-6878 Scrub box.
To tank
The following sequence (Figure 12‑34) illustrates the transition from ambient to a tank.
To ambient