Odyssey EMSA Kit
Components
| Tube | Reagent | Volume | Storage |
|---|---|---|---|
| 1 | 10X Binding Buffer, 100 mM Tris, 500 mM KCl, 10 mM DTT; pH 7.5 | 500 μL | -20 °C |
| 2 | 25 mM DTT, 2.5% Tween® 20 | 500 μL | -20 °C |
| 3 | Poly (dI•dC), 1 μg/μL in 10 mM Tris, 1 mM EDTA; pH 7.5 | 125 μL | -20 °C |
| 4 | Sheared Salmon Sperm DNA, 0.5 μg/μL in 10 mM Tris, 1 mM EDTA; pH 7.5 | 125 μL | -20 °C |
| 5 | 50% Glycerol | 500 μL | -20 °C |
| 6 | 1% NP-40 | 500 μL | -20 °C |
| 7 | 1 M KCl | 500 μL | -20 °C |
| 8 | 100 mM MgCl2 | 500 μL | -20 °C |
| 9 | 200 mM EDTA, pH 8.0 | 500 μL | -20 °C |
| 10 | 10X Orange Loading Dye | 500 μL | -20 °C |
Storage
Items are shipped on dry ice. Upon receipt, items should be stored as indicated in Components.
Description
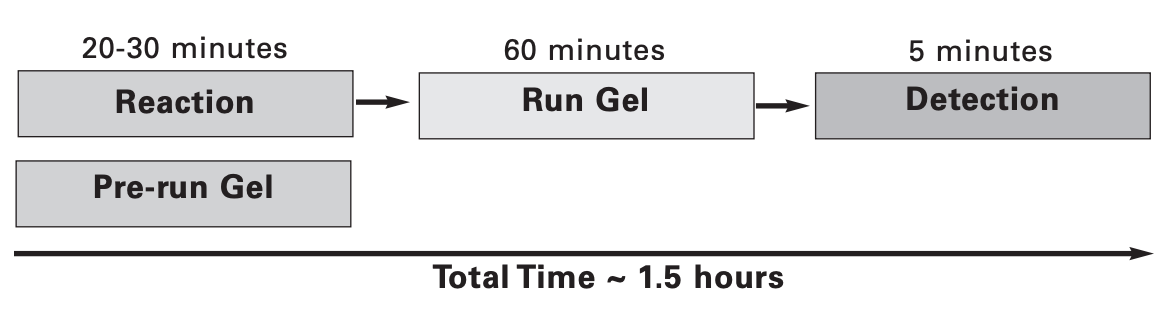
Gel shift assays, also called electrophoretic mobility shift assays (EMSA), provide a simple method to study DNA-protein interactions. This assay is based on the principle that a DNA-protein complex will have different mobility during electrophoresis than non-bound DNA. These shifts can be visualized on a native acrylamide gel using labeled DNA to form the DNA-protein binding complex. To date, protocols require labeling DNA by (1) radioisotope, (2) digoxygenin, or (3) biotin. The Odyssey Infrared EMSA Kit, coupled with IRDye® 700 EMSA oligonucleotides, is an excellent alternative method to radioisotopic and chemiluminescent detection methods for EMSA analysis and visualization (4,5). Using IRDye EMSA reagents, assays can be completed in less than two hours with no gel transfer or film exposure. The gel doesn’t need to be removed from the glass plates for imaging.
Protocol Timeline
Additional Required Materials
IRDye® end-labeled DNA. IRDye 700-labeled, double-stranded DNA oligonucleotides are available from LI-COR for various transcription factors. See www.licor.com/EMSAoligos for the most up-to-date selection, or see IRDye Labeling of DNA Fragments in Section V. for further details on how to obtain IRDye end-labeled oligonucleotides.
DNA must be end-labeled. Internal labels (as generated by random priming) will inhibit DNA-Protein complex formation.
Ultrapure, nuclease-free water
Polyacrylamide gel (5% gel is a good starting point) in Tris-acetate, Tris-borate, or Tris-glycine-EDTA and corresponding electrophoresis buffer
Electrophoresis unit
Odyssey DLx, Odyssey CLx, or Odyssey M Imager
General Methodology for Infrared Electrophoretic Mobility Shift Assay (IR-EMSA)
IRDye® Labeling of DNA Fragments
IRDye 700-labeled, double-stranded DNA oligonucleotides are available from LI-COR for various transcription factors (see www.licor.com/EMSAoligos for the most up-to-date selection). To obtain IRDye end-labeled DNA fragments for other transcription factors of interest, IRDye infrared dye-labeled oligos can be used. It is critical that the DNA fragment is end-labeled rather than having dye incorporated into the DNA. Dye incorporation into the DNA fragment interferes with formation of the DNA-Protein complex.
Synthetic oligonucleotides 5’ end-labeled with IRDye 700 or IRDye 800 are available from several suppliers. Oligonucleotides are manufactured in single-strand form; therefore, both sense and antisense DNA oligonucleotides must be purchased.
Both oligonucleotide sequences should be end-labeled with the same IRDye. There is a significant decline (~70%) in signal intensity when using only one end-labeled oligonucleotide.
Once oligonucleotides are obtained, they need to be annealed to form a double-stranded DNA fragment. Oligonucleotides are annealed by placing the oligonucleotide set in a 100 °C heat block for 5 minutes. Leave the oligonucleotides in the heat block and turn it off to slowly cool to room temperature.
Binding Reaction
A universal binding condition that applies to every protein-DNA interaction is not recommended, since binding conditions are specific for each protein-DNA interaction. You should establish binding reaction conditions for each protein-DNA pair. The Odyssey Infrared EMSA Kit provides all the reagents necessary to optimize an IR-EMSA binding reaction.
Optimized binding reactions for all infrared dye-labeled EMSA-ready oligonucleotides are provided in their pack inserts, along with a suggested positive control nuclear extract. All other IR-EMSA binding reactions will need further optimization. Optimization can be done by adding supplementary components to the binding buffer supplied in this kit. This can be done using the binding reaction setup in Table 1. Reactions should be set up and added in the order listed in Table 1.
In some cases, DNA control reactions (no protein) were observed to have lower signal than reactions containing protein. This may be due to lower stability of the dye in certain buffer conditions. The addition of DTT and Tween® 20 to all reactions reduces this phenomenon.
Reactions are incubated to allow protein binding to DNA. Time required for binding is the same as when radioactively-labeled DNA fragments are used. A typical incubation condition is 20 - 30 minutes at room temperature. Because IRDye infrared dyes are sensitive to light, it is best to keep binding reactions in the dark during incubation periods (e.g., put tubes into a drawer or simply cover the tube rack with aluminum foil). After the incubation period, 2 μL of 10X Orange Loading Dye (Tube 10) should be added to the 20 μL EMSA reaction.
Do not use blue loading dye (e.g., bromophenol blue), because it will be visible when imaged on an Odyssey Imager.
| Component | Reaction | |||||||
|---|---|---|---|---|---|---|---|---|
| 1 | 2 | 3 | 4 | 5 | 6 | 7 | 8 | |
| Ultra Pure water | 14 μL | 13 μL | 12 μL | 12 μL | 12 μL | 12 μL | 12 μL | 12 μL |
| 10X Binding Buffer (Tube 1) | 2 μL | 2 μL | 2 μL | 2 μL | 2 μL | 2 μL | 2 μL | 2 μL |
| 25 mM DTT/2.5% Tween® 20 (Tube 2) | 2 μL | 2 μL | 2 μL | 2 μL | 2 μL | 2 μL | 2 μL | 2 μL |
| 1 μg/μL Poly (dI•dC) (Tube 3) | 1 μL | 1 μL | 1 μL | 1 μL | 1 μL | 1 μL | 1 μL | 1 μL |
| Optional components | ||||||||
| 0.5 μg/μL Salmon Sperm DNA (Tube 4) | - | - | 1 μL | - | - | - | - | - |
| 50% Glycerol (Tube 5) | - | - | - | 1 μL | - | - | - | - |
| 1% NP-40 (Tube 6) | - | - | - | - | 1 μL | - | - | - |
| 1 M KCl (Tube 7) | - | - | - | - | - | 1 μL | - | - |
| 100 mM MgCl2 (Tube 8) | - | - | - | - | - | - | 1 μL | - |
| 200 mM EDTA (Tube 9) | - | - | - | - | - | - | - | 1 μL |
| IRDye end-labeled oligo (50 nM) | 1 μL | 1 μL | 1 μL | 1 μL | 1 μL | 1 μL | 1 μL | 1 μL |
| Protein Extract (5 μg/μL) | - | 1 μL | 1 μL | 1 μL | 1 μL | 1 μL | 1 μL | 1 μL |
| Total Volume | 20 µL | 20 µL | 20 µL | 20 µL | 20 µL | 20 µL | 20 µL | 20 µL |
Electrophoresis
For best results, perform electrophoresis in dark (simply put a cardboard box over the electrophoresis apparatus).
Separation of protein-DNA complexes is usually performed by loading binding reactions onto native polyacrylamide gels. Percentage of the gel depends on the protein size and DNA fragment, but a 5% gel is a good starting point. Electrophoresis is usually performed at 10 V/cm at room temperature or at 4 °C in Tris-acetate, Tris-borate, or Tris-glycine-EDTA gel and buffer.
Imaging
Find imaging information for your Odyssey Imager and imaging software at licor.com/support.
Quantification
When quantifying Odyssey-generated EMSA data, great care must be taken in experimental design and analysis.
One of the benefits of using Odyssey for EMSA analysis is that it provides an easy method for quantification. However, there are issues to consider when using Odyssey to quantify EMSA results. The primary issue is that the free DNA fragment has much less signal than the DNA fragment when bound to a protein, making quantification of the unbound DNA inaccurate. The addition of DTT/Tween® 20 to the binding reaction stabilizes the dye and reduces this phenomenon.
In addition, it is unrealistic to perform quantification analyses under the assumption that the free DNA band in the control containing DNA only (no extract), should equal the sum of the signals of the free and bound DNA in the samples where the protein-DNA binding reaction occurs. Using end-labeled oligonucleotide duplexes as the DNA source and nuclear extract as a protein source render this assumption impractical, due to the non-specific binding that occurs from using a nuclear extract. Oligonucleotides can also complicate quantification because the free oligonucleotides form a smear rather than a tight band. This makes it more difficult to assign an intensity value to the bands.
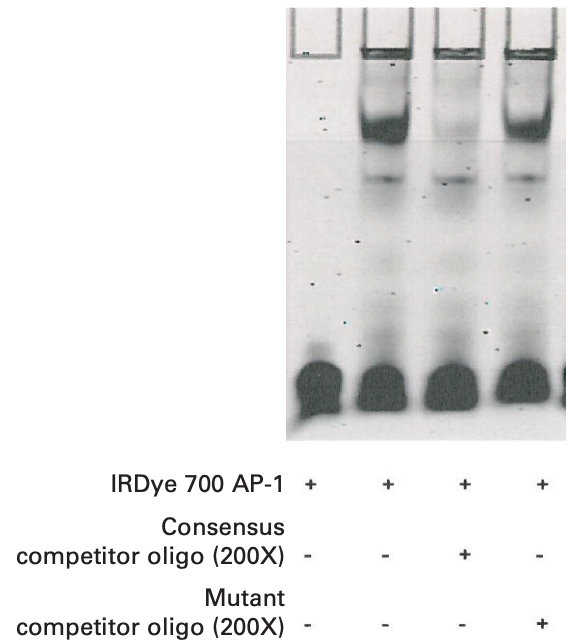
Mobility Shift Example Experiment Using IRDye® 700 AP-1 Consensus Oligonucleotide
Prepare and Pre-Run Gel
Use a pre-cast 5% TBE native acrylamide gel, or prepare a native acrylamide gel in 0.5X TBE.
Pre-electrophorese gel in 0.5X TBE for 30 minutes at 70 V (for a 9 x 7 cm gel) or 10 V per cm gel.
While gel is pre-running, proceed to Binding Reaction steps.
Binding Reaction
Reactions should be set up and added in the order listed.
Component Reaction 1 2 3 4 Ultra Pure water 12 μL 12 μL 9 μL 9 μL 10X Binding Buffer (Tube 1) 2 μL 2 μL 2 μL 2 μL 25 mM DTT/2.5% Tween® 20 (Tube 2) 2 μL 2 μL 2 μL 2 μL 1 μg/μL Poly (dI•dC) (Tube 3) 1 μL 1 μL 1 μL 1 μL 1% NP-40 (Tube 6) 1 μL 1 μL 1 μL 1 μL 100 mM MgCl2 (Tube 8) 1 μL 1 μL 1 μL 1 μL 200X Consensus Competitor Oligo 0 μL 0 μL 1 μL 0 μL 200X Mutant Competitor Oligo 0 μL 0 μL 0 μL 1 μL IRDye 700 AP-1 Consensus Oligonucleotide 1 μL 1 μL 1 μL 1 μL HeLa 4-hr Serum Response Nuclear Extract (2.5 μg/μL) - 2 μL 2 μL 2 μL Total Volume 20 µL 20 µL 20 µL 20 µL Gently mix tube by tapping the sides of the tubes.
Briefly centrifuge sample into the bottom of the tube.
Place tubes in box or drawer protected from light, and incubate for 20 minutes at room temperature.
Add 2 μL of 10X Orange Loading Dye (Tube 10) to each reaction tube. Gently pipette to mix.
Electrophoresis
Turn off pre-running gel current.
Flush gel wells with 50 μL of electrophoresis buffer.
Load 20 μL of each sample reaction into the wells of the gel.
Turn on current to 70 V (or 10 V per cm of gel)
Cover gel box with dark box.
Electrophorese for 1 hour or until orange dye migrates to the bottom of the gel.
Example Data
Troubleshooting
Weak or No Signal
| Possible Cause | Solution / Prevention |
|---|---|
| Did not add DTT/ Tween® 20 to binding reaction | Add 1 μL of 25 mM DTT/ 2.5% Tween® 20 to binding reaction |
| Not enough IRDye® dye- labeled DNA used | Increase amount of IRDye dye-labeled DNA added to the reaction |
| Target DNA degraded | Verify integrity of DNA |
| Imaged in the wrong channel of the Odyssey | When using IRDye 700-labeled DNA, turn on the 700 nm laser |
No Shifted Bands Detected or Weak Signal
| Possible Cause | Solution / Prevention |
|---|---|
| Incorrect Focus Offset | Adjust the acquisition Focus Offset to equal the thickness of the glass plate plus half the thickness of the gel and scan again |
| DNA/Protein complex disrupted due to heat or vortexing | Run gel with cooled buffer Do not vortex binding reaction |
| Not enough extract | Add more extract to reaction |
| Degraded extract | Minimize freeze-thaw cycles Use protease inhibitors |
| System not fully optimized | Use additives in the kit to determine their effects on binding efficiency |
Spots or Speckling
| Possible Cause | Solution / Prevention |
|---|---|
| Contamination on glass surfaces | Clean glass gel plates and the Odyssey scanning surface with isopropanol |
References
Wolf, S.S., Hopley, J.G., and Schweizer, M. (1994) The application of 33P-labeling in the Electrophoretic mobility shift assay. Biotechniques 16, 590 - 592.
Suske, G., Gross, B., and Beato, M. (1989) Non-radioactive method to visualize specific DNA-protein interactions in the band shift assay. Nucleic Acids Res. 17, 4405.
Ludwig, L.B., Hughes, B.J., and Schwartz, S.A. (1995) Biotinylated probes in the electrophoretic mobility shift assay to examine specific dsDNA, ssDNA or RNA-protein interactions. Nucleic Acids Res. 23, 3792 - 3793.
Li, Y., Ahmed, F., Ali, S., Philip, P.A., Kucuk, O., and Sarkar, F.H. (2005) Inactivation of nuclear factor κB by soy isoflavone genistein contributes to increased apoptosis induced by chemotherapeutic agents in human cancer cells. Cancer Res. 65: 6934 - 6942.
Geddie, M.L., O’Loughlin, T.L., Woods, K.K., and Matsumura, I. (2005) Rational design of p53, and intrinsically unstructured protein, for the fabrication of novel molecular sensors. J. Biol. Chem. (M508149200).