Tissue section imaging is vital to advancing scientific understanding across many disciplines. In clinical and research settings, scientists use tissue sections to diagnose illnesses, to assess therapeutic agent colocalization, to understand diseases, and to characterize treatments.
Tissue section imaging is useful to study diseased tissue and to identify localization and expression of biological targets ex vivo. Targets can be proteins, DNA/RNA, or labeled small molecules. There are a variety of methods for target detection, including antibody-based detection, visible stains, and labeled probes. Consecutive tissue sections allow for analysis of changes at different tissue depths, and imaging of multiple tissue sections at once lets you triage slides for downstream microscopy analysis. With the appropriate equipment, you can assess both the macro- and micro-locations of your target.
Plan to image slides on an epifluorescent microscope? See our requirements to get you started.The Odyssey® M and Odyssey DLx Imagers can perform macroscopic imaging of multiple tissue section slides at once, allowing for high-throughput detection of tissue- or region-specific localization and expression of targets. Additionally, Odyssey imagers provide an industry-leading 6 logs of dynamic range, and the line scanning technology of the Odyssey M delivers exceptionally fast acquisitions of tissue section images.
| Instrument | Resolution | Channels | Stains |
|---|---|---|---|
| Odyssey DLx and Odyssey CLx | 21 μm | 700, 800 | Fluorescent |
| Odyssey M | 5 μm | 488, 520, 700, 800, and RGB Trans (470, 525, 630) | Fluorescent and colorimetric (e.g., H&E stain) |
For tissue section imaging, a tissue or organ is excised, embedded to preserve it, cut into sections, stained, and then mounted onto slides for imaging. If you are tracking a therapeutic agent or optical probe, you would introduce those before excising the tissue. Proteins or other targets of interest—such as mRNA, RNA, and DNA—can then either be directly detected by the labeled agent or with the aid of dye-labeled antibodies, optical probes, or visible stains, such as H&E stain or Alcian blue. Finally, image the tissues using an imager, such as the Odyssey M Imager.
For more detailed steps, check out the Tissue Section Imaging Protocol.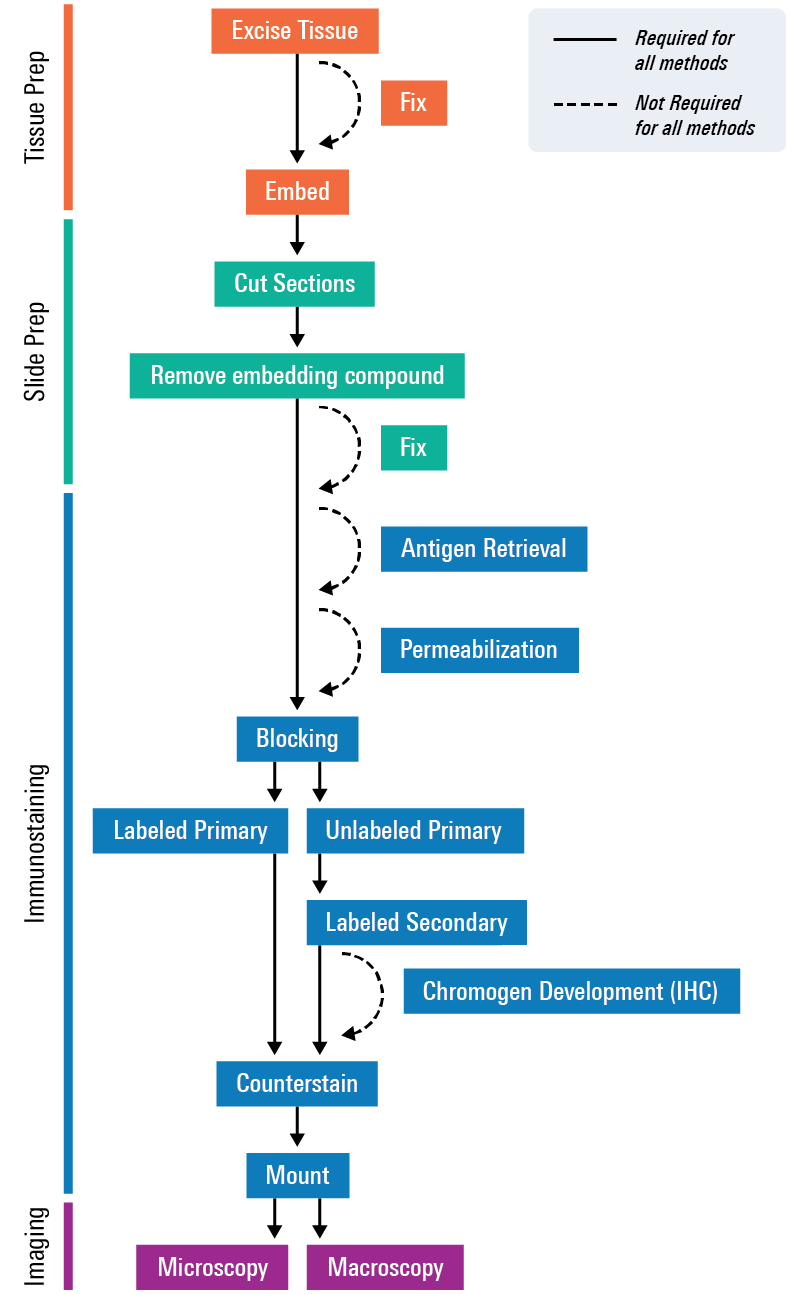


Two applications for tissue section imaging are therapeutic development and optical probe development. In therapeutic development, scientists use tissue sections to determine the presence, absence, or progression of diseased tissue, such as cancer. Tissue sections also aid in characterizing the efficacy, toxicity, specificity, and biodistribution of a therapeutic agent or optical probe.
In both types of studies, tissue section imaging can help researchers profile disease pathology.
Tissue section imaging is vital to the development of therapeutics. A therapeutic agent is a specific molecule that can be used in the treatment or mitigation of a disease or condition. For instance, a therapeutic agent may be used for cancer therapy because it can be designed to act on a cancer-associated target.
Check out the Therapeutics Development page for more information.In the development of therapeutics, tissue section imaging differs from optical probe development in significant ways. Instead of simply determining whether the therapeutic agent has reached the desired destination, researchers developing therapeutics seek to characterize the efficacy, toxicity, or specificity of an agent upon arrival. Additionally, researchers often identify the therapeutic agent by staining the tissue rather than detecting a molecule conjugated to a fluorescent dye.
Tissue section imaging is important to optical probe development because it helps verify if a probe has reached its intended destination within a tissue. First, a dye such as IRDye® Infrared Fluorescent Dye is conjugated to a molecule, forming an optical probe. Researchers then introduce the probe into an animal. Because the dye allows researchers to track the probe’s movement, researchers can record the probe’s in vivo activity using an imager, such as the Pearl® Trilogy Small Animal Imager. Finally, tissue section imaging verifies the optical probe’s tissue location ex vivo.
Once a therapeutic agent or optical probe has reached its destination, the tissue is excised, sectioned, and—if necessary—stained before imaging.
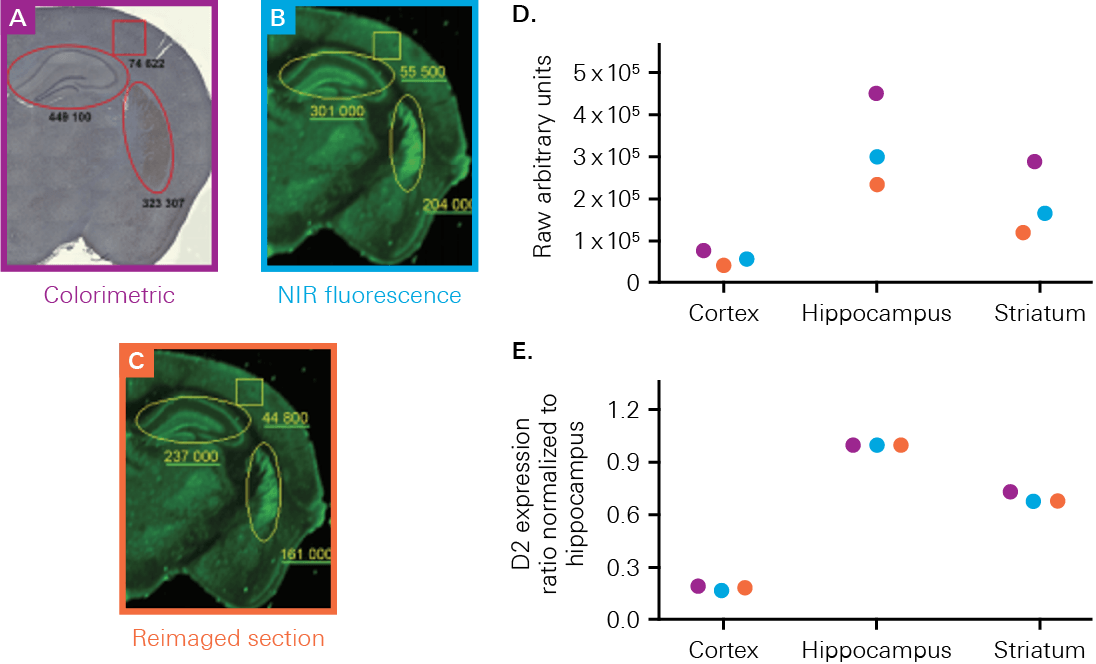
The Odyssey M, Odyssey DLx, and Odyssey CLx enable you to validate your therapeutics or probes with high-quality in vitro or ex vivo imaging. These imagers can measure uptake, localization, and biodistribution within the tissue section or organ. For example, a study by Kearn, C.S., used an Odyssey Imager to determine receptor expression and colocalization in a mouse brain to better understand Huntington’s disease markers (Figure 1).

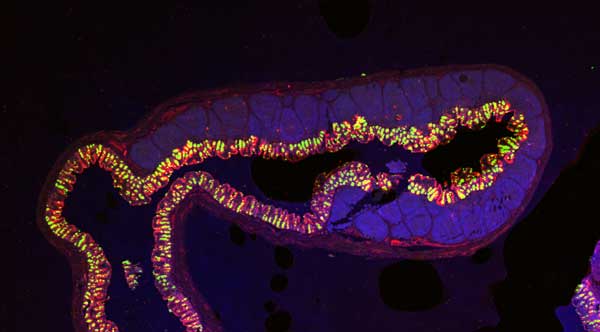
Immunofluorescent staining is a common technique to detect a target, such as an antigen, therapeutic agent, or optical probe, in tissue. Immunofluorescent staining uses fluorescently labeled antibodies that bind specifically to the target to directly or indirectly determine tissue- or region-specific localization and expression of targets.
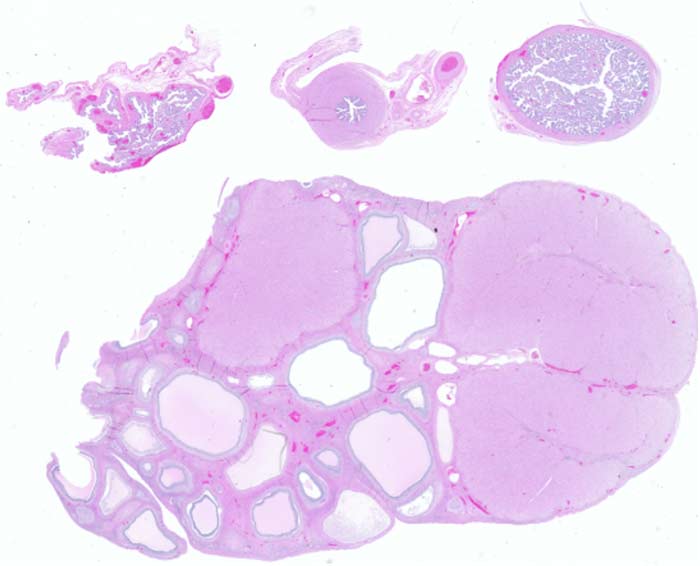
Scientists use histological staining to create contrast in tissue features. Histological stains, such as H&E stain, Alcian blue, and Evans blue, allow for the study of tissue structure and help identify the presence or absence of diseased tissue at the macroscopic level.