Quantitative Immunofluorescent Assays Using Fluorescent Imaging

In-Cell Western Assay

Looking for step-by-step instructions to develop your assay? Get your free copy of the In-Cell Western Assay Development Handbook.
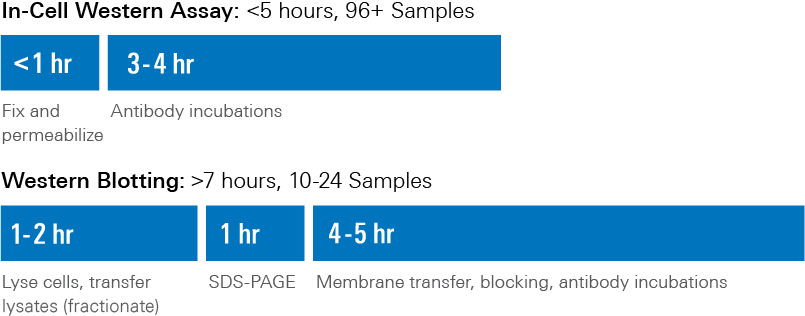
Download

The In-Cell Western Assay is a quantitative immunofluorescence assay performed in multiwell plates (optimized for 96- or 384-well format) that combines the specificity of Western blotting with the replicability and throughput of ELISA.

In-Cell Western Assays are also called cytoblots, cell-based ELISA, In-Cell ELISA (ICE), and FACE (Fast Activated Cell-based ELISA). With In-Cell Western Assays, you can:

  • Detect proteins in fixed and permeabilized cells using target-specific primary antibodies and IRDye® Secondary Antibodies
  • Quantify multiple targets using spectrally distinct fluorescent dye conjugates
  • Quickly, accurately measure relative protein levels in many samples
  • Detect proteins in situ in a relevant cellular context
  • Normalize to cell number, allowing for accurate quantification and comparison of protein expression between wells

Empiria Studio® Software has step-by-step workflows and Plate Templates for various types of multiwell plate assays, including the In-Cell Western Assay. These straightforward and systematic workflows in Empiria Studio automate the critical steps of your analysis. For In-Cell Western Assays, create a custom template or use one of the six preset templates for:

  • Cell Stain Linearity: Ensure signal intensity for the normalization method and target are each detected within their linear range
  • Antibody Titration: Determine the antibody concentration that provides optimal signal and lowest background
  • Blocker Evaluation: Determine the best blocking buffer or blocking buffer and antibody combination for an experiment
  • Fixation and Permeabilization Evaluation: Determine the optimal fixation and permeabilization conditions for an experiment
  • Z′-Factor Determination: Test the quality and robustness of an assay
  • Target Analysis: Quantify the effect of a treatment or condition on a target

In-Cell Western Assay and Western Blotting Workflow Comparison

ICW and Western Blotting Time Comparison

How Does the In-Cell Western Assay Work?

The In-Cell Western Assay is based on standard immunofluorescent methods.

  1. Seed cells in multiwell plate
  2. Cell treatment (optional)
  3. Fix cells
  4. Permeabilize cells
  5. Block cells
  6. Prepare primary antibody solution
  7. Incubate primary antibody solution
  8. Wash plate
  9. Prepare secondary antibody solution and cell stain, such as CellTag™ 520 Stain or CellTag 700 Stain
  10. Incubate secondary antibody solution and cell stain
  11. Wash plate
  12. Image multiwell plate

See an example of a typical In-Cell Western workflow.

In-Cell Western Assays are Replicable and Precise

In-Cell Western Assays provide greater replicability and precision than Western blots. In-Cell Western Assays exhibit the following characteristics:

  • Shorter protocol
  • Significantly smaller standard deviations
  • Replicate measurements with very low coefficients of variation (CVs) (Figure 1)
  • Easily run many replicates to increase accuracy (Figure 2)
  • Characterize a broad range of cell signaling parameters
  • Very similar profiles of signal increase and decrease when compared to Westerns
  • Produces excellent Z′-Factor with optimized conditions and experimental design

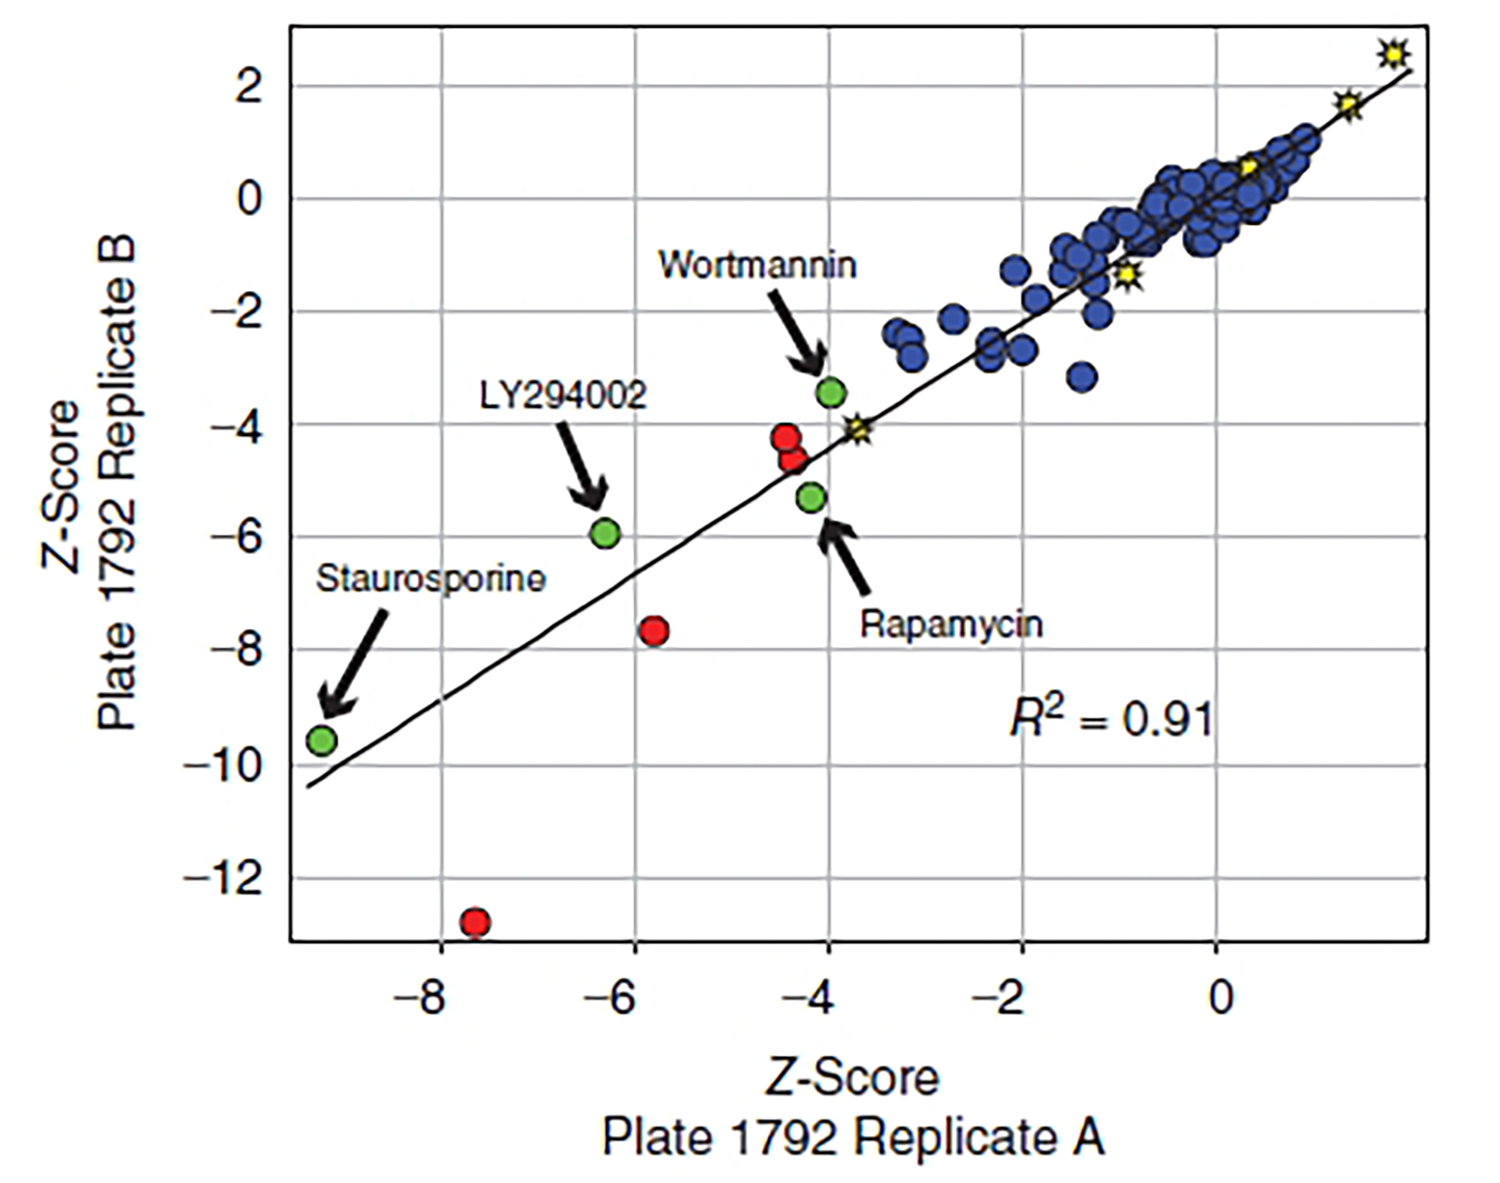
Z′-Factor is a measure of statistical effect size and can be used to assess if a response to an assay requires further investigation. Z′-Factor can provide some indication of the replicability of an assay. Z′ is calculated by running a large number of positive and negative controls and determining how much separation there is between positive and negative controls. If they overlap, or nearly overlap (Z′ < 0.5), due to large amounts of variation within the controls, the assay is useless for screening. An excellent assay exhibits good separation between positive and negative controls (Z′ > 0.5).2, 4, 5

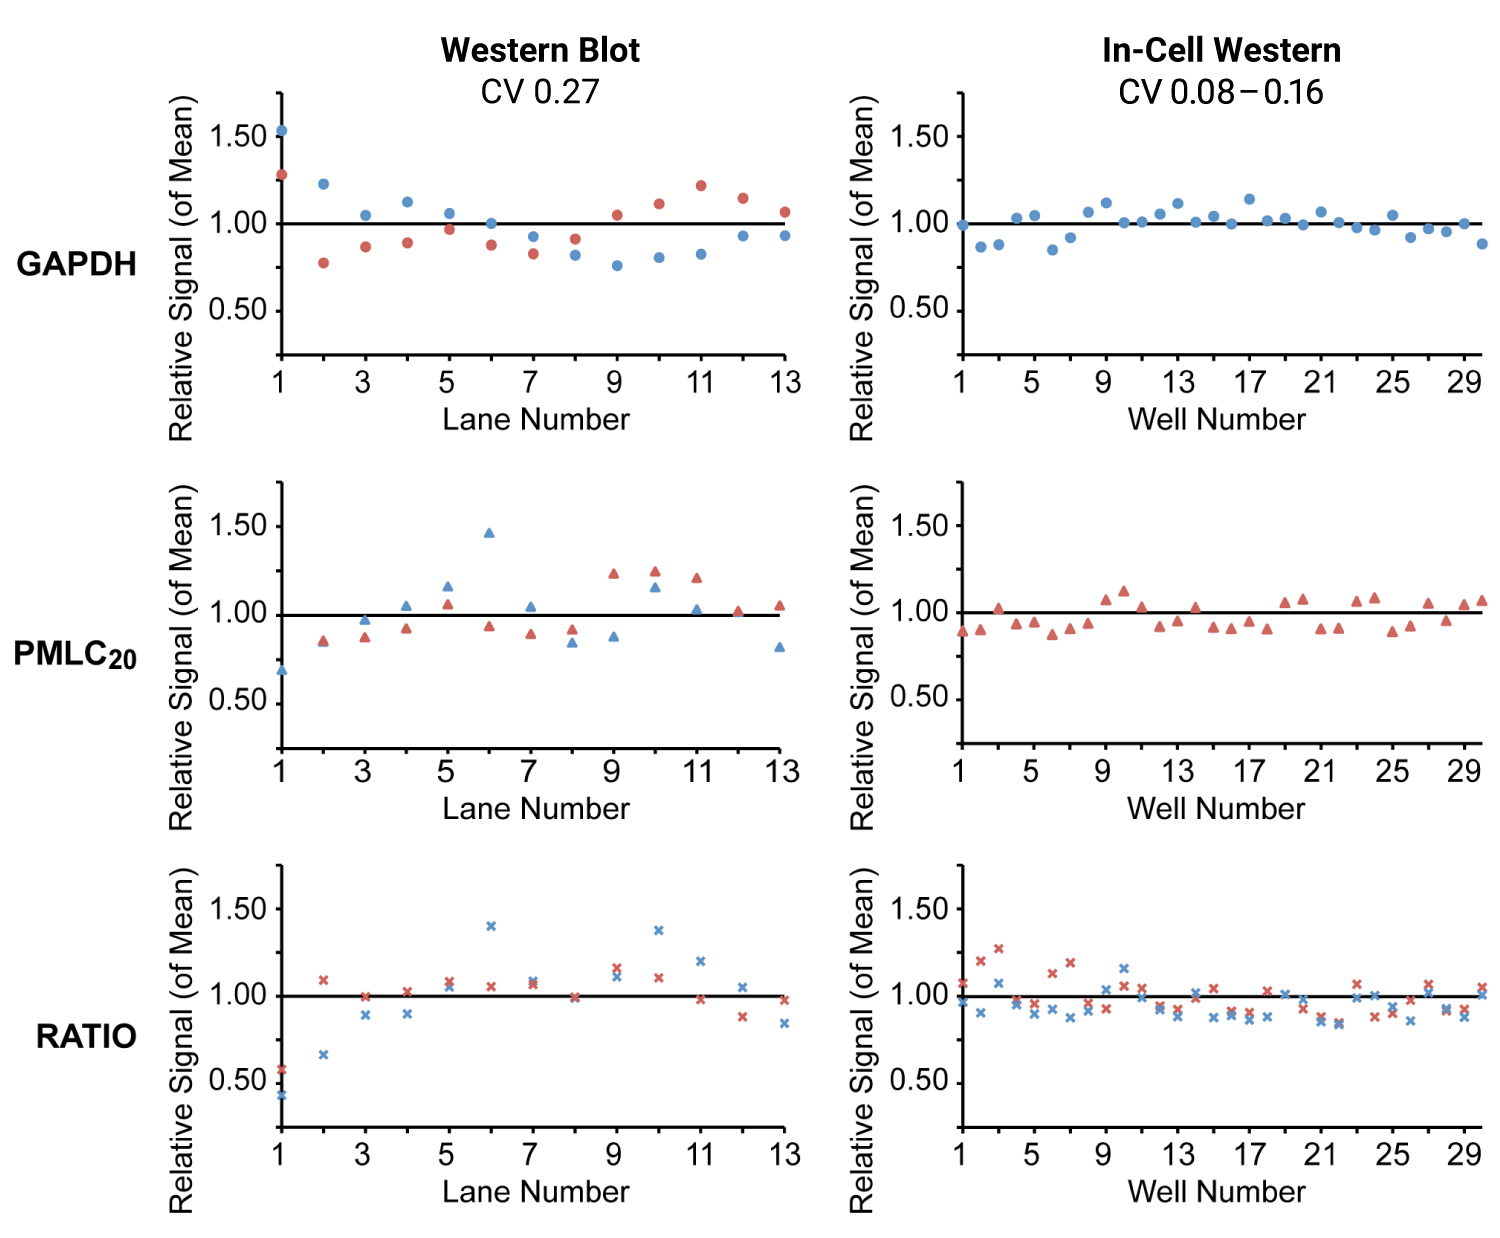
A 2010 study compared In-Cell Western Assays and Western blotting (WB) for measurement of phosphorylated myosin regulatory light chain (PMLC20).1 Primary cultures of uterine myocytes stimulated with oxytocin were used to assess specificity, sensitivity, and precision of the two methods for phospho-analysis.

In-Cell Western Assay and Western blot analysis yielded very similar results (Figure 1). In-Cell Western Assays offered superior precision, reduced variability, and smaller CVs.

figure 3
Figure 1. Intra-assay variability of Western blots and In-Cell Western Assays. A) GAPDH and PMLC20 were detected on duplicate Western blots (13 replicates per blot, not shown). Band intensities are expressed as a proportion of the mean of the thirteen samples on each blot (blot 1 in blue, blot 2 in red). CV was 0.27. B) Signal intensities from In-Cell Western wells are plotted as a proportion of the mean values for each of two plates (plate 1 in blue, plate 2 in red). CV ranged from 0.08 to 0.16.1
figure 4
Figure 2. Replicability of In-Cell Western Assay for siRNA screening via a correlation plot. A pilot small molecule siRNA screen was performed for inhibitors of mTORC1 signaling. A library of ~2500 known bioactive compounds was used. Compounds with average Z-score < -2 are considered hits (red circles). Known inhibitors of mTORC1 signaling found in the library are shown in green. Plate-to-plate consistency is shown for a representative plate from the library. R2 = 0.91, indicating exceptional plate-to-plate reproducibility. Adapted with permission from Hoffman, GR et al.2

Correlation of In-Cell Western Assays with Other Assays

In-Cell Western Assay results correlate well with immunoblot results and other assays.

Correlation of In-Cell Western Assays with Western Blots

The In-Cell Western Assay can be used to screen inhibitors for determining IC50 or enhancement or stimulation factors for determining EC50. Compared to Western blotting, In-Cell Western Assays display:

  • Very similar profiles of signal increase and decrease, and similar IC50 values and sensitivity
  • Improved replicability and precision1
    • Significantly smaller standard deviations
    • Replicate measurements with very low CVs
  • Higher throughput, to easily process many samples or replicates in parallel

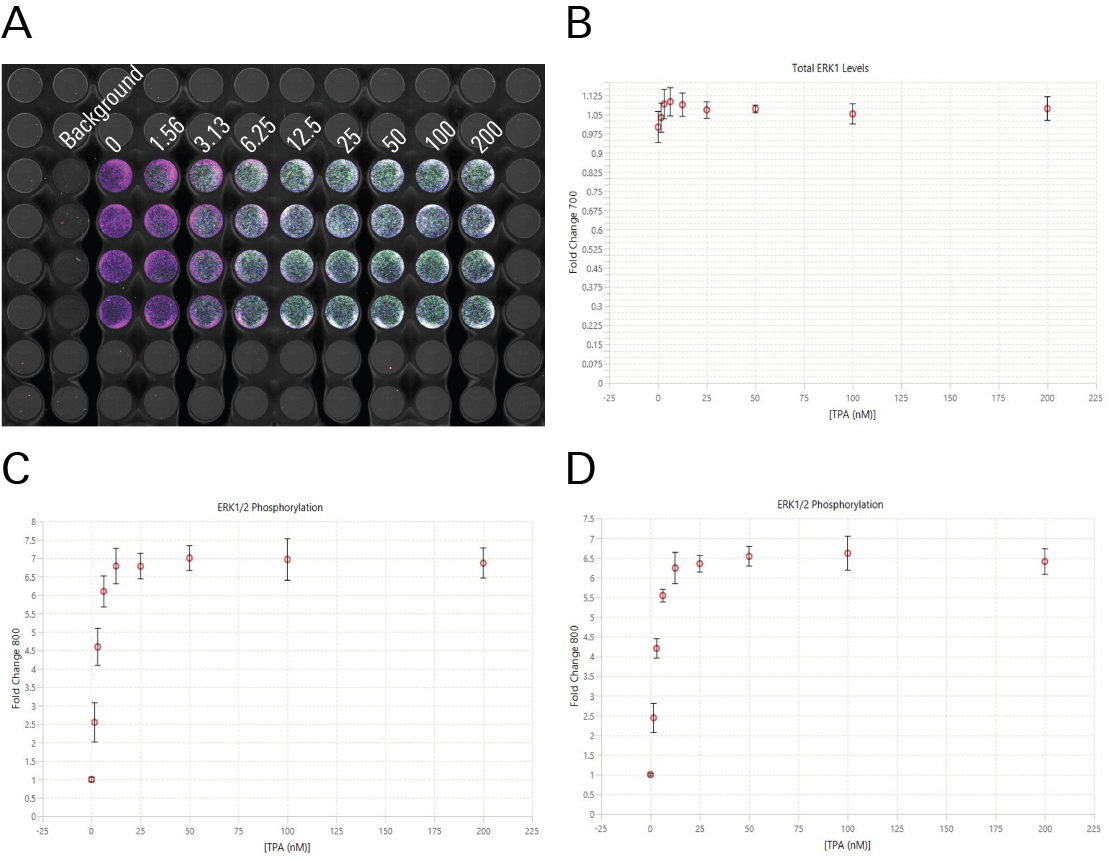
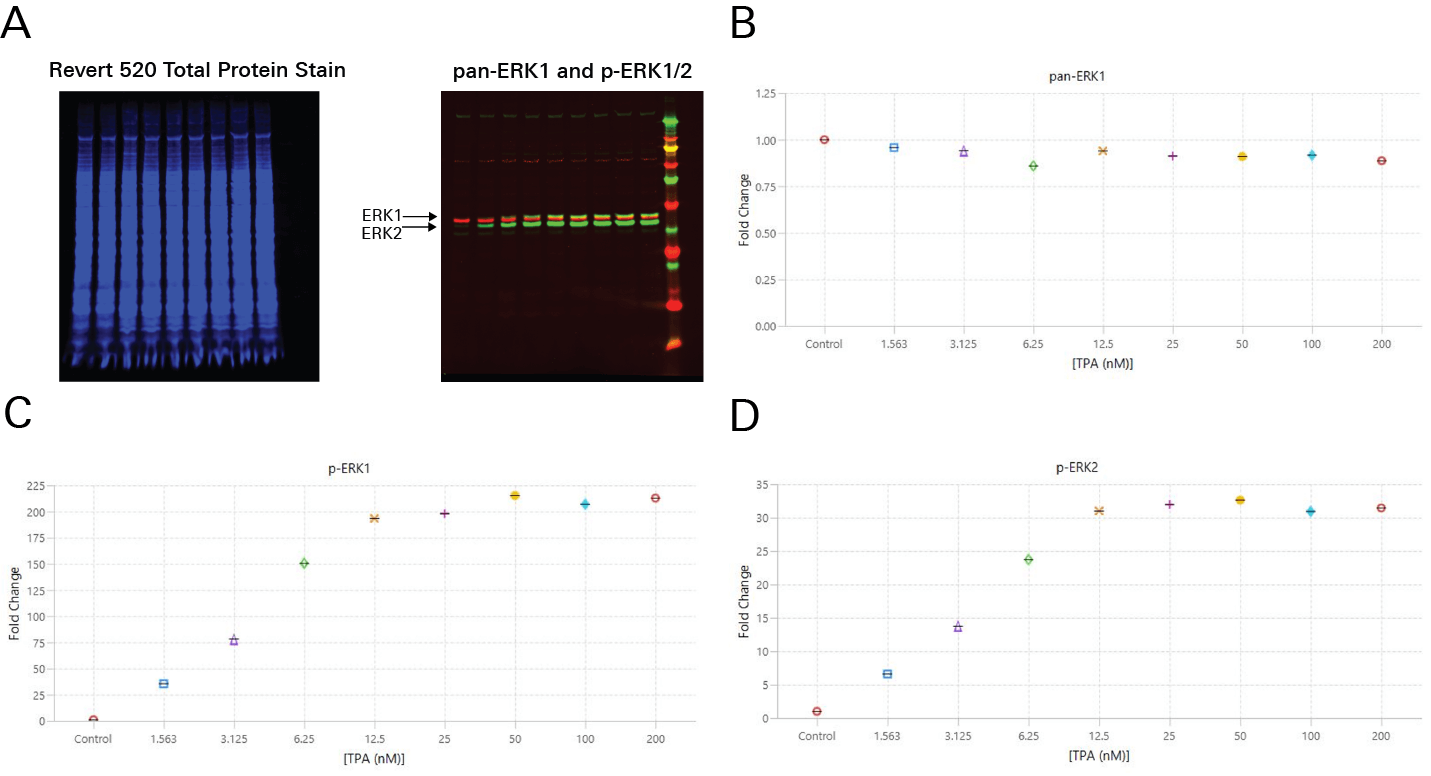
In Figure 3 and Figure 4, TPA dose response was assessed by In-Cell Western Assay and Western blot. In-Cell Western EC50 values were calculated (Figure 3) that closely match the EC50 values calculated in a Western blot analog (Figure 4).8

figure 5
Figure 3. EC50 values were calculated that match expected results. A) The multiwell plate is shown for this In-Cell Western Assay with the amount of TPA used to treat wells shown in nM. Wells in the same column are technical replicates. B) In this chart, pan-ERK1 signal is normalized to CellTag 520 Stain, and the fold change for pan-ERK1 treatments are calculated with the 0 nM treatment as the denominator. The 0 nM treatment is set as the Control on the Set up charts page in the Empiria Studio Software Target Analysis workflow. C) p-ERK1/2 signals are normalized to CellTag 520 Stain. The fold change is calculated the same way as described in part A. The EC50 value is 2.6nM (calculated outside of Empiria Studio Software). D) p-ERK1/2 signals are normalized to panERK1. Fold change is calculated as described in part A. The EC50 value is 2.7 nM (calculated outside of Empiria Studio Software).
figure 5
Figure 4. EC50 values were calculated that match expected results. A) Western blot images for this assay are shown. The 520 nm channel with Revert™ 520 Total Protein Stain is shown on the left, and the 700 and 800 nm channels with pan-ERK1 and p-ERK1/2 bands are shown overlaid on the right. B) In this chart, pan-ERK1 signal is normalized to Revert 520 Total Protein Stain, and the fold change for pan-ERK1 treatments are calculated with the 0 nM treatment as the denominator. The 0 nM treatment is set as the Control on the Set up charts page in the Empiria Studio Software Western blot Target Analysis workflow. C) p-ERK1 signals are normalized to Revert 520 Total Protein Stain. The fold change for p-ERK1 is calculated using the same method described in part B for pan-ERK1. The EC50 value is 4.3nM (calculated outside of Empiria Studio Software). D) p-ERK2 signals are normalized to Revert 520 Total Protein Stain. The fold change for p-ERK2 is calculated using the same method described in part B for pan-ERK1. The EC50 value is 3.9 nM (calculated outside of Empiria Studio Software).

IC50 from In-Cell Western Assays Correlate Well with Published Values from Other Assays

GPCR activity assays primarily monitor upstream signaling events, such as accumulation of cyclic AMP (cAMP). Downstream events, such as phosphorylation of cAMP response element binding protein (CREB), may also be useful readouts.3, 6

The In-Cell Western method is commonly used to assess IC50 and has been shown to produce comparable IC50 results to other assays, such as radioligand binding affinities and cAMP accumulation assays.3

Method of IC50 Determination Result
CREB In-Cell Western (pKB) 8.72±0.13
cAMP ELISA (pKB) 8.72±0.07
Radioligand binding assay (pKi) 8.40±0.05
Table 1. pKi, the negative log of the inhibition constant of a drug; pKB, the negative log of the dissociation equilibrium constant for a competitive antagonist; ap, apparent; CREB, cAMP response element binding protein.3

Typical In-Cell Western Assay Workflow

Culture cells

cells cultured in microplate

Stimulate or inhibit cells

stimulate cells in plate

Fix and permeabilize cells

cells are permeabilized

Incubate with blocking buffer

blocking buffer added

Incubate with primary antibody

primary antibody added

Incubate with secondary antibody

secondary antibody added

Excite with infrared lasers

lasers excite dye

Acquire Image with Odyssey Imager and Analyze

image acquired

Normalization of In-Cell Western Assays

Normalization makes In-Cell Western analysis more precise by correcting for well-to-well variation in cell number.

Choose the normalization approach that best suits your experiment.

Normalize to Post-Translational Modification

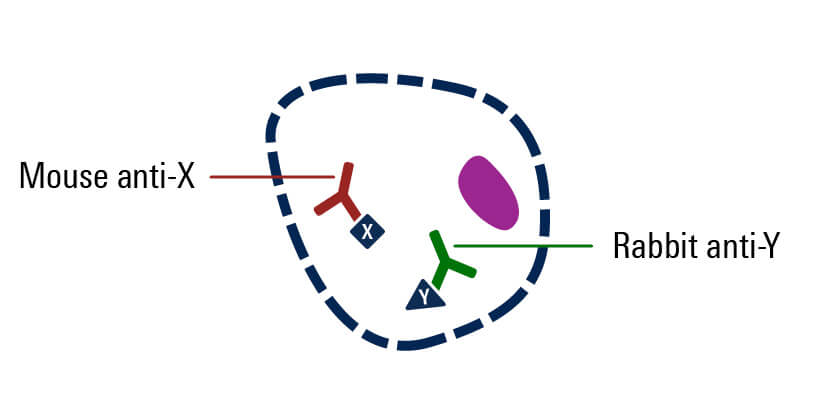
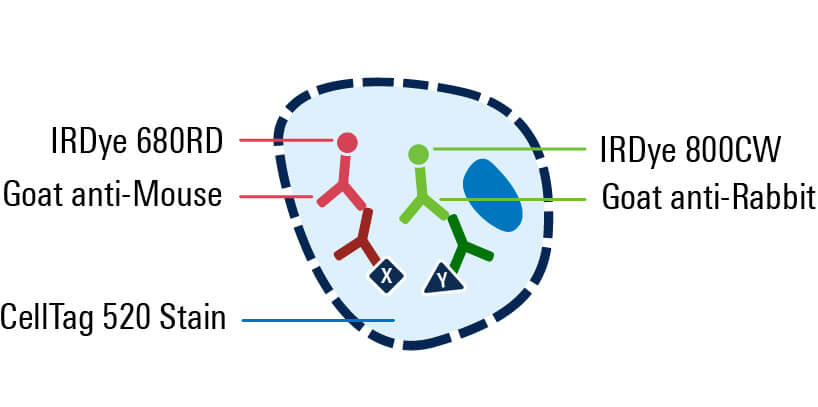
Post-translational modification (PTM) normalizes to a specific modification of a target protein against all target protein, regardless of modification. The target protein is used as its own internal control.

PTM normalization employs two primary antibodies raised in different hosts:

  • One modification-specific antibody that recognizes the modified form of the target.
  • One pan-specific antibody that recognizes all target regardless of modification.

To simultaneously detect multiple target proteins in the In-Cell Western Assay, you must use secondary antibodies labeled with different fluorophores (e.g., IRDye 680RD Secondary Antibodies for 700 nm channel and IRDye 800CW Secondary Antibodies for 800 nm channel).

Combined Detection of Pan Protein and Phospho-protein Levels

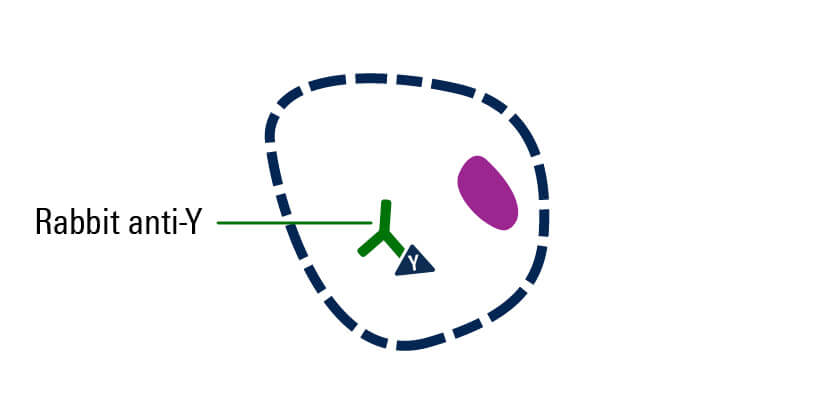
It may be possible to use the target protein as its own internal control for detection of a phospho-protein.

  • Total levels of the target protein and extent of phosphorylation of the target are measured simultaneously.

  • Combine the phospho-antibody with a "total protein" antibody that recognizes the target protein regardless of its phosphorylation status. For example, use mouse anti-total Akt and rabbit anti-phospho-Akt.
  • This method also corrects for changes in target protein abundance that may be caused by cell treatments.
  • When using two antibodies against the same target, antibody interference may occur (one antibody blocks binding of the other antibody). Controls to rule out antibody inference are very important.

Normalization to Cell Number

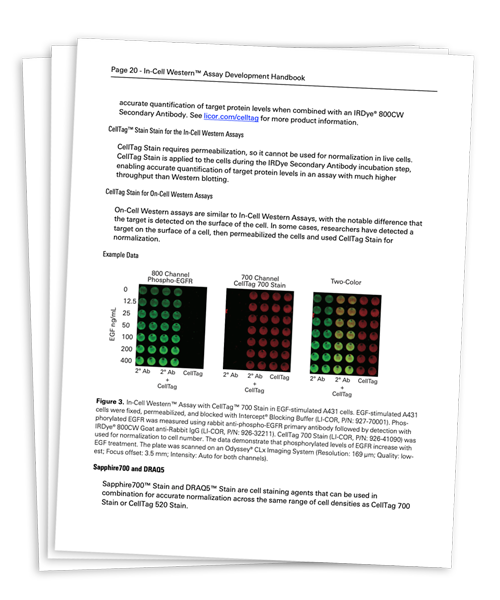
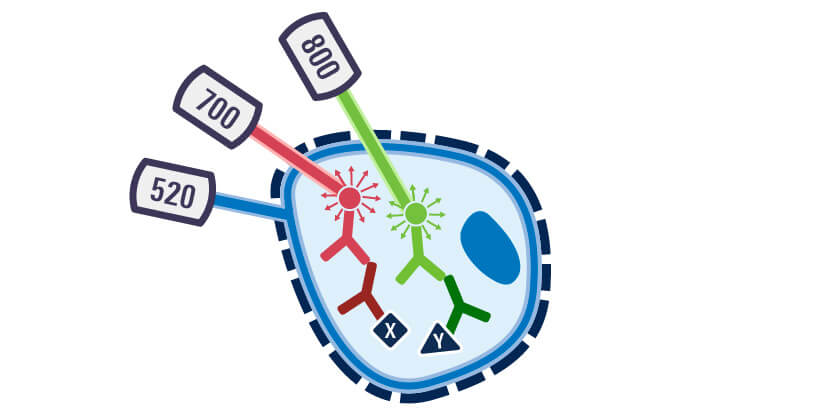
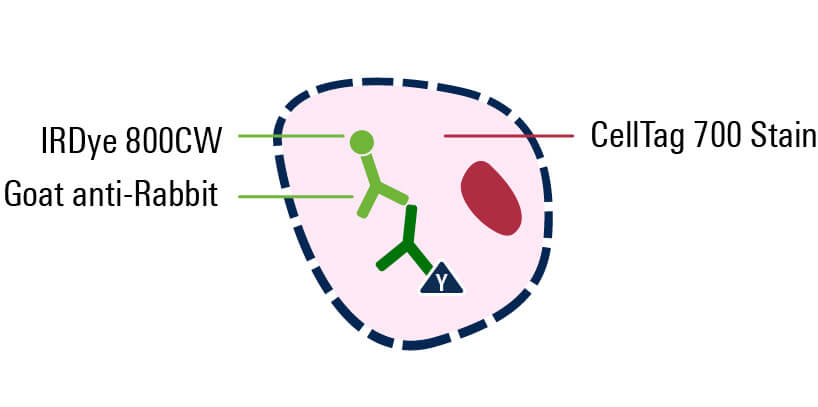
Cell number normalization is a fast and inexpensive approach because no additional antibodies are required. Options include staining with CellTag 700 Stain or CellTag 520 Stain.

CellTag Staining

CellTag 700 Stain and CellTag 520 Stain are near-infrared fluorescent cell stains that provide accurate estimation of cell number for In-Cell Western Assay applications. The stain accumulates in both the nucleus and the cytoplasm of permeabilized cells and provides linear fluorescent signal across a wide range of cell types and cell membranes. This method is fast and easy because staining is combined with secondary antibody incubation.

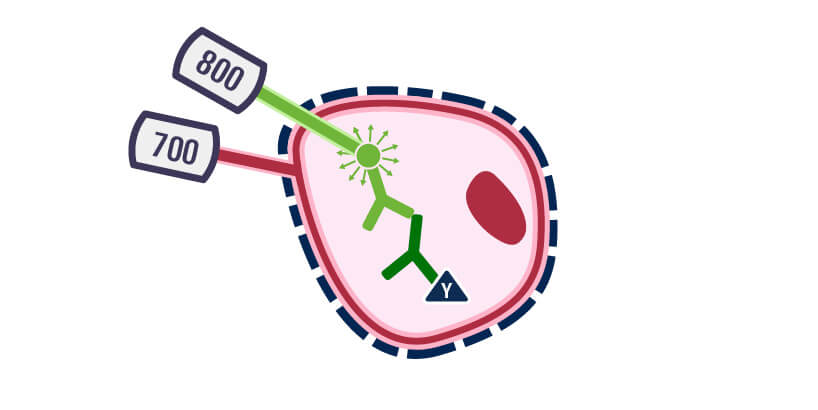
CellTag stains are ideal internal controls for most In-Cell Western Assays because of their broad linear ranges and need for minimal validation. For example, CellTag 700 Stain is ideal for 2-color In-Cell Western Assays, in which the protein of interest is detected in the 800 nm channel and the internal control in the 700 nm channel. If your imager can capture visible fluorescence, such as the Odyssey® M Imager, then CellTag 520 Stain is ideal because it helps detect two proteins of interest in the 700 and 800 nm channels and the internal control in the 520 nm channel.

Cell Labeling with Reactive Dye

Using this method, cells are covalently labeled using cellular lysine residues on cellular proteins with IRDye 800CW Infrared Dyes.7 Cell labeling is an inexpensive method with high sensitivity and a broad linear range (~200 to 200,000 cells/well), and results are unaffected by changes in nuclear DNA. Cell labeling with reactive dye is ideal for On-Cell Western assays because the cells are not permeabilized.

See some published examples of In-Cell Western Assays

View publications

References

  1. Aguilar, H.N., et al. (2010). PLoS ONE, 5(4), e9965. DOI: 10.1371/journal.pone.0009965
  2. Hoffman, G.R., et al. (2010). Assay Drug Dev Technol, 8(2), pp 186-99. DOI: 10.1089/adt.2009.0213
  3. Selkirk, J.V., et al. (2006). J Biomol Screen, 11(4), pp 351-8. DOI: 10.1177/1087057106286608
  4. Zhang, J.H., et al. (1999). J Biomol Screen, 4(2), pp 67-73. DOI: 10.1177/108705719900400206
  5. Research conducted at LI-COR Biosciences. (September 2020). In-Cell Western Assay Quality Assessment Using Z′-Factor.
  6. Wong, S.K. (2004). Anal Biochem, 333(2), pp 265-72. DOI: 10.1016/j.ab.2004.05.011
  7. Research conducted at LI-COR Biosciences. (January 2018). IRDye 800CW Maleimide Labeling.
  8. Research conducted at LI-COR Biosciences. (November 2021). In-Cell Western Assay Development Handbook.

Additional Publications

  1. Kumar, N., et al. (2008). Mol Pharmacol, 73(6), pp 1668-78. DOI: 10.1124/mol.107.043794
  2. Chen, H., et al. (2005). Anal Biochem, 338(1), pp 136-42. DOI: 10.1016/j.ab.2004.11.015
  3. Coevoets, R., et al. (2009). Eur J Hum Genet, 17(3), pp 301-10. DOI: 10.1038/ejhg.2008.184