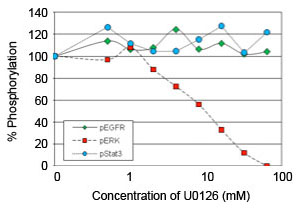
The In-Cell Western assay was used to measure effects of the MEK inhibitor U0126 on EGFR-induced signaling.
Figure 1. A431 cells were treated with U0126 and stimulated with EGF. Phosphorylation of EGFR, ERK, and Stat3 was then measured. As expected, only ERK phosphorylation was inhibited. The IC50 was consistent with published reports.1
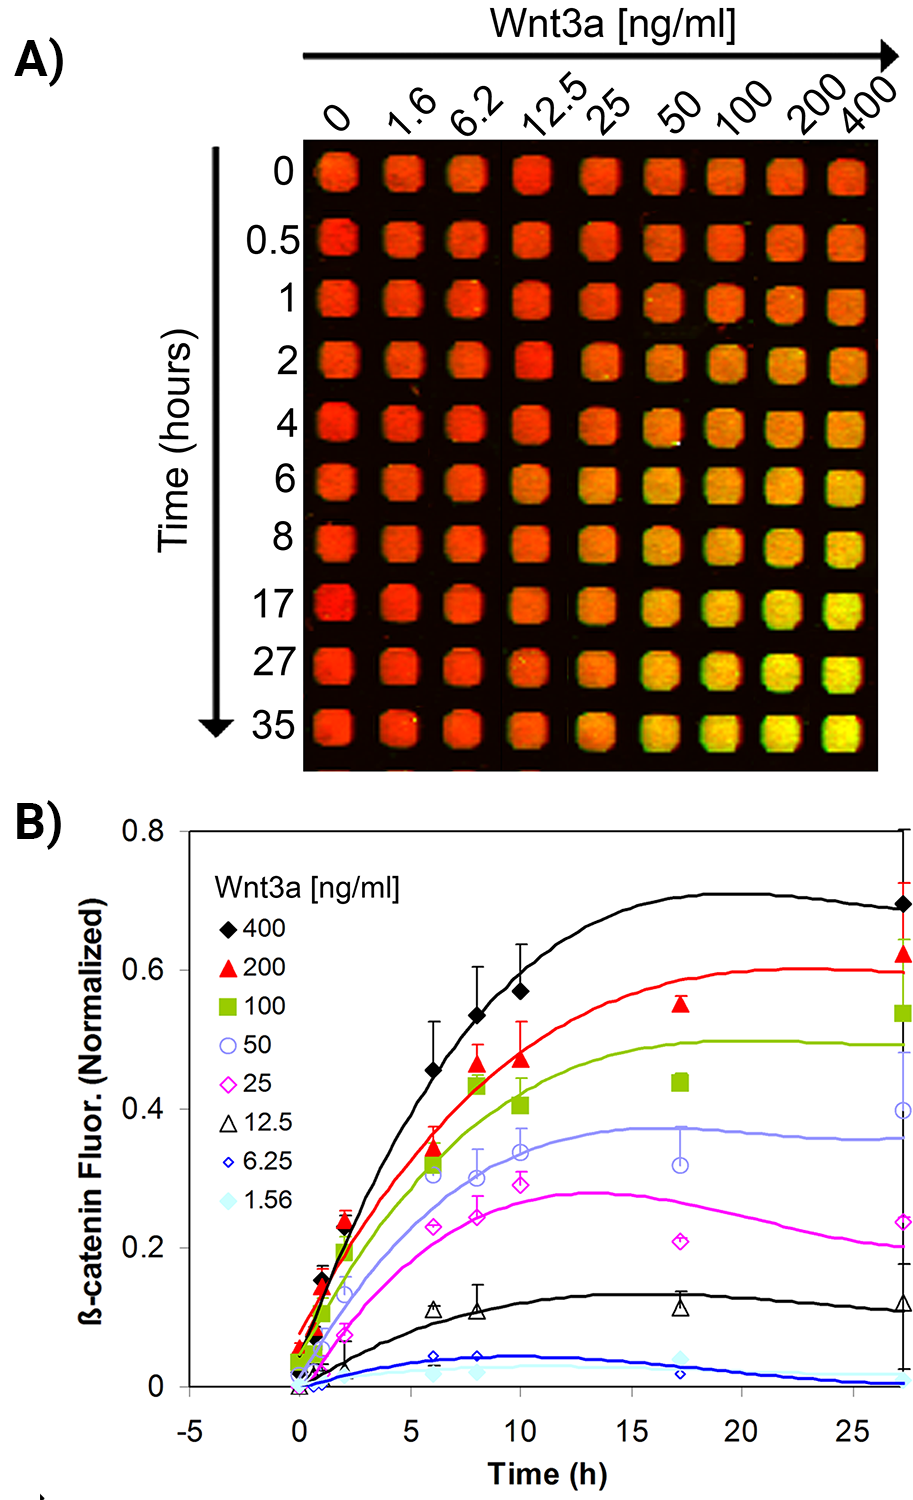
Timing/Kinetics of Signal Transduction
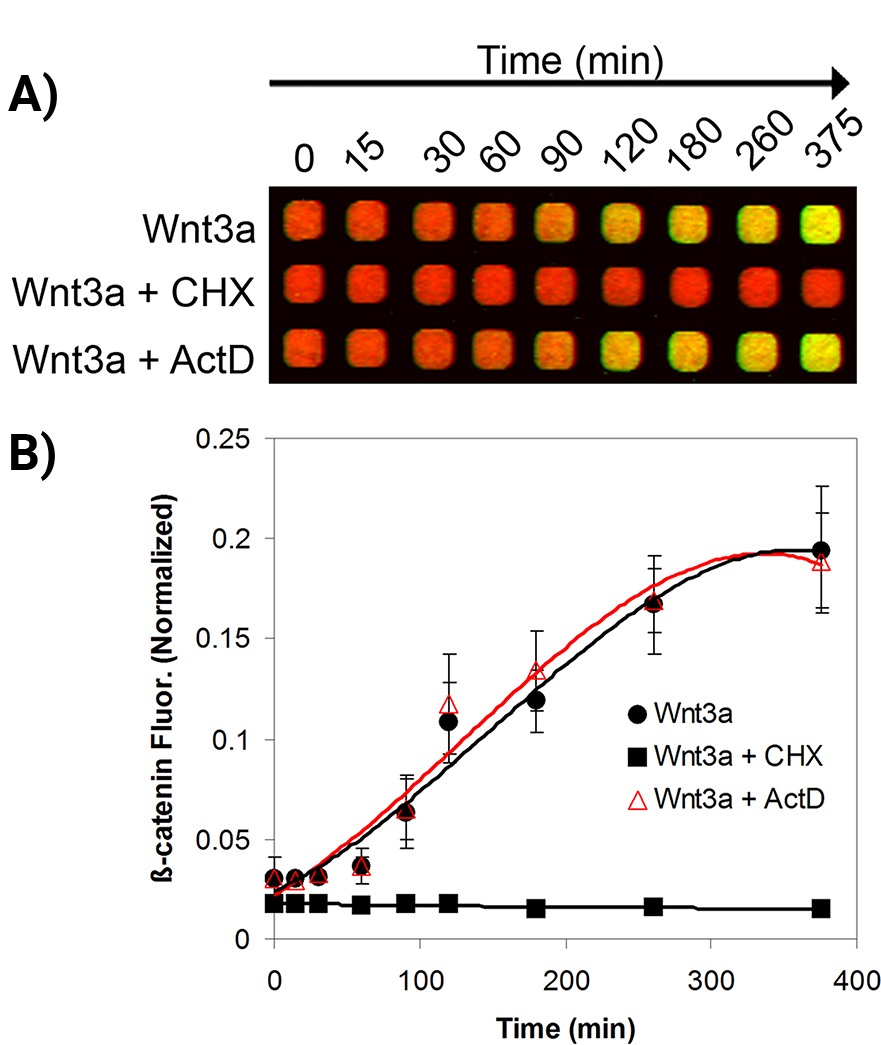
The kinetics of cellular β-catenin accumulation upon stimulation with Wnt3a was studied.
Figure 2. A) Time- and dose-dependent accumulation of cellular β-catenin. L-cells were incubated with Wnt3a, then stained for β-catenin (yellow in merged image) and DNA content (DRAQ5; red). Plates were imaged with Odyssey® Classic Imager. B) Quantification of β-catenin accumulation. Levels were upregulated within 30 min of Wnt3a stimulation, exhibit increased intensity between 6-8 h, and start to plateau after 10 h. Graph shows two independent experiments, each done in quadruplicate.2
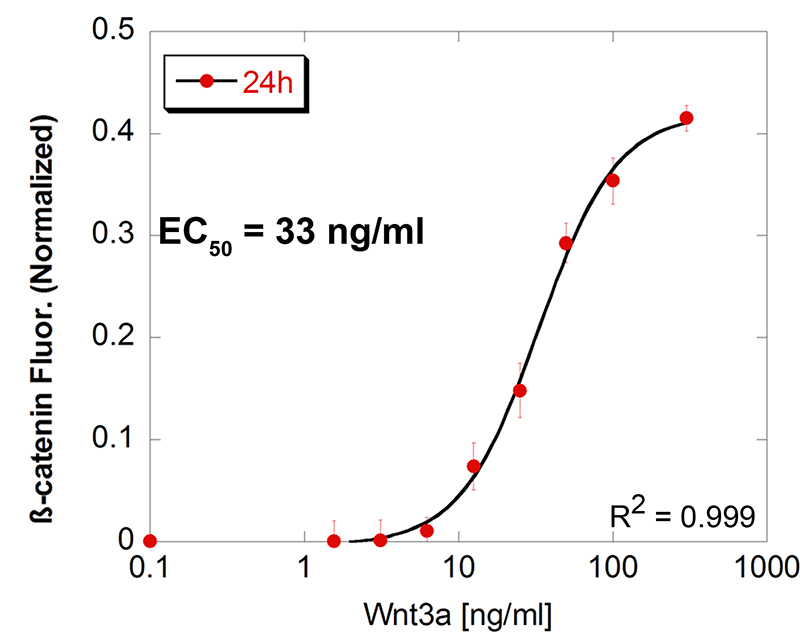
EC50 and IC50 Determinations
In-Cell Western assays were used to determine EC50 and IC50.
Figure 3. Dose titration of Wnt3a treatment of mouse L-cells. Half-maximal activation (EC50) of cellular β-catenin levels occurs at 33 ng/ml ligand.2
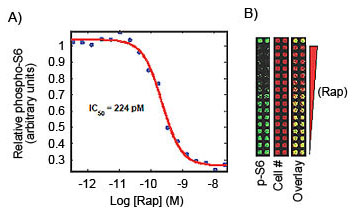
Figure 4. Use of cell labeling for In-Cell Western normalization.A) HeLa cells were treated with increasing amounts of rapamycin in a 384- well format. Fixed cells were stained with phospho-rpS6 antibody and NHS-ester reactive dye (for cell number). Dose dependent inhibition of phospho-rpS6-staining yielded an IC50 of 224 pM (n=4). B) Raw microplate image.3
GPCR Activation
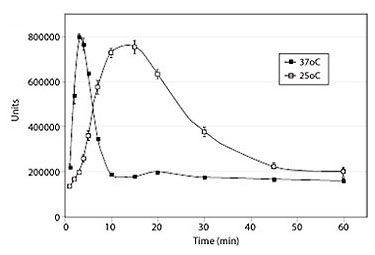
Figure 5. Time course of dopamine-induced pERK in D2 cells. ERK phosphorylation was used as a readout of Dopamine D2 and D3 receptor activation. Cells were activated by 10 μm Dopamine in a 384-well plate, at 37 °C or 25 °C. pERK was quantified by In-Cell Western analysis. Data courtesy of SKF Wong and A Shrikhande. Mitosciences In-Cell ELISA antibodies for apoptosis.4
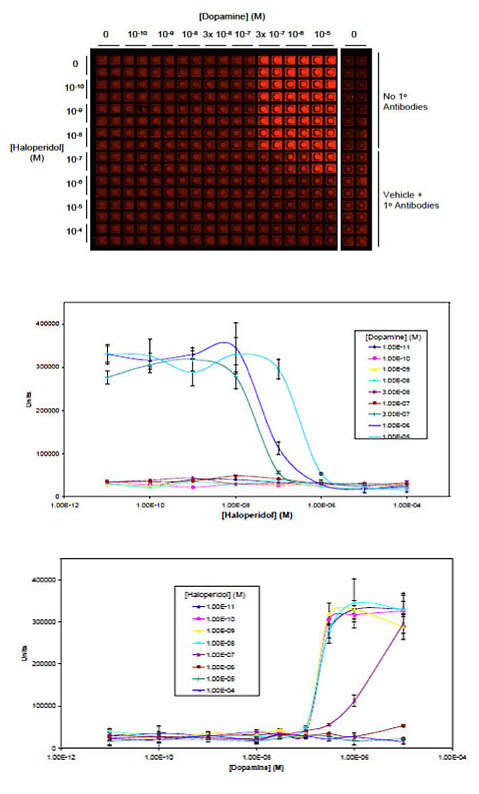
Figure 6. Inhibition of dopamine-induced pERK by haloperidol. ERK phosphorylation was used as a readout of Dopamine D2 and D3 receptor activation. D2 cells were activated for 3.5 min at 37 °C by the indicated concentrations of dopamine and haloperidol (pretreated 30 min prior to the addition of dopamine). EC50 of dopamine activation is 250 nM. Functional Ki of haloperidol determined in the presence of 0.3, 1, and 10 μM dopamine was 15, 12, and 8 nM respectively.4
Tau Protein Accumulation and Inhibition
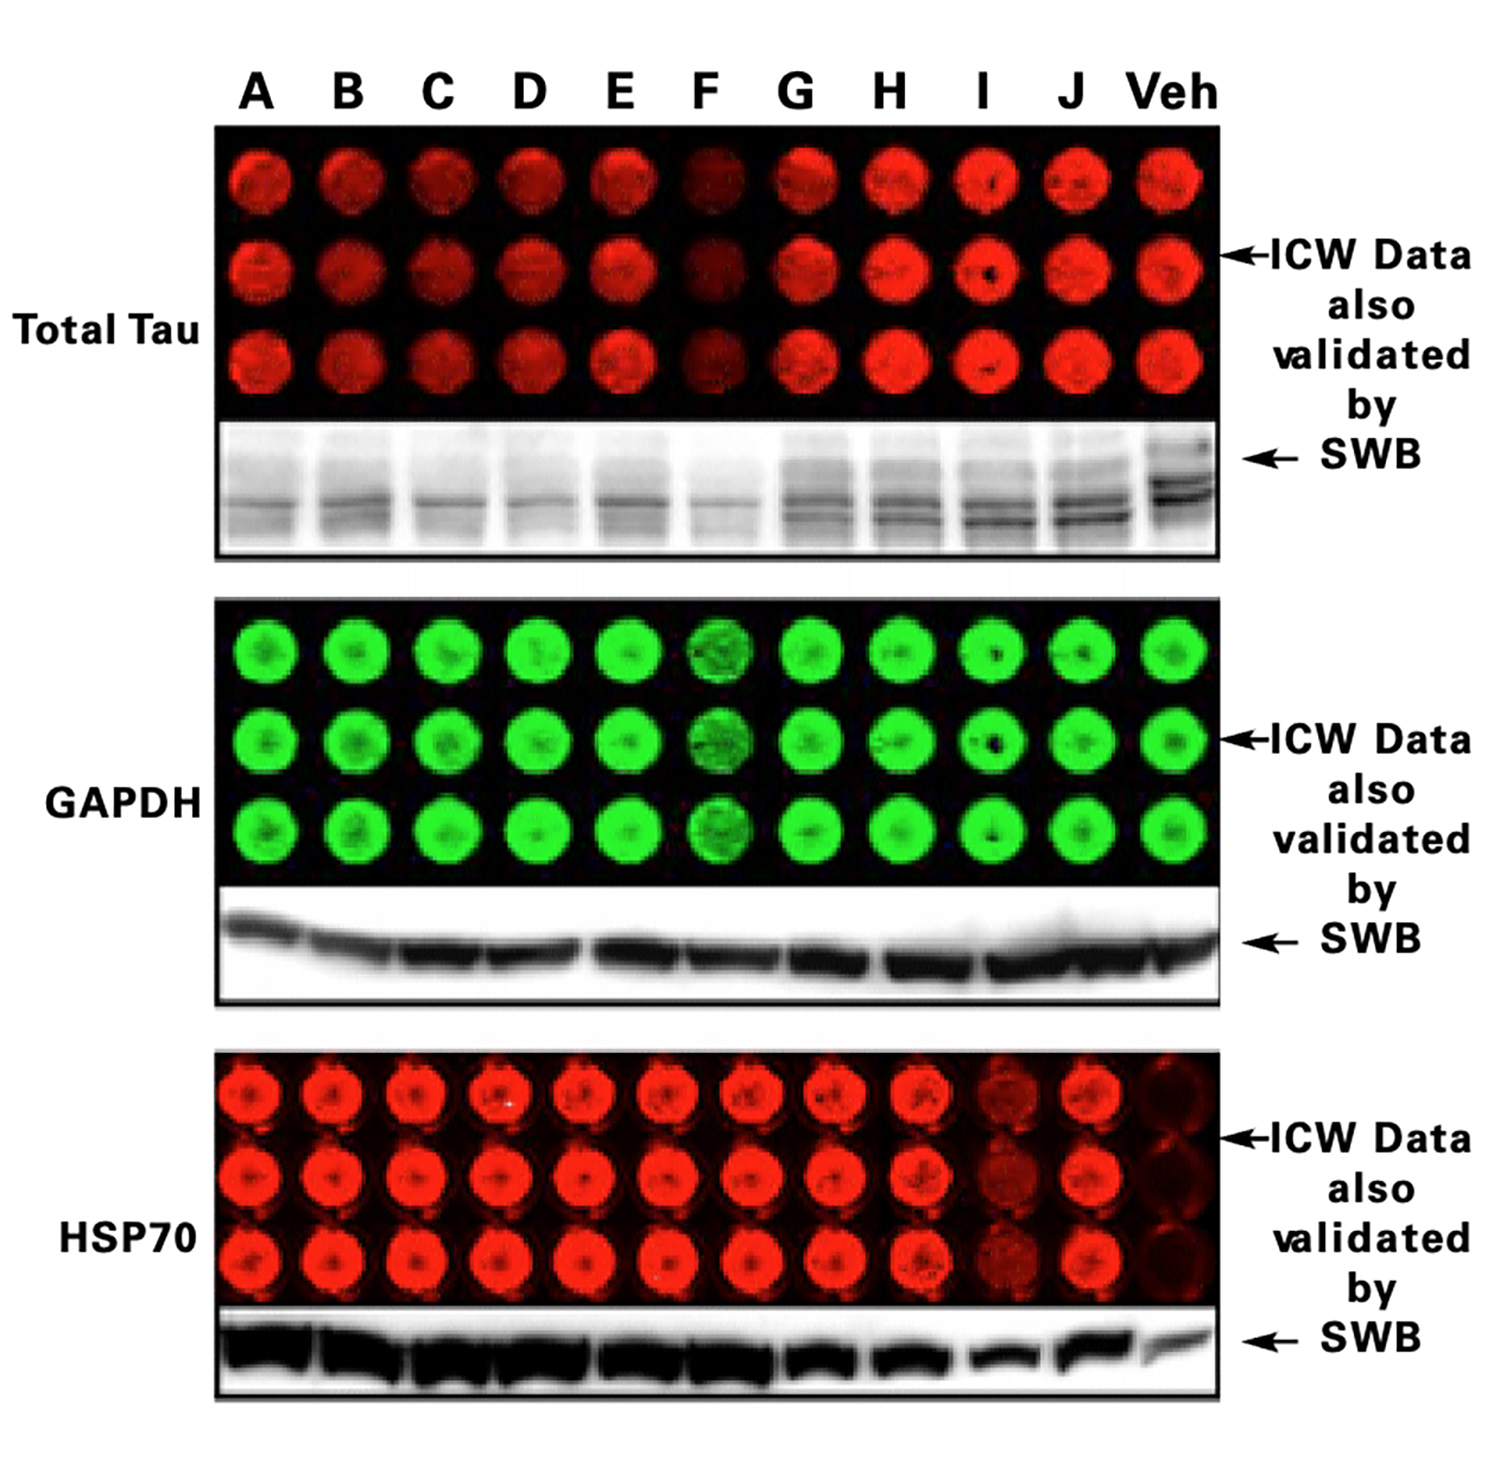
Figure 7. HSP90 inhibitors induce HSP70 protein levels and reduce total Tau levels, largely in the absence of toxicity. HSP90 inhibitors induce HSP70 protein levels and reduce total Tau levels, largely in the absence of toxicity. H4 cells were treated with a 1 μM concentration of small molecule HSP90 inhibitors for 48 hours. Cells were treated in triplicate for In-Cell Western analysis and validated by Western blot (WB) in separate experiments. Compounds A - J are 10 novel and distinct compounds with putative HSP90-inhibiting activity. Veh indicates cells treated with DMSO only. Data courtesy of Chad Dickey, Mayo Clinic.5
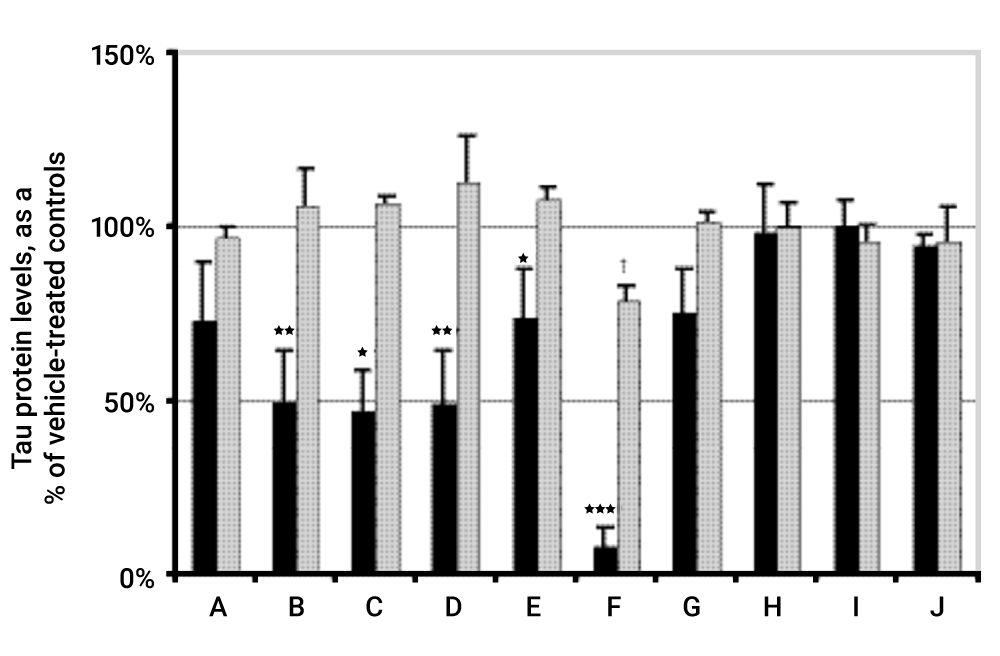
Figure 8. Predominantly non-toxic novel HSP90 inhibitors lower tau protein levels at a tolerable dosage. Human H4 neuroglioma cells were treated in triplicate for 48 h with 1 of 10 HSP90 inhibitors (1 μM; identified by letter on x-axis). Tau (black bars) and GAPDH (gray bars) protein expression were simultaneously measured by In-Cell Western analysis. Expression of tau and GAPDH is presented a percentage of their respective vehicle control levels. Significance was measured for tau levels by comparing GAPDH to tau expression. By student t-test, * indicates p-value < 0.05, ** indicates p-value < 0.01, and *** indicates p-value < 0.001. Toxicity was determined by comparing GAPDH levels in treated cells to vehicle controls cells. † indicates p-value < 0.05. Data courtesy of Chad Dickey, Mayo Clinic.5
Gene Expression
Figure 9. Wnt3a-driven accumulation of cellular β-catenin requires new protein synthesis, but not RNA synthesis. Mouse L-cells were treated with Wnt3a (50 ng/ml) in the absence or presence of either cycloheximide (CHX, 100 μg/ml) or actinomycin D (ActD, 1 μM) and incubated for the indicated times (n = 4).2
Virology Assays
The In-Cell Western Assay is a powerful technique for virologists to define specific viral characteristics, such as viral infectivity and mechanism of action, or to screen antiviral therapeutics and test vaccine efficacy. Results from the In-Cell Western have been shown to correlate well with other virology methods and demonstrate that the In-Cell Western is time efficient and well suited for the study of both cytopathic and non-cytopathic viruses.
For instance, when compared with three common methods to quantify Hantaan virus (HTNV) replication: quantitative reverse transcription polymerase chain reaction (qRT-PCR), flow cytometry (FCM), and enzyme-linked immunosorbent assay (ELISA), the In-Cell Western Assay minimized operator subjectivity and was found to have results that were superimposable with results from the other assays.6 This study highlights the capability of the assay for assessing HTNV replication.
For more details about using the In-Cell Western in virology, visit the Virology application page.
Webinar: Reliable Quantification of Virus Using Infrared Digital Imaging. Watch now
Viral Infectivity
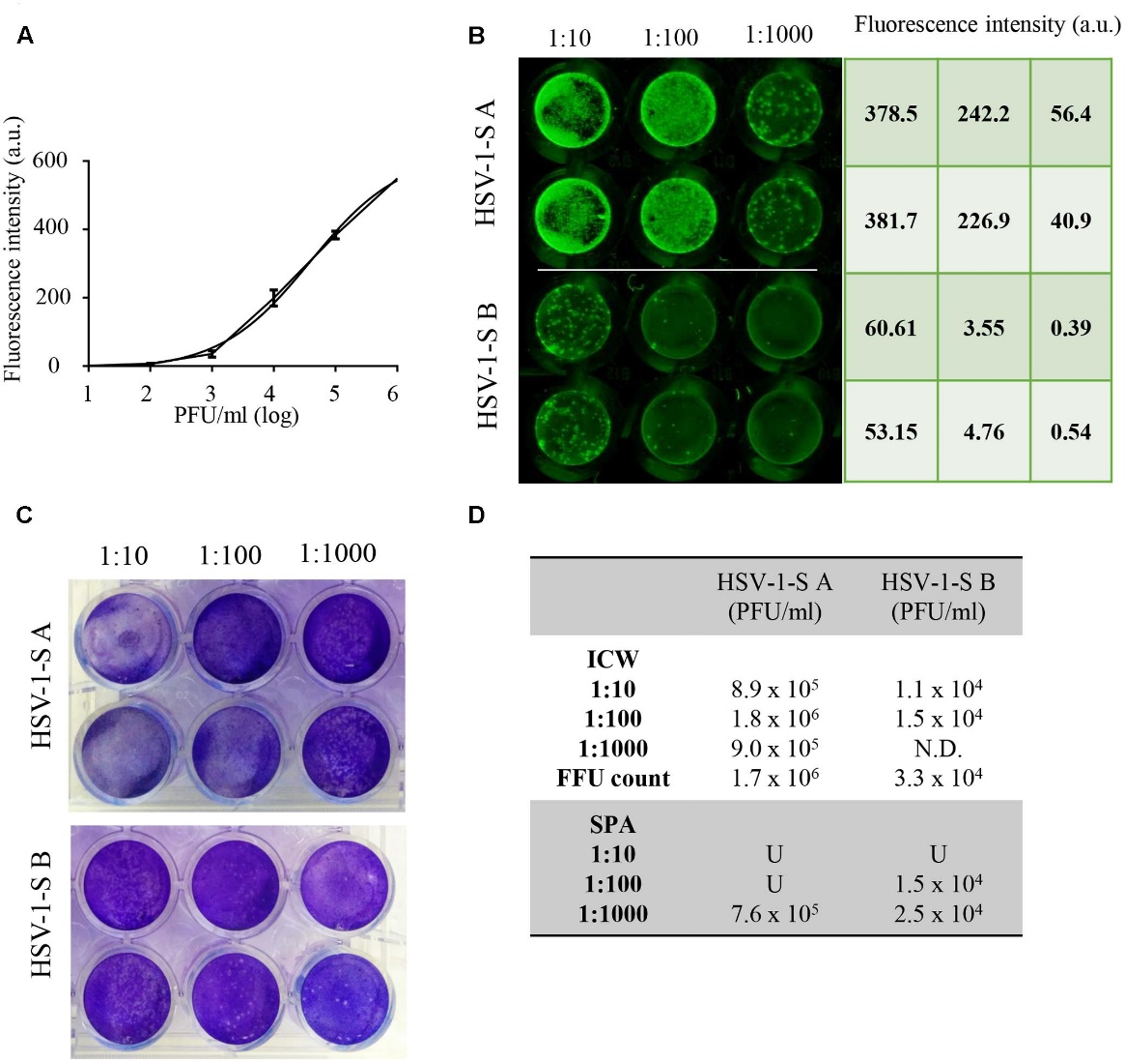
Fabiani, M., et. al. (Fig. 11) found that the In-Cell Western Assay and standard plaque assay (SPA) produced nearly superimposable results. However, the In-Cell Western Assay was faster to detect viral infectivity, enabled many samples to be measured in parallel, and was found to be more suitable for titrations that produced plaques too numerous to count using SPA.7
Figure 10. Results from a viral titer by In-Cell Western Assay were almost completely superimposable with the results of viral titer from SPA. Vero cells were infected by two 10-fold serial dilutions of HSV-1 (HSV-1 SA and HSV-1 SB). A) An In-Cell Western standard curve using the mean value of fluorescence intensity detected in Vero cells with a known HSV-1 titer. B) Unknown HSV-1 SA and HSV-1 SB were titrated via In-Cell Western. Anti-gB was detected using IRDye® 800CW Goat anti-Mouse and CellTag™ 700 Stain was used for normalization. The plate was scanned using an Odyssey® CLx Imager and intensity value was determined by Image Studio™ Software. C) Unknown HSV-1 SA and HSV-1 SB were titrated via SPA. D) Recorded mean values for each dilution for In-Cell Western and SPA. Adapted from Fabiani, M., et. al.7
Cell Surface Proteins
On-Cell Western Assays are a variation of the In-Cell Western Assay in which the cells are not permeabilized. For On-Cell Westerns, the unpermeabilized cells are stained with antibodies against extracellular protein domains so only cell surface antigens are detected. Using On-Cell Western Assays, you can quantitatively monitor cell surface protein expression.