Empiria Studio® Software Multiwell Plate Calculations Reference
Explanation of Analysis Table Data on the Quantify Wells Page
You can view Well Quantification data by clicking Analysis Table on the Quantify Wells page.
Information in the Analysis Table is divided into two main categories: Well information and Replicate information.
Well Information
Well information is information for specific wells in the multiwell plate image. The Wells tab contains a thorough list of this information. The Total tab, Background tab, Signal tab, and Normalized Signal tab contain focused subsets of well information to help you find the information you need at a quick glance. Click to export all the Plate Analysis table data. If you export to the Excel format, each tab for each channel will be in different sheets in the exported Excel workbook.
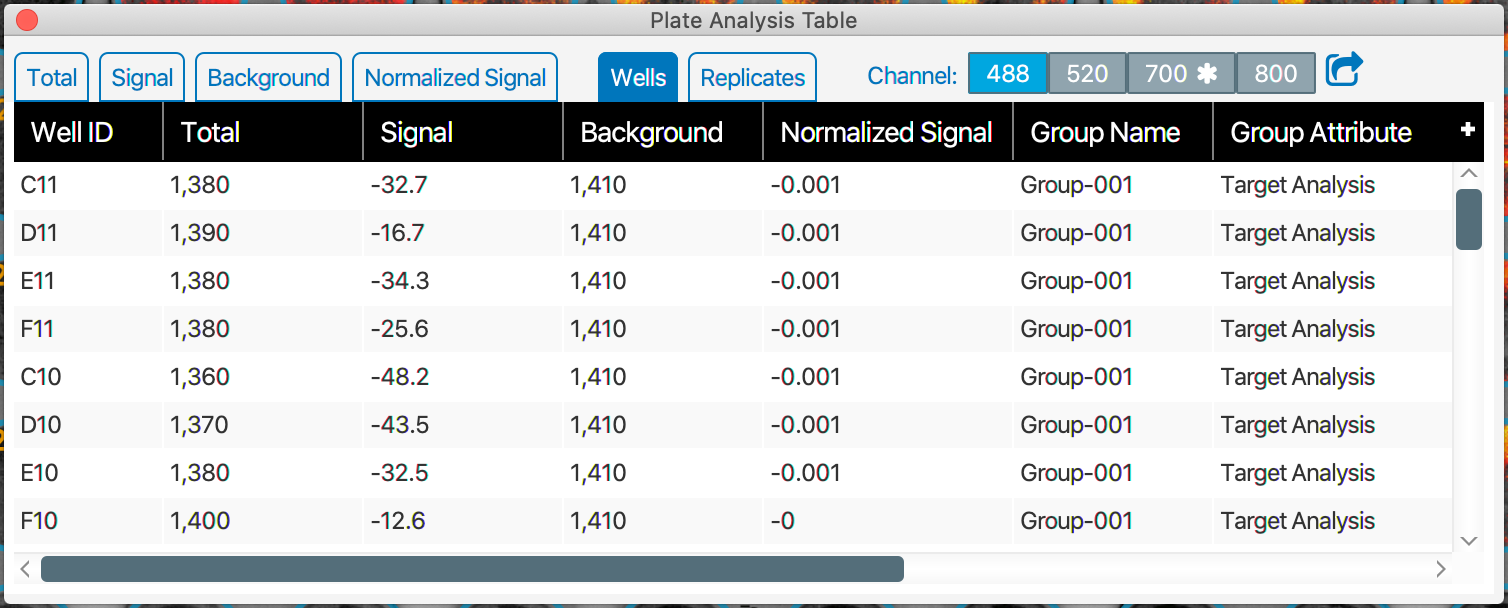
Well information can be divided into Well Metadata and Well Calculations.
Well Metadata
Well ID – A label for the well that shows which row and column the well is in. The letter indicates which row the well is in and the number indicates which column the well is in.
Well Type – Sample, background, or control from the Template.
Well Value – This is the value for a Well entered in the Template Editor.
Well Name – This is the name text for a Well Type entered in the Template Editor.
Well Description – This is the description text for a Well Type entered in the Template Editor.
Group Attribute - This is the attribute text for the Well Group that the well is part of. The Group Attribute is entered in the Template Editor.
Group Name - This is the name text for the Well Group that the well is part of. The Group Name is entered in the Template Editor.
Well Calculations
Total – Sum of the pixel intensity values in a well.
Signal – Sum of the individual pixel intensity values (Total) for a well minus the Background value.
Normalized Signal – Signal in a target channel divided by the internal control Signal detected in the normalization channel.

Background – The Background value shown for a well is the Average of the Total values of all Background wells in the well’s Well Group.
Replicate Information
The Replicate tab in the Analysis Table has information for Well Replicates (also called Well Sets).
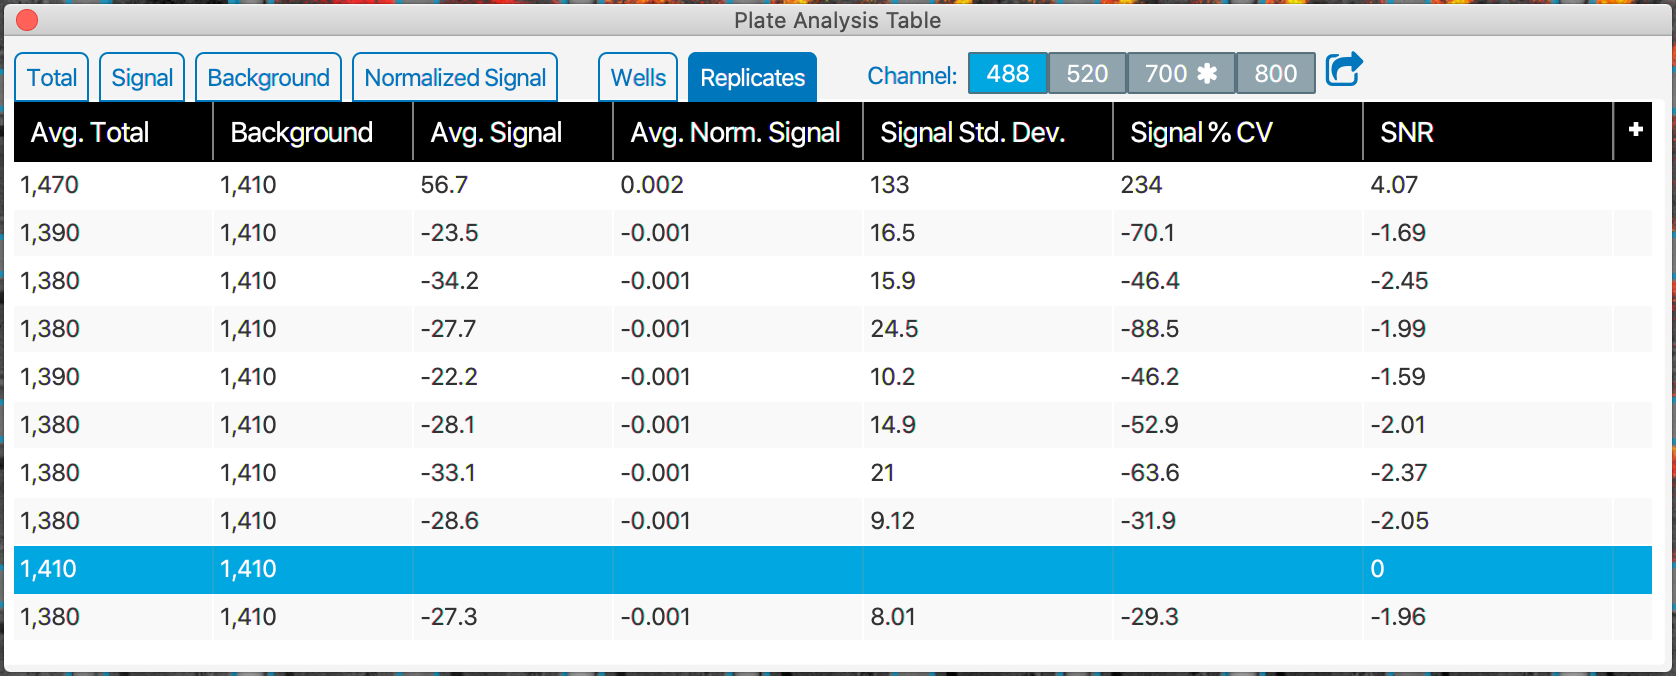
Avg. Total – Average of the Total values for all the wells in a Well Set.
Background – See the definition in Well Calculations .
Avg. Signal – Average of the Signal values for all wells in the Well Set.
Signal Std. Dev. – Standard deviation of signal values for all wells in the Well Set.
Signal % CV – Percent coefficient of variation for all the well Signal values in the Well Set.
Avg. Norm. Signal - Average of the Normalized Signal values for all the wells in the Well Set.
Norm. Signal % CV – Coefficient of variation for all the well Normalized Signal values in the Well Set.
Norm. Signal Std. Dev. – Standard deviation of the Normalized Signal values for all wells in the Well Set.
SNR – Signal-to-noise ratio for a Well Set.

Set Up Chart
In-Cell Western
Target Analysis, Antibody Titration, Blocker Evaluation, Fixation and Permeabilization, and Target Analysis
Normalization
The Normalization values for the Normalization chart type are the average of the Normalized Signal values for replicate wells in a Well Set.
Fold Change
The fold change is the ratio of the average Normalized Signals from a treatment Well Set to the average Normalized Signals in a control Well Set. Select the control for a Fold Change chart type on the Set Up Charts page.

Percent Change
The Percent change is the fold change in percent format.

Z’-Factor Determination Experiment
Follow steps on the Z’-Factor Experiment workflow to the Set Up chart page to view the Z’-factor value and chart.
Z’-Factor Calculation
The Z'-factor value is calculated from the standard deviation and the mean of normalized signal values from positive and negative control wells using the following equation. For the Z’-Factor Templates, all wells are in a single Well Group.
This is the equation for calculating the Z'-factor and a list of the terms in the equation.

Where:
 = Standard deviation of positive controls
 = Standard deviation of negative controls
 = Mean of positive controls
 = Mean of negative controls
Absorbance Assay (Wells Tab of the Analysis Table)
The following information is relevant to all Absorbance Assay Experiment workflows (Antibody Titration, Blocker Evaluation, and Target Analysis).
See Empiria Studio® Software Multiwell Plate Calculations Reference for information about Analysis Table columns that are common to all Multiwell Plate Experiments.
Determine Area within the Well for Quantification
To mitigate the potential for problems caused by artifacts on the outside edge of the well, an area in the center of each well is determined and used for quantification.
Quantification Area for Square Wells

Quantification Area for Circular Wells

Calculations Definitions
Percentile Value – The intensity value for the pixel with the 99th percentile intensity of pixels in the central part of the well.
Absorbance – Ratio of incident to transmitted light through the sample and the well.

You may see N/A in the Absorbance column. If you hover the mouse pointer over the N/A text, you will see a tooltip that says "The absorbance-based quantification value cannot be calculated". If you see this, ensure that you have two or more background wells included on the Quantify wells page. The "Average of Percentile Values from Background Wells" (average) will not be calculated unless there are two or more background wells. Without an average value, the Absorbance value cannot be calculated.
Required Wells
In‑Cell Western
All calculations, except Total and Avg. Total, require at least two background wells to be defined in the Well Group in the Plate Template and included in the analysis.
Absorbance Assay
Two background wells must be defined in the Well Group in the Plate Template and included in the analysis for absorbance to be calculated.
Cell Analysis
All calculations, except Total and Avg. Total, require at least two background wells to be defined in the Well Group in the Plate Template and included in the analysis.
Analysis Table Well Tab Calculation Examples
The example calculations in this section are based on the following simple Plate Template. This template does not represent a recommended experimental design. The following example is simplified to one Well Group for illustrative purposes.

Total (800 nm Channel)
| 8 | 9 | 10 |
C | 300 | 200 | 100 |
D | 310 | 210 | 110 |
E | 320 | 220 | 120 |
F | 330 | 230 | 130 |
Background (800 nm Channel)
This is the background value for the Well Group that will be used as the background value for calculating signal in for all the wells in the group.

You can set up a Plate Template so that one background value can be used for multiple Well Groups. To do this, select Include all backgrounds on the Setup Well Groups page of the Template, then create groups. The average Total value from all background wells will be used as the background value for Well Groups created when the Include all backgrounds option is selected.
Signal (800 nm Channel)
An example signal calculation in shown in C9. The other Positive and Negative wells are also calculated by subtracting the Total value for the well minus the Average Background value.
| 8 | 9 |
C | 185 | 200 – 115 = 85 |
D | 195 | 95 |
E | 205 | 105 |
F | 215 | 115 |
Normalized Signal
The Normalized Signal for a target channel is calculated by dividing the well Signal in the given target channel by the well Signal in the normalization channel. In this example, the 700 channel is the normalization channel.
Signal (700 nm Channel)
Signal for the normalization channel (in this example, 700 nm channel) is calculated the same way as Signal is calculated for the target channel (in this example, 800 nm channel). The Signal for the 700 nm channel is shown here for reference, but calculations are omitted for brevity.
| 8 | 9 |
C | 400 | 300 |
D | 410 | 310 |
E | 420 | 320 |
F | 430 | 330 |
Normalized Signal (800 nm Channel)
| 8 | 9 |
C | 0.463 | 85 ÷ 300 = 0.283 |
D | 0.476 | 0.306 |
E | 0.488 | 0.328 |
F | 0.500 | 0.348 |
Set Up Chart Page Calculation Examples
Examples in this section are based on the Normalized Signal values shown in the previous section.
Well Sets vs Well Groups
To understand how values displayed on the Set Up Charts page are calculated, it is helpful to distinguish the terms “Well Set” and “Well Group”.
Well Set – Replicate Well Types within a Well Group.
For example, all negative control wells inside a Well Group comprise a Well Set.
Well Group – Experimental group on a multiwell plate that includes well types linked for analysis. It may help to think about Well Groups as individual experiments.
For example, positive control, negative control, and background wells that receive the same secondary antibody dilution in an antibody titration experiment constitute a Well Group.

Normalization


Fold Change
To demonstrate fold change calculations, we will switch examples. The antibody titration example with one well group is not sufficient for this section.
Plate Template

Example Data and Calculation
| Control Normalized Signal | |
|---|---|
C | 10 |
D | 20 |
E | 30 |
F | 40 |
Average | 25 |
| Treatment Normalized Signal | |
|---|---|
C | 20 |
D | 40 |
E | 60 |
F | 80 |
Average | 50 |

Percent Change
