Slide and Small Animal Image Analysis
Start Slide and Small Animal Analysis
On the Start Slide and Small Animal Analysis page, click Image Gallery to choose Acquisitions A group of images from the same acquisition process, including images of different Scan Areas and images of different channels. or Collections A Collection is a group of Acquisitions. that you want to analyze.
In the Select from Image Gallery dialog, if you want to choose a Collection, click to switch to the list of Collections.
Acquisitions from a Fast Series or Time Series on the Pearl Trilogy are saved in LI‑COR® Acquisition Software as Collections. Collections are a quick way to import many Acquisitions (Acquisitions can contain multiple images of different channels) into Empiria Studio for analysis.
With your selection made, click Start.
Name
To help with record-keeping, give every Experiment a distinct name. The description field provides space for you to include important details about the Experiment.
Set up images
The Set up images step is where you designate which images to analyze and the image setup to display on the Review and report step.
If you have one Acquisition with multiple image channels, you may find that it's easiest to first add the image Acquisition with all channels for easy visualization, then add the images of individual channels for differential analysis of the individual channels on the Quantify and Annotate page.
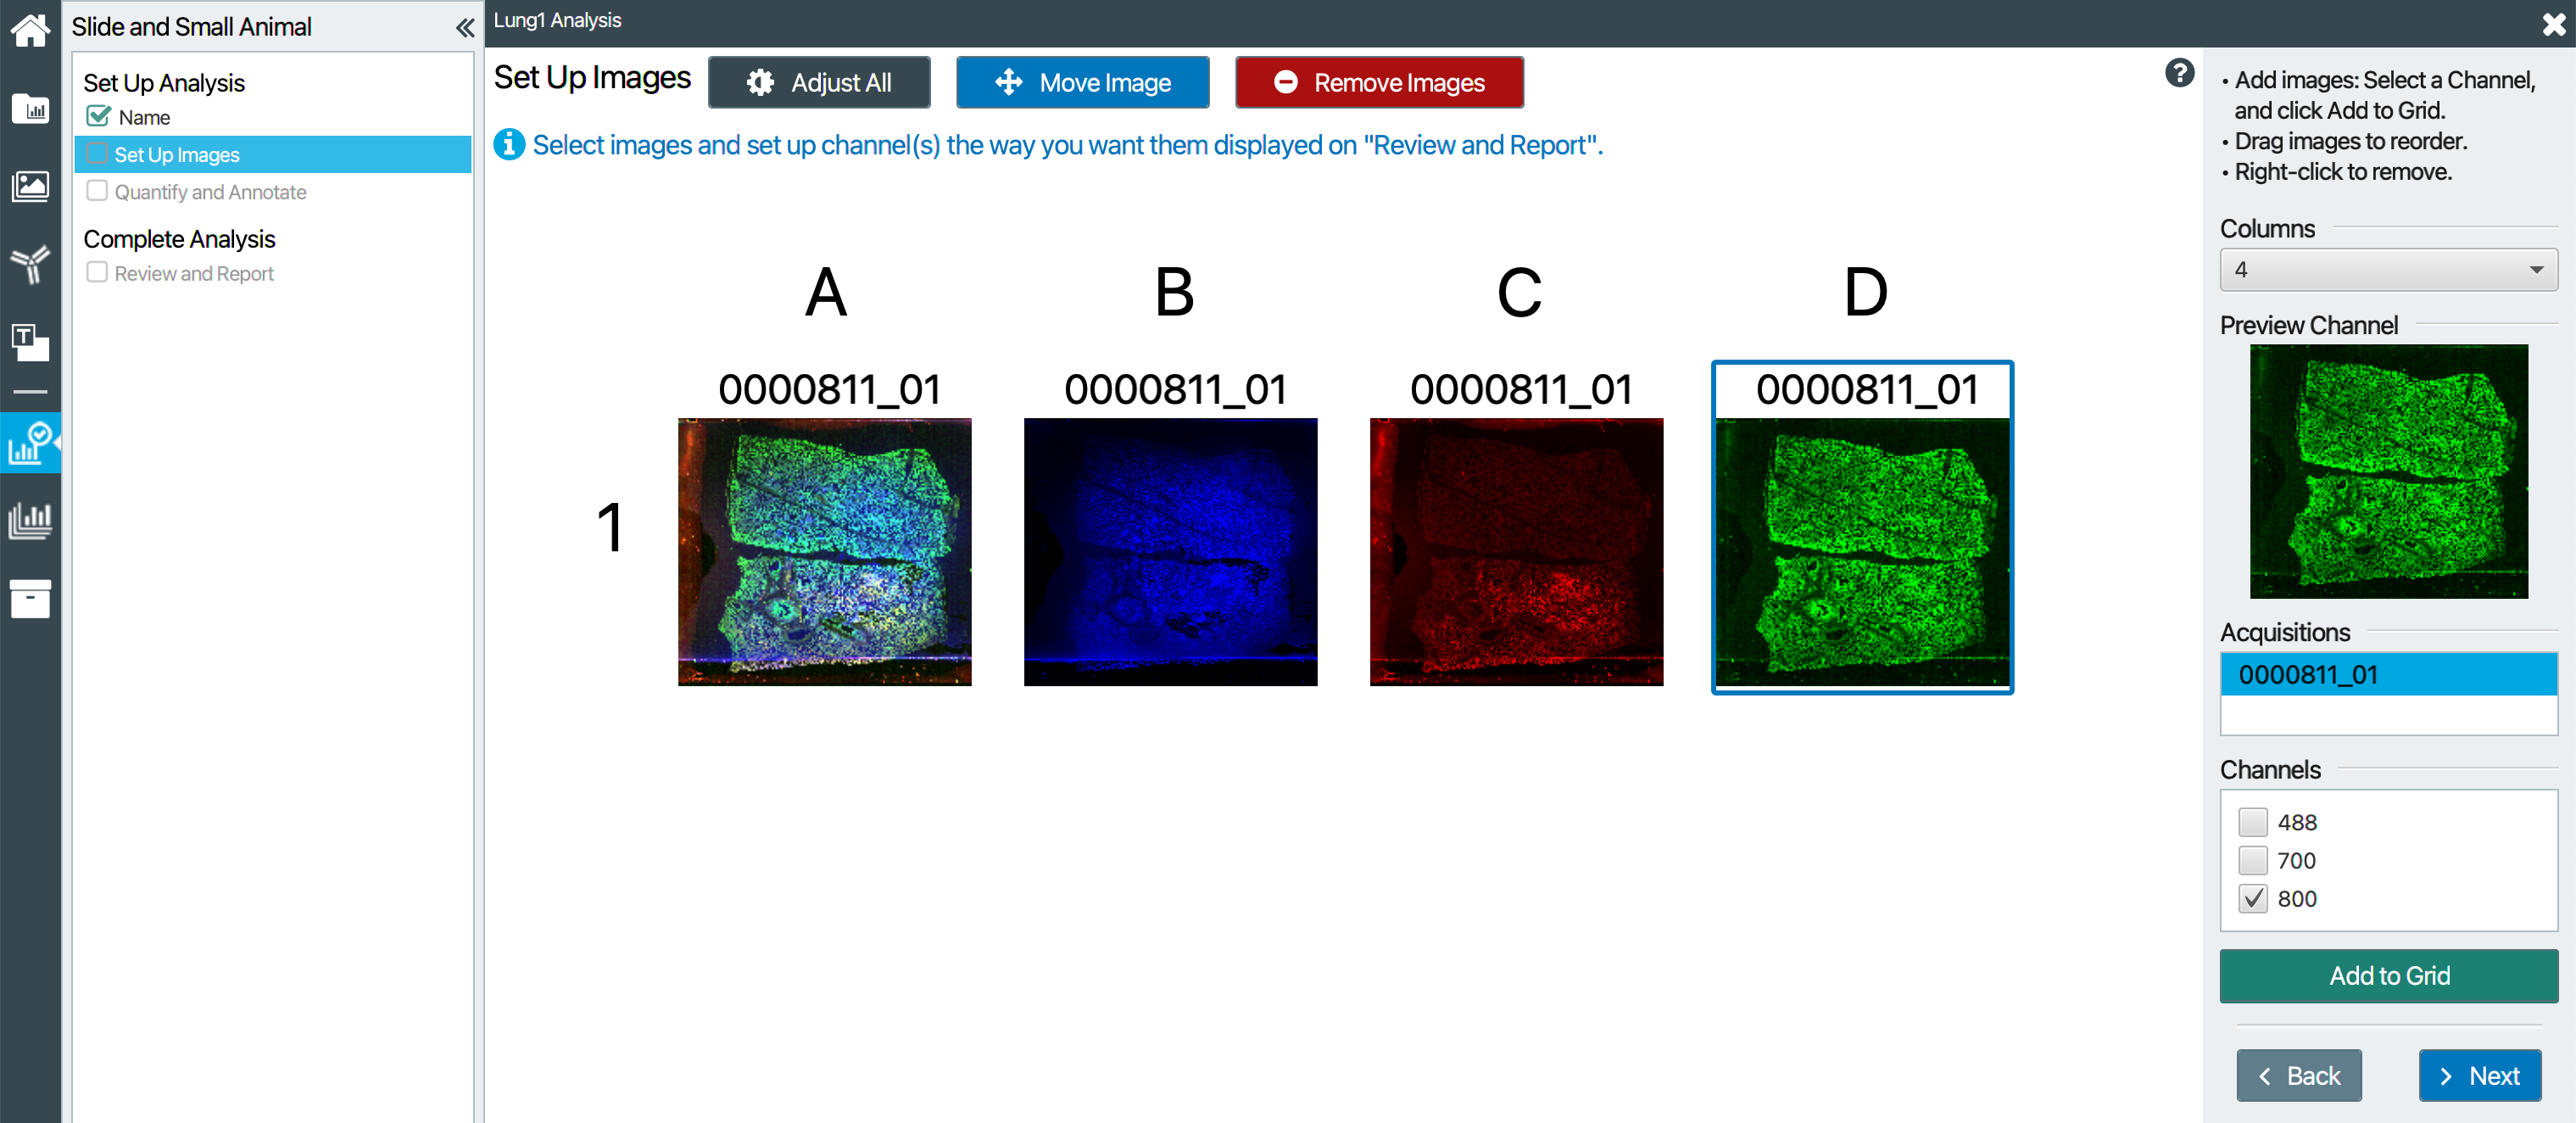
To add different channels from an Acquisition to the Set up images page for analysis, do the following:
Ensure the Acquisition you want to analyze is selected in the Acquisitions list on the right side of the Empiria Studio window.
Ensure all channels are selected in the Channels list.
Click Add to Grid.
Select only one channel, then click Add to Grid again.
Repeat to add as many individual channels as you need to the Set up images page, as needed to facilitate your analysis.
On the Quantify and Annotate page, you will have the option to add shapes to quantify many ROIs on one channel, then quickly copy the shapes to the other channels you need to quantify.
Quantify and Annotate
Annotate
Add text, scale bar, measurement tool, or shapes to annotate the image. You can click Copy to Other Images to copy your annotations to the other images you want to annotate.
Click to view the color bar.
In the Color Bar dialog, select Display on image to display the color bar on the image. The color bar can be displayed on the image when only a single channel is displayed.
Quantify
Add a shape to define the region of interest (ROI) that you want to quantify.
Click or to draw a circle or square around the ROI.
Click to draw an irregular polygon around the ROI. You can move, add, and delete points from the irregular polygon to fit it tightly around the ROI.
Press ALT (⌥ on macOS), and click the polygon to add a point.
Hover the mouse pointer over a point and press Delete to delete a point.
If you want to add the shapes that you added to other channels, click Copy to Other Images.
Add a shape to define the background region (see the previous step for information about adding shapes to the image).
With the background shape selected, click Assign Background.
If you want to assign more than one background or more than one ROI, use the Link Shapes/Backgrounds option to associate the ROI shapes and background shapes in the way that is appropriate for your analysis.
When your ROI and background shape are defined the way you need, you can view quantification data by clicking
 Analysis Table.
Refine
Click Refine to designate the pixels in the ROI that you want to quantify.
When the Refinement tool is applied to selected shape(s) on the image, pixels below a user-defined threshold intensity are eliminated from the calculation of Signal for the shape(s). This is similar to some image mask features in some software applications that hide some pixels in the image from view. However, the refinement tool affects only quantification and does not change the image view. See Refine Quantification Tool in the Calculations Section for more information.
Review and report
Images
Click above an image to export the image. Images can be exported as a high-resolution TIFF for publication in a journal or as a PNG appropriate for slide presentations. Do not use these images for analysis.
The units for image size can be set to English or metric on the General Options page.
Click Hide features to hide shapes and annotations. If shapes and annotations are hidden, they will not be included in the exported image or report.
Tables
Click Export above a table to export the data in the table in CSV or Excel (XLSX) format.
Export Menu Options
On the right side of the window, there is a menu with three export options.
Click PDF Report to export a PDF of the images and data on the Review and report page.
Click Experiment File to export all the images, quantification steps, and data from this Experiment to a single file that can be imported into Empiria Studio on another computer.
Click All Report Images to export all images from the Experiment to separate files for use in print publications or digital media (such as a slide presentation). Do not use these images for analysis.
In the export dialog, click Browse to find a parent folder for the images and enter a name for a new folder in the Folder Name field. The images will be exported into the new folder, which will be inside the parent folder.
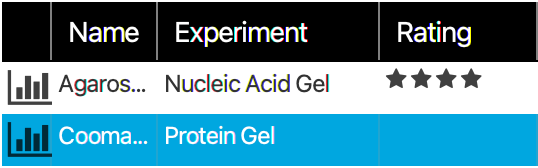
Rate Experiment
Rate the Experiment for your records. This is an opportunity to record if the Experiment went "well" or not, depending on the specific requirements for your research.
Done
Click Done to mark this Experiment as complete and return to the Experiment List.