Reference
Band Normalization
Normalization is useful for using one channel to correct for loading variation between lanes.
- Normalization Channel: The Normalization Channel chosen for an image can be displayed in the Images table, Western Bands Table, or Western Lanes Table. Click Columns
 above and to the right of the Table section and select Normalization Channel in the dialog that opens.
 - Normalization Factor: Add the Normalization Factor to the Western Bands Table or Western Lanes Table by clicking Columns above and to the right of the Table section and selecting Normalization Factor in the dialog that opens.
- Normalized Signal: Add the Normalized Signal to the Western Bands Table by clicking Columns above and to the right of the Western Bands Table and selecting Normalized Signal in the dialog that opens.
If the lane has a single band in the Normalization Channel, the Normalization Factor is calculated by dividing the signal for this single band by the maximum signal of all singleton bands in the Normalization Channel. Otherwise, the value is NaN. The value will be identical for all channels within a lane. The Normalized Signal column in the Bands Table is calculated as the Signal divided by the Normalization Factor.
This example will normalize the 800 channel to the 700 channel:
- Ensure only one band is present in each sample lane for the normalization channel.
- In the Normalize group, select 700 channel from the Normalize Channel list.
Choose a background method in the Define Type list
 . See the Image Studio Software Help for more information on which background method to choose.
Changing the background method will change the quantification values. When analyzing repetitions of the same assay, choose one background method to use each time repetitions of the same assay are analyzed.
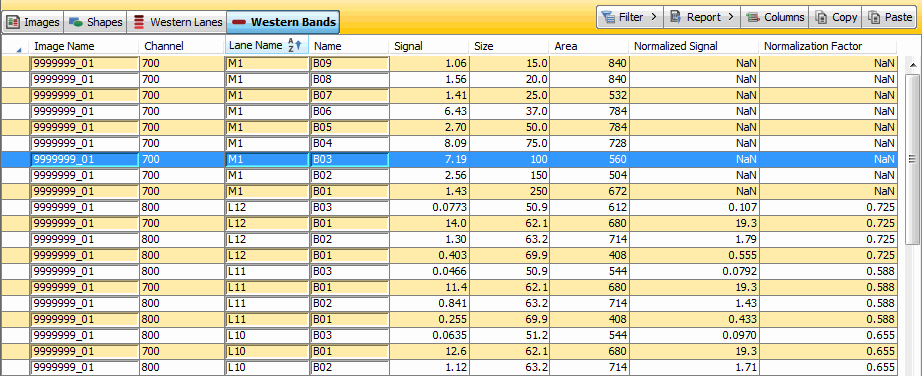
- You should see the following in the Normalized Signal column of the Western Bands Table:
- Rows corresponding to bands in the marker lane will display "NaN" (because the marker lane has more than one band).
- Rows corresponding to bands in the normalization channel will display the value of the band with the greatest Signal value.
- Rows corresponding to bands in the opposite channel will show each band's Signal divided by the Normalization Factor from the band in the normalization channel in the same lane.
Calculation Descriptions
In the Tables there are columns that refer to calculations. When these columns are part of the table, the values are automatically calculated and reported in the table. Some columns are specific to one table and some can be shared across tables. The Columns group has commands for adding and removing columns. For further instructions, select "Adding and Removing Columns" in the help section of any table type.
Below are detailed descriptions of the calculations in these columns. First, the terms used in these descriptions are defined.
Definitions of Terms
Shape — any area enclosed using the shape tools.
Pixel — the smallest area unit of an image that is measured with a single intensity value.
Signal intensity or intensity — signal counts measured in a single pixel per unit time.
Descriptions of the Calculations
Area — The area is the total number of pixels enclosed by a shape.
Bkgnd. — The background is the average intensity of the pixels selected as the background region.
Bkgnd. Std Dev — The background standard deviation is the standard deviation of all of the background pixel intensities in a single channel.
Max — The maximum intensity is the highest pixel intensity within a shape. The maximum intensity value does not have background intensity subtracted.
Mean — The mean is the sum of all of the pixel intensities for a shape divided by the total number of pixels in a shape.
Min — The minimum intensity is the lowest pixel intensity within a shape. The minimum intensity value does not have background intensity subtracted.
Signal — The signal is the sum of the individual pixel intensity values (Total) for a shape minus the product of the average intensity values of the pixels in the background (Bkgnd) and the total number of pixels enclosed by the shape (Area). Signal = Total - (Bkgnd. x Area)
StdDev — The standard deviation of all of the pixel intensities for a shape.
Total — The total intensity is the sum of the individual pixel intensities for a shape.
Trim Bkgnd. — The trimmed background is the average intensity of the pixels selected as the background region.
The highest 5% count and lowest 5% count of the intensity pixel values of the shape are discarded.
Trim Bkgnd. StdDev — The trimmed background standard deviation is the standard deviation of all of the background pixel intensities in a single channel. Note: the highest 5% count and lowest 5% count of the intensity pixel values of the background are discarded.
Trim Mean — The trimmed mean is the sum of all of the pixel intensities for a shape divided by the total number of pixels in a shape.
The highest 5% count and lowest 5% count of the intensity pixel values of the shape are discarded.
Trim Signal — The trimmed signal is the sum of the individual pixel intensity values for a shape minus the product of the average intensity values of the pixels in the background (Bkgnd.) and the total number of pixels enclosed by the shape. Note: The highest 5% count and lowest 5% count are excluded from the intensity summation and the pixel count.
Trim StdDev — The trimmed standard deviation is the standard deviation of all of the pixel intensities for a shape.
The highest 5% count and lowest 5% count of the intensity pixel values of the shape are discarded.
In-Cell Western Calculations
Background — The average pixel intensity of each background well will be calculated, and the background wells will be averaged to find the background value to be subtracted from wells designated Sample and 100% Standard.
Linked Wells — The pixel intensities from linked wells are averaged, and this average is used in the following calculations for each of the linked wells.
ICW Relative — After background subtraction, all wells designated as Sample or 100% Standard in a channel are divided by the intensity value of the well with the highest response. This well is given a value of 1.0, and the relative intensity values of the other wells will generally be between 0.0 and 1.0.
Negative relative intensities indicate the original intensity value was lower than the average background when the background was subtracted.
If a normalization channel is selected, the intensity value of each well in the other channel is divided by the relative intensity value of the corresponding well in the normalization channel.
ICW % Response — After background subtraction and normalization (if used), all wells designated as Sample are divided by the average of the wells designated as 100% Standard in that channel and multiplied by 100 to give a percentage response to the control in the 100% Standard.
All ICW % Response values for the normalization channel are reported as NaN.
ICW Std Dev — The ICW standard deviation is the standard deviation of the average of the pixel intensities from linked wells.
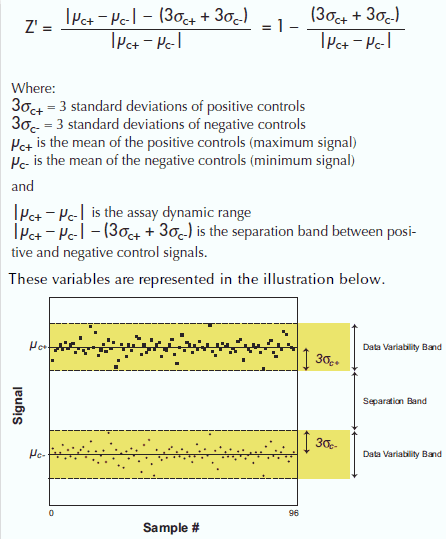
Z-Factor Calculation
First, pixel intensities in all wells designated as Background in each channel are averaged, and the average is subtracted from the pixel intensities of all wells in that channel. Then, the relative intensity values are found by dividing all wells by the intensity value of the well with the highest response. The intensity values from the sample channel are divided by the relative intensity values from the corresponding wells in the normalization channel.
The Z-factor calculation uses these values in the following equation:
General Background Subtraction Concepts
Background is noise in an image that can affect signal quantification. Background must be subtracted to accurately calculate signal from the shape(s) of interest, especially if background values vary throughout an image. The best method for background correction depends on the image and its background consistency.
Image Studio™ Software provides a variety of background subtraction methods to address numerous conditions found in wide ranging biological imaging applications.
Background consistency in an image will generally fall into one of three categories:
-
Background around shapes in an image can be nearly uniform
-
Background around shapes can be different around each shape
Background around shapes in a lane can vary within the lane
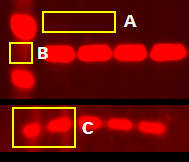
Many forms of background can be seen in these images. A) Brightness from the autofluorescent background is fairly constant. B) Smearing between bands in a marker lane. C) Different background around shapes.
Image Studio™ Software provides these background correction methods to accurately calculate background for each of the three scenarios above:
- User-Defined: If background varies little throughout an image, one or more shapes can be placed on the background of the image and assigned to represent background for each shape. For add-on Plate or Grid analysis types (available with the Grid Analysis Key), wells or spots can be assigned as user-defined background shapes.
- Average or Median: If background varies widely between shapes, Average or Median can be used to subtract background around each shape.
- Lane (available with the Western, MPX™ Western, and DNA Gel analysis types): The Image Studio Lane method corrects for background in lanes with many close together bands and lanes with smearing between bands.
Background subtraction in Image Studio Software does not affect the appearance of an image. See the Display Panel topic in the Image Studio™ Software Help for how to adjust image display.
Lane Method vs. Rolling Ball from ImageJ
The Image Studio Lane background subtraction method and ImageJ Rolling ball method use very different algorithms to subtract background from a lane. Rolling ball can also be used to subtract background from an entire image, although this is discouraged.*
*Gassman, M, B Grenacher, B Rohde, and J Vogel. Electrophoresis 30:1845-55 (2009).
http://www.ncbi.nlm.nih.gov/pubmed/19517440
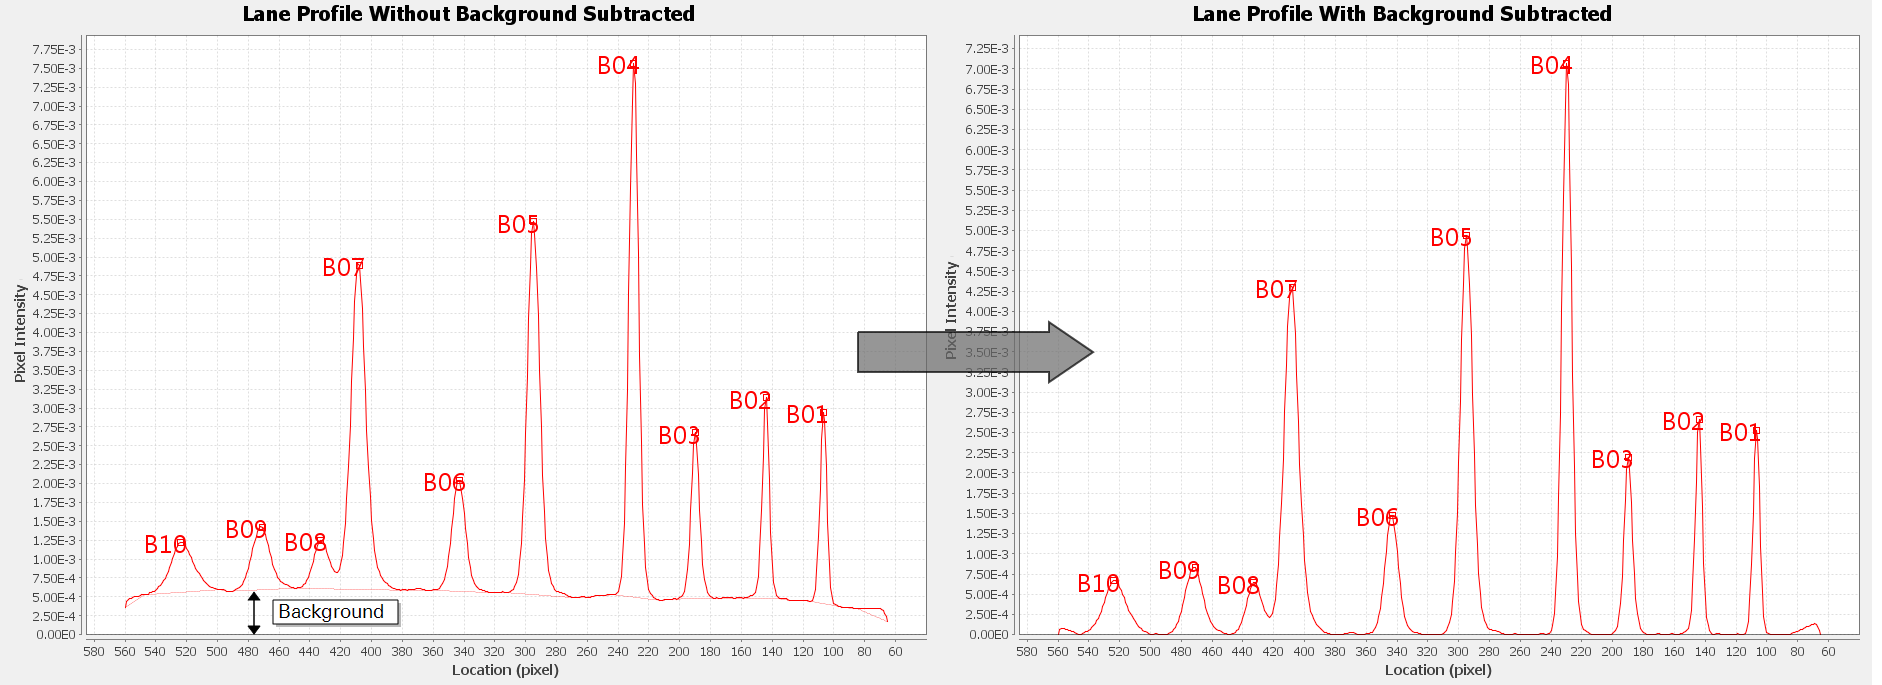
To begin the Image Studio Lane background subtraction algorithm, the average pixel intensity of each row of pixels in a lane is calculated to establish a "lane profile". The lane profile is used to find areas of minimum pixel intensity between shapes, called "local minima". The image below shows a lane with its corresponding lane profile.
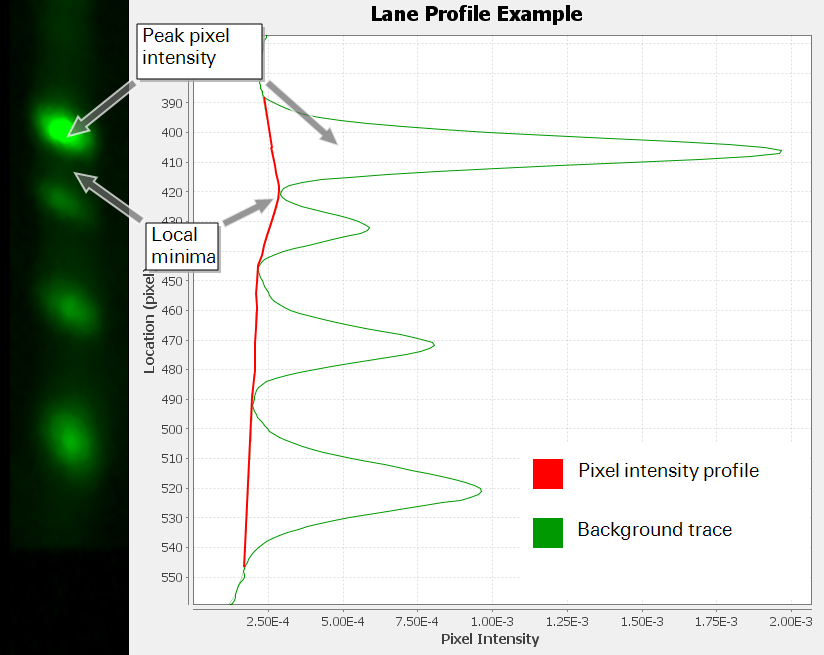
To subtract background, a linear connection is drawn between consecutive local minima and background noise that falls beneath the lines is subtracted.
The Lane background method takes advantage of the known locations of shapes within a lane and selectively connects minima in the profile to account for variations in shape size, shape spacing, and image resolution. The image below shows a lane profile before and after Lane was used to subtract background.
To understand Rolling ball, imagine an image of a Western blot as a 3-dimensional histogram of pixel intensity
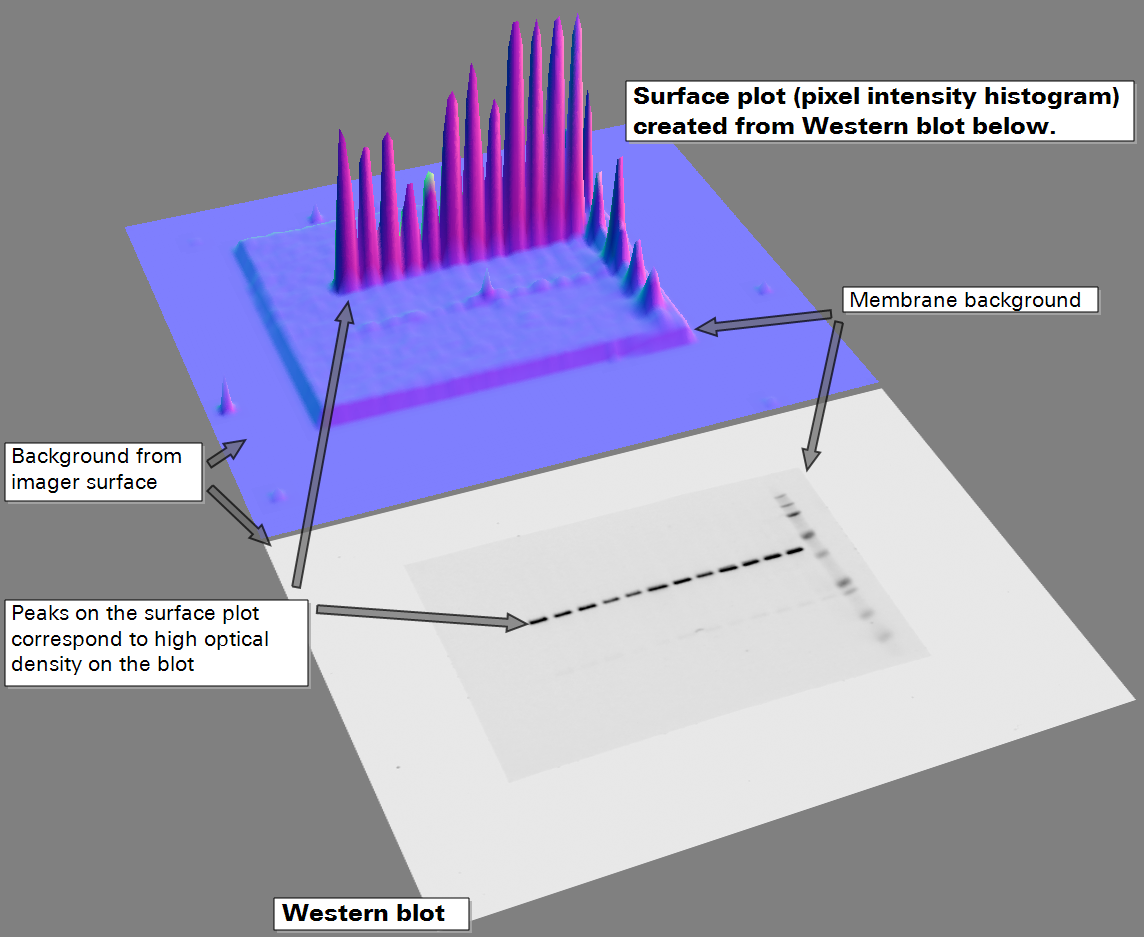
Rolling ball identifies background in an image by traversing a ball along the bottom surface of the pixel intensity histogram. The highest point where the ball can fit underneath the surface is considered the threshold for background subtraction at that point
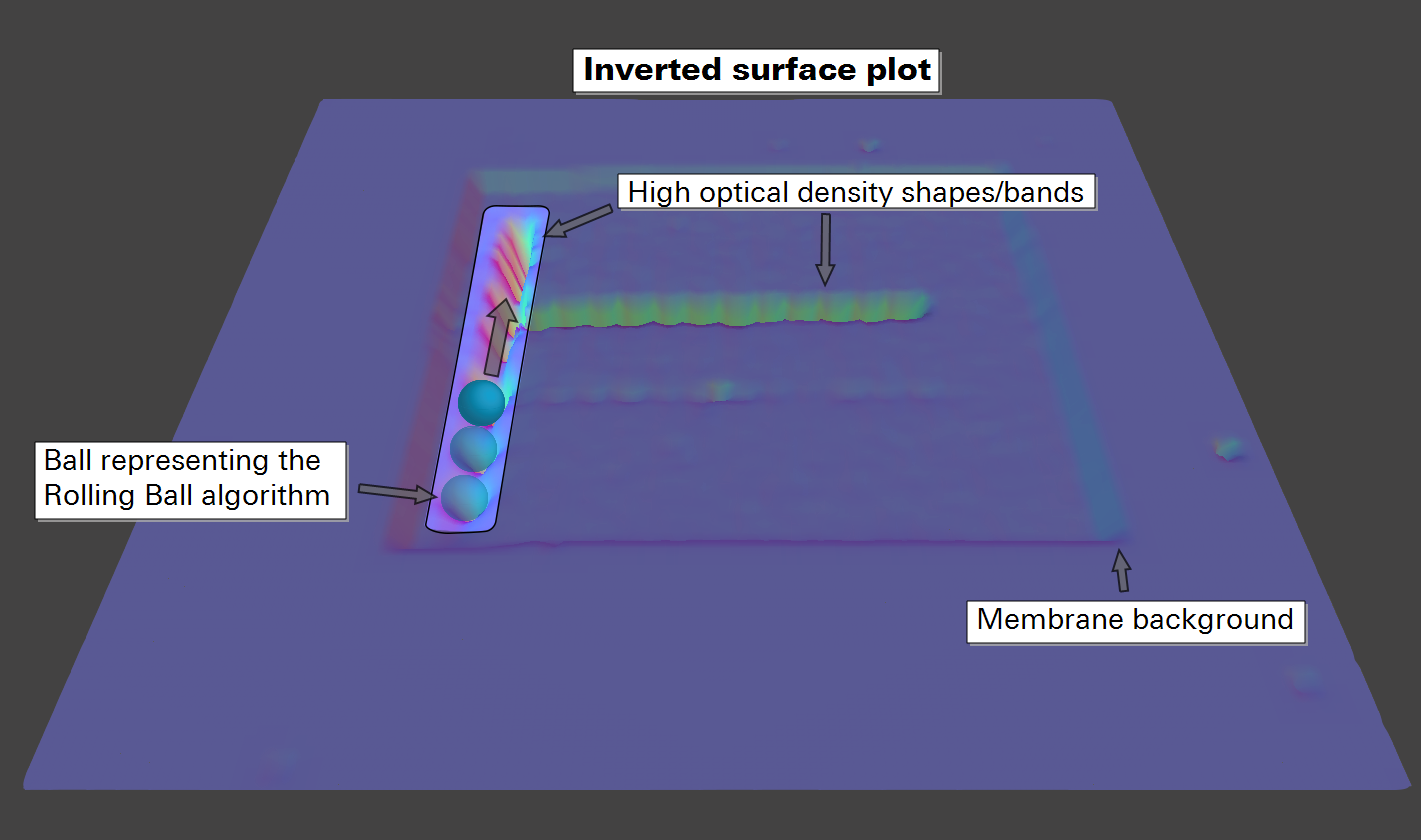
When Rolling ball is applied to a lane, a background curve is determined by traversing the ball beneath a lane profile representing the average pixel intensity across each row of pixels in a lane
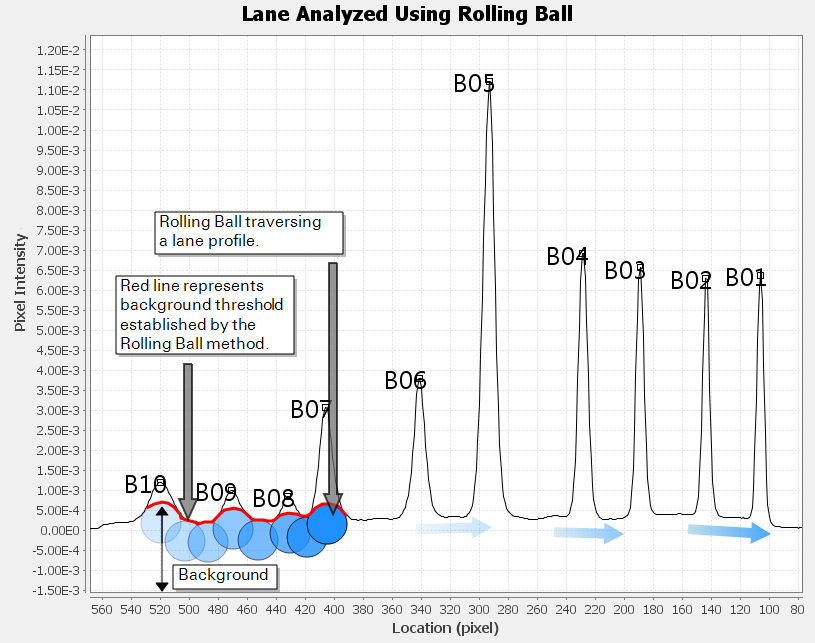
Whether Rolling ball is applied to an entire image or a lane, an appropriate radius must be chosen for accurate results. The correct radius is dependent on many factors: image resolution, shape width, shape separation, and shape overlap. When choosing a radius, a quick rule of thumb is to make the radius the same size as the largest feature in the image or lane that is not part of the background.
However, many factors that affect Rolling ball's accuracy are likely to vary throughout an image, so applying Rolling ball to an entire image is discouraged. Even within a lane, shapes that vary widely in size and shapes that overlap can decrease Rolling ball's accuracy.
When deciding if Rolling ball is appropriate for a particular image, consider the description of Rolling ball from the ImageJ documentation:
"Removes smooth continuous backgrounds from gels and other images"
- ImageJ User Guide | 29.14 Subtract Background… (acc. 9/15/16)
If the background does not appear smooth and continuous, another approach may be necessary.
The two primary differences between Rolling ball and Image Studio Lane background are:
- Rolling ball requires a user to choose a radius for a ball that will be applied to individual lanes or to the entire image. Lane does not require user input to accurately subtract background.
- Rolling ball can be applied to an entire image or a lane. Lane background is applied only to a lane.
When Rolling ball is used to subtract background from an entire image, the image will visibly change. Background subtraction does not change the image's appearance in Image Studio Software, but background correction is still occurring (as long as None is not chosen).
Rolling ball can be effective for subtracting background from images that have smooth and continuous backgrounds. However, it is difficult to accurately subtract background using Rolling ball for lanes and images that have closely-spaced shapes or shapes with widely variable sizes.
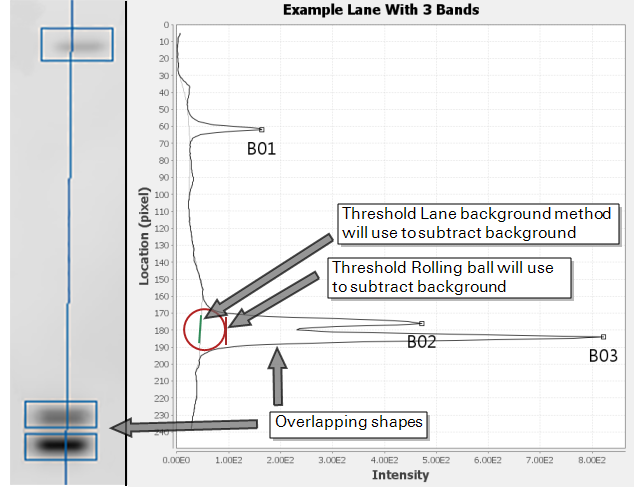
For example,
By contrast, the Lane background method will trace a background threshold beneath the double peaks. Lane background does not use the local minimum between shapes B02 and B03 to create the background trace, because the algorithm avoids creating steep lines that would cut into a signal peak.
Building File Names Using Column Fields
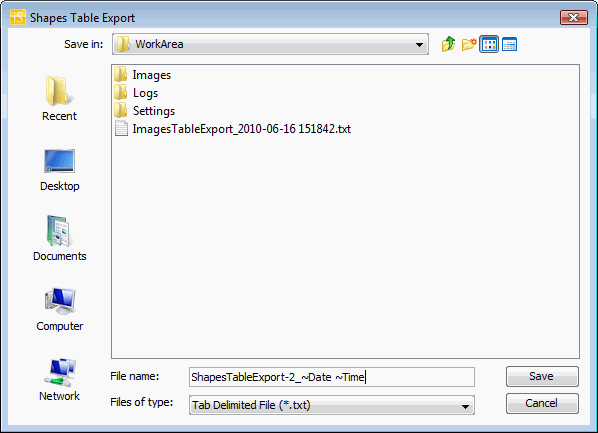
The Export Selected Images dialog has an Edit Name button that displays the Edit Name dialog allowing you to include column name fields in the file name. You can also include column name fields in other export dialogs by entering the column name fields manually.
The name that you enter must be preceded by a tilde for the field to be replaced by the current value. In the example below, the user accepted the default file name, ImagesTableExport_~Date and appended a Time field, preceded by a Tilde (~).
Use the following table to find the name(s) that you want to append to the file name.
To Use This Column Name | Insert This Name Preceded by a Tilde (~) | Description |
Date | Date | Current date in the format YYYY-MM-DD |
Time | Time | Time in the format of HHMMSS |
Work Area | Work Area | Work Area folder name |
Image ID | ImageID | Values supplied from current acquisition |
| Image Name | Image Name | |
Acquire Time | Time Stamp | |
| Instrument Name | InstrumentName | |
| Channels | Channels | |
Integration Times | IntegrationTimes | |
| Resolution | Resolution | |
| Focus | FocusPosition | |
| Time Point | TimePoint | |
| Delta-Min | TimePointDeltaMinutes | |
| Delta-Hour | TimePointDeltaHours | |
Normalization Channel | NormalizationChannel | |
| <specified custom name> | CustomField1 | |
| <specified custom name> | CustomField2 | |
| <specified custom name> | CustomField3 | |
| Project | Project | |
| User | User | |
| Analysis | AnalysisType | |
| Organization | OrganizationName | The organization specified in Preferences |
Animal ID | AnimalID | Editable fields that can be included in the Images Table and values supplied by the user |
| Orientation | Orientation | |
| Treatment | Treatment | |
| Inject Time | InjectTime | |
| Experiment | Experiment | |
| Comment | AnimalComment | |
| Mouse Strain | MouseStrain | |
| Agent | Agent | |
| Cell Line | CellLine |
Glossary
Acquire: Obtaining an image, by instrument or by importing an image file.
Acquisition: Image and its Data Analysis.
Analysis Type: Can include Westerns, ICW, DNA Gels, and more. After specifying the Analysis type, the user is presented with a predefined set of acquisition parameters and analysis.
Application Button: The large button in the upper left corner of the application window that contains a menu of operations that in some applications are most usually found on the File menu.
Background Type: Method of calculating background
Band: A feature in a lane that indicates detection of a protein or DNA.
Bands Table: A tabular view of values in the Band fields, both automatically and manually assigned.
Boundary: Outline of lanes area. To see the outline be sure that Boundary is checked in Show options.
Button: A small icon that issues a command when clicked.
Channel: A description of the method used to collect pixel values. The description is usually a single word or number approximating either the emission and/or detection wavelengths or the detection method.
Columns: A set of values assigned to each image or feature. For example, Image columns for each Image are viewed in the Images Table. Some values are automatically assigned during the acquisition process based on acquisition parameters, (Resolution, offset, channels, date-time of acquisition, for the Image columns for example.) Other columns are manually assigned..
Comb: An apparatus used to form the wells in a gel. A setting for determining number of lanes in the Western MPX Analysis.
Ellipse: An elliptical shape, that can be quantified, drawn around some section of the image.
Export: A command on the Application menu as a way to copy or move images and data.
Feature: A box, circle or other shape drawn around some section of the image. This object is visible on the Image View and can be quantified.
Filters: Ways to restrict the Image Table view when many images are loaded into Image Studio.
Group: A group of related commands in a Task Tab or ribbon (e.g., the Filter group in the Table tab).
Image: The viewable result of the Acquire action. This also refers to the set of all individual channels and all analysis and logs. An Image-ID, a unique number, is automatically assigned to each image as the result of an acquisition.
Images Table: A tabular view of values in Image fields, both automatically and manually assigned.
Key Tip: Letter(s) and numbers for accessing commands using the keyboard. Pressing the ALT key activates Key Tips.
Lab Book Report: A customized report of selected images and table data. This report is found on the Application menu's Print menu.
Lane: A group of bands visible in the image that have the same channel, sample, primary, secondary, and tertiary (if defined) attributes. In a Western, there is on lane per channel per well. In an MPX™ Western, there is one lane per channel per MPX apparatus groove.
Lanes Table: A tabular view of values in the Lane fields, both automatically and manually assigned.
LUT: Lookup Table. Used to transform the raw pixel data from an image channel into a grayscale or color for display..
Marker: A mixture of labeled proteins or DNA having defined size. Also known as Sizing Standards.
Marker Lane: A lane that contains a marker.
Profile: Graphic display of a band or lanes showing pixel location and intensity.
Quick Access Toolbar: A group of buttons located to the right of the Application Button. Used to perform common commands.
Rectangle: A rectangle shape that can be quantified, drawn around some section of the image.
Ribbon: An area at the top of the application window containing the Application Button, Quick Access Toolbar, and a set of Task Tabs.
Shape: This describes the geometry of a feature. Examples are square, ellipse, polygon, auto, band.
Shapes Table: A tabular view of values in the Shapes fields, both automatically and manually assigned.
Task Tabs: A tab located in the Ribbon containing Groups. Command Tabs are always visible. The visibility of Contextual Tabs is determined by the selection.
Title Bar: The bar above the application window that displays the name of the program and the current image.
Toolbar: A group of buttons.
Tooltip: Hover the mouse over a button or control in a dialog to display a brief explanation of the control.
Well: A depression used to contain a sample. In a Western or MPX Western, wells are created in the gel by the comb. In a microplate, the wells are features of the plate.
Western: Western Blot. A method in molecular biology to detect a certain protein in a sample by using antibody specific to that protein.