
Tour #1: OPEN Overview
Running OPEN
OPEN is the name of the program that controls normal operation of the LI-6400XT and the one you’ll be running most of the time. This program begins to run automatically after you power on (unless you intervene), as you’ll see in the following steps.
- Turn the LI-6400 ON
- About 10 seconds will pass while the display shows1:
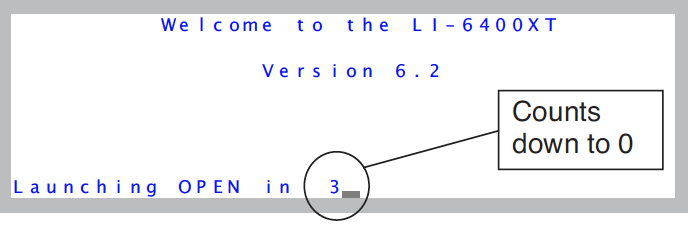
INITIALIZING.- followed by a series of start up messages. Eventually, you should see:
- Press enter or wait
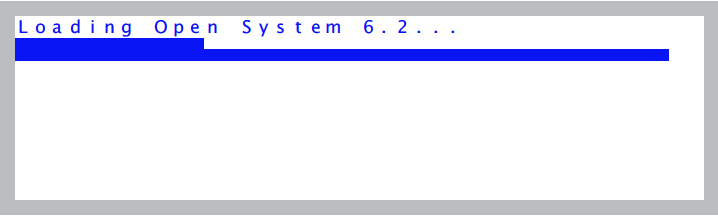
- If you press escape, you’ll prevent OPEN from loading, and will access the LPL screen (The LPL Screen on page 5-19 in the instruction manual). If you press enter (or nearly any other key), OPEN is loaded (Figure 3‑3), which takes about 5 seconds.
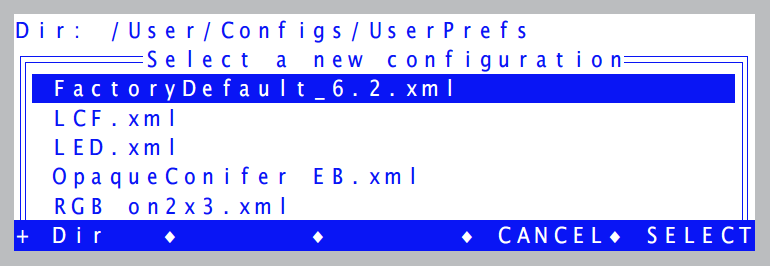
- If asked, select a Configuration
- Once OPEN’s bar chart finishes, you might be asked to pick a configuration file (Figure 3‑4). (If there is only one configuration file on your instrument (e.g. a new instrument), then you won’t be asked to do this.)
- A configuration file contains settings and values used by OPEN. Configuration files are easy to create and modify. There is an introductory tour later in Tour #6: Configuration Introduction.
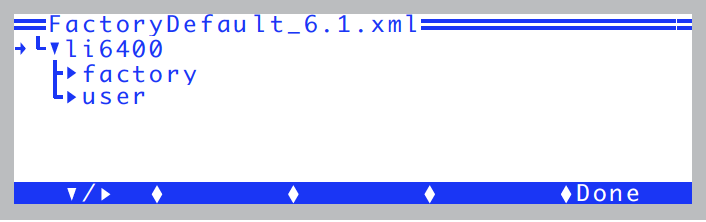
- For now, however, select
FactoryDefault_6.2. When it is highlighted, press enter. - Power up the IRGAs.
- After a few more seconds, and several more messages, you’ll be asked
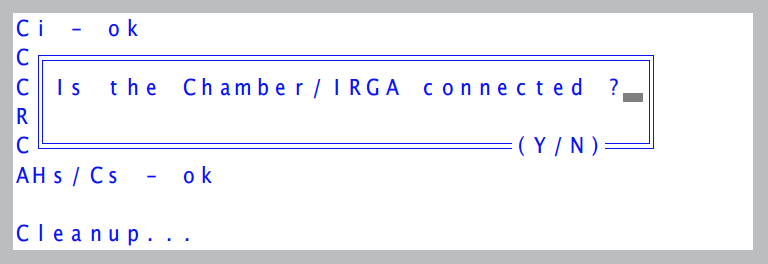
- Press Y when you have both electrical cables between the console and the sensor head connected.
OPEN’s Main Screen
After some more messages, OPEN’s main screen appears (Figure 3‑5). This screen represents the home base of operations for OPEN. The function keys (f1 through f5) have 2-line labels above them on the display; these are used to access the various menus and routines available in OPEN.
Normally at this point, one would do a series of checks before making measurements, and these are described in Preparation Check Lists. We’ll skip these checks for purposes of our tours.
Connecting and Disconnecting the Chamber/IRGA.
Once the OPEN screen appears, you should not connect or disconnect the chamber or IRGA cables while OPEN is running without first putting the instrument “to sleep” via the Sleep Mode function in OPEN’s utility menu. You run the risk of blowing fuses, and (when the 6400-02 light source is on) the chamber connector can carry dangerous voltage (>100 V).
Powering Off
OPEN’s main screen is a safe place to be (or return to) when you are ready to power the instrument off. If you are anywhere else, you may have files open, and could risk losing data if you power off then.
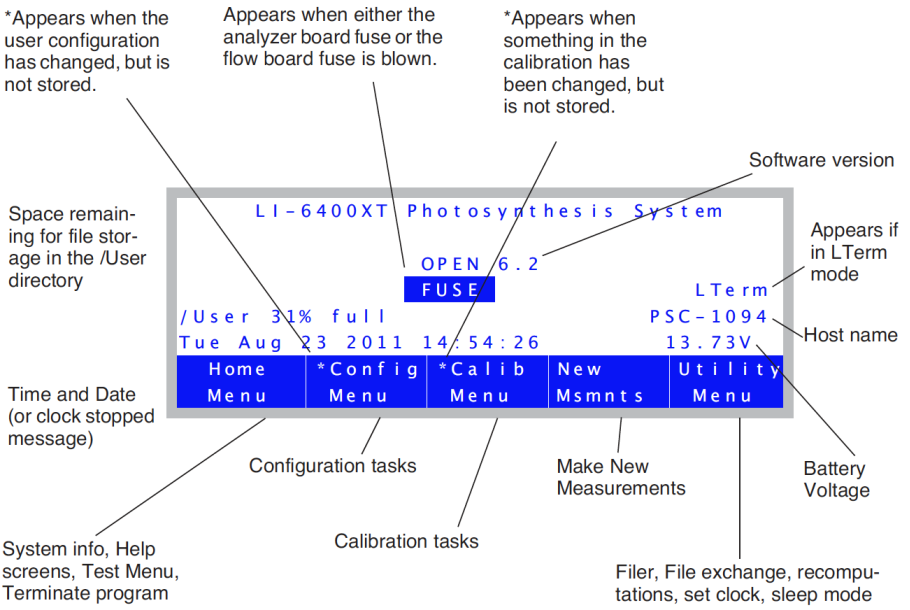
Alert Messages in OPEN’s Main Screen
OPEN’s Main Screen can show four alert messages. Here’s what they mean, and what to do about them.
FUSE
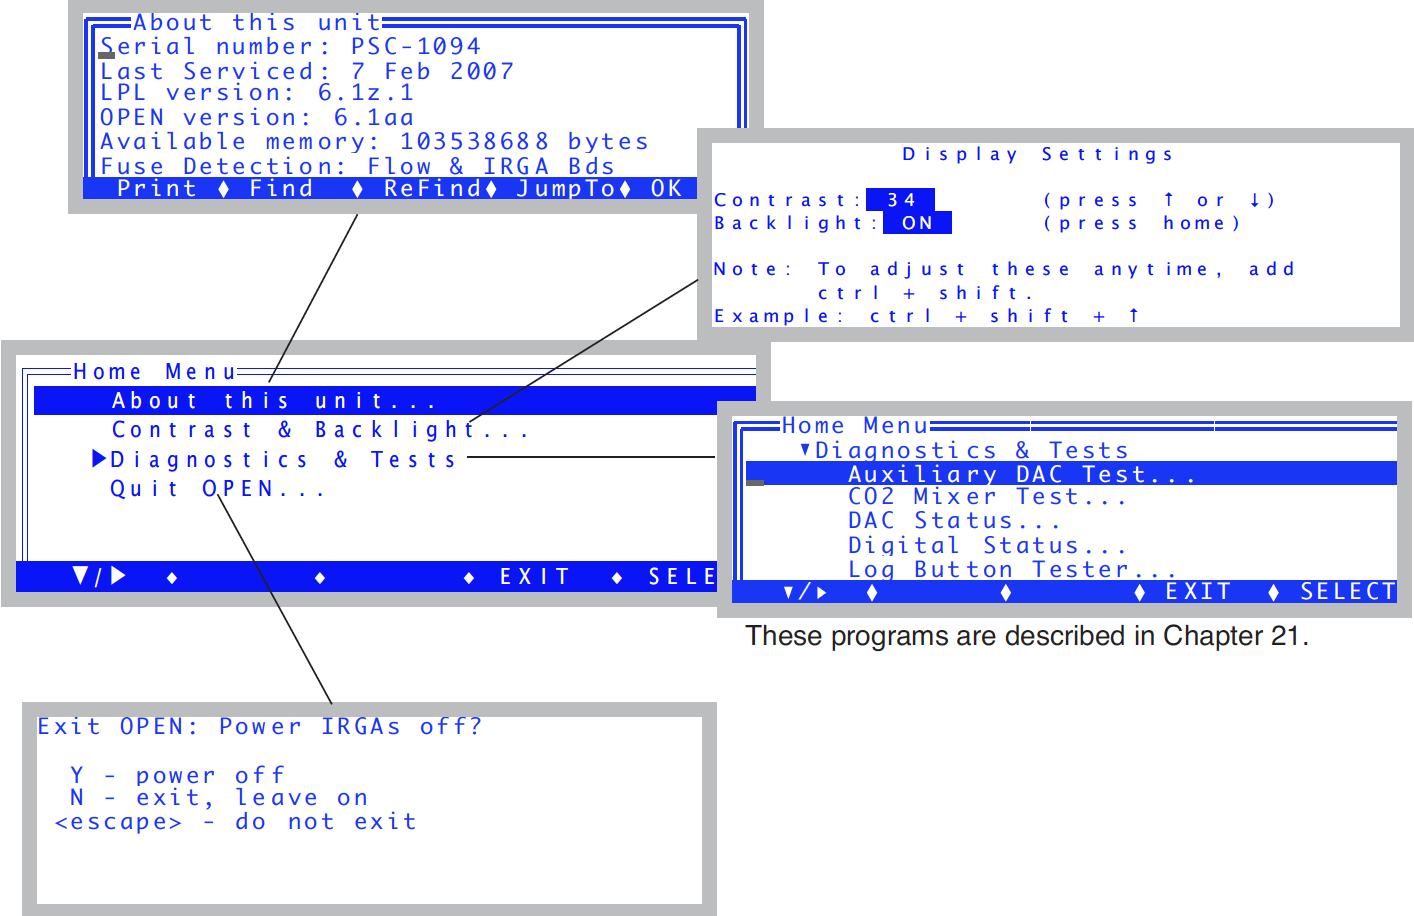
If the instrument has serial number PSC-401 or above, or if it has been upgraded with a new back plane board, the FUSE message will appear if the flow board fuse or the analyzer board fuse is blown. See Replacing the Fuses. (To find out if your upgraded instrument is capable of producing this alert message, check for “Fuse Detection” in the “About this Unit” screen, found in the Home Menu, as shown in Figure 3‑6.)
* in Calib Menu label
This message appears if something calibration-related has changed and not been stored. To see what it is, press f3 (Calib Menu), and follow the asterisks. For details, see Managing Calibration Data.
* in Config Menu label
The instrument’s configuration has been changed, but is not stored. To see what has changed and/or store it, press f2 (Config Menu) and follow the asterisks.
Clock Stopped
This message will appear instead of the time and date if the real time clock is not operating. See Real Time Clock Problems.
The Home Menu
The Home Menu is not used very often, but we’ll point out some things that might bring you here.
- Access the Home Menu
- From OPEN’s Main Screen, press f1 to access the Home Menu.
- Select “About this Unit”
- The “About this Unit” entry will show software versions, date of last service, and other useful information (Figure 3‑6).
- Press escape
- To return to the Home Menu
- Select “Contrast & Backlight...”
- This will open a screen that lets you adjust the contrast (press ↑ or ↓), and turn the display backlight on and off (press home).
- Note: you do not have to actually be in this screen to make these adjustments. They can be done anytime by pressing shift+ctrl+↑, shift+ctrl+↓, and shift+ctrl+home.
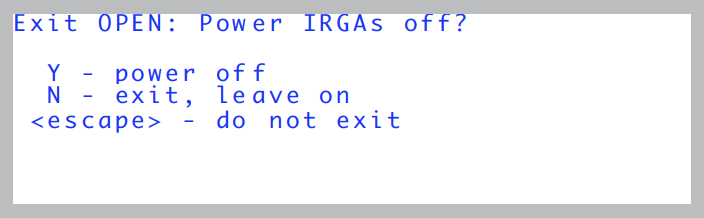
- A word about exiting OPEN
- The bottom entry in the Home Menu will ask if you wish to terminate OPEN. If you press Y, the program will turn off the flow control board and the analyzer board. If you press N, the boards are left on. It is not necessary to do either of these when turning off the instrument: you can just press the power switch while in OPEN’s main screen.
- Return to OPEN’s Main Screen
- Press escape to exit the Power off screen, then escape again to exit the Home Menu.
The Config Menu
The Config Menu (Figure 3‑7), accessed from OPEN’s Main Screen by pressing f2, is used fairly often. As the name implies, anytime you need to do something involving the instrument’s configuration, you will likely be visiting this menu. This menu has its own tour (see Tour #6: Configuration Introduction).

The Calib Menu
The Calib Menu (Figure 3‑8) is used when calibrating a CO2 mixer or light source, and for zeroing and spanning the IRGAs.
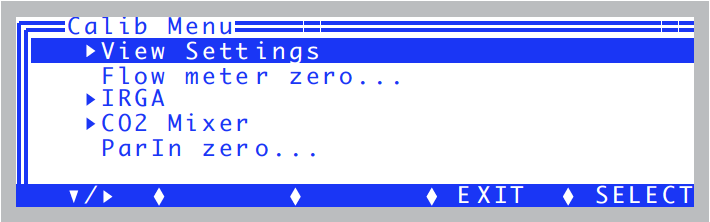
When expanded, the Calib Menu looks like this:
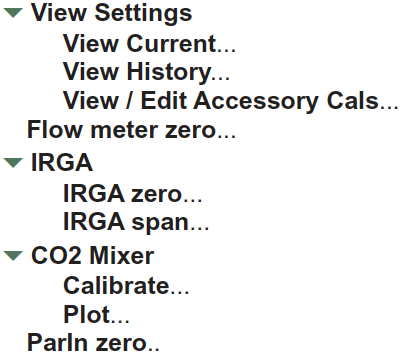
Chapter 18 in the instruction manual discusses this menu, but for now we’ll just do a simple task: view the current settings.
View Current Settings
We’ll view the calibration "tree", which is a structure that contains all the calibration-related values and settings.
- Select “View Current...”
- If necessary, expand the View Settings entry by highlighting it and pressing f1. Then highlight
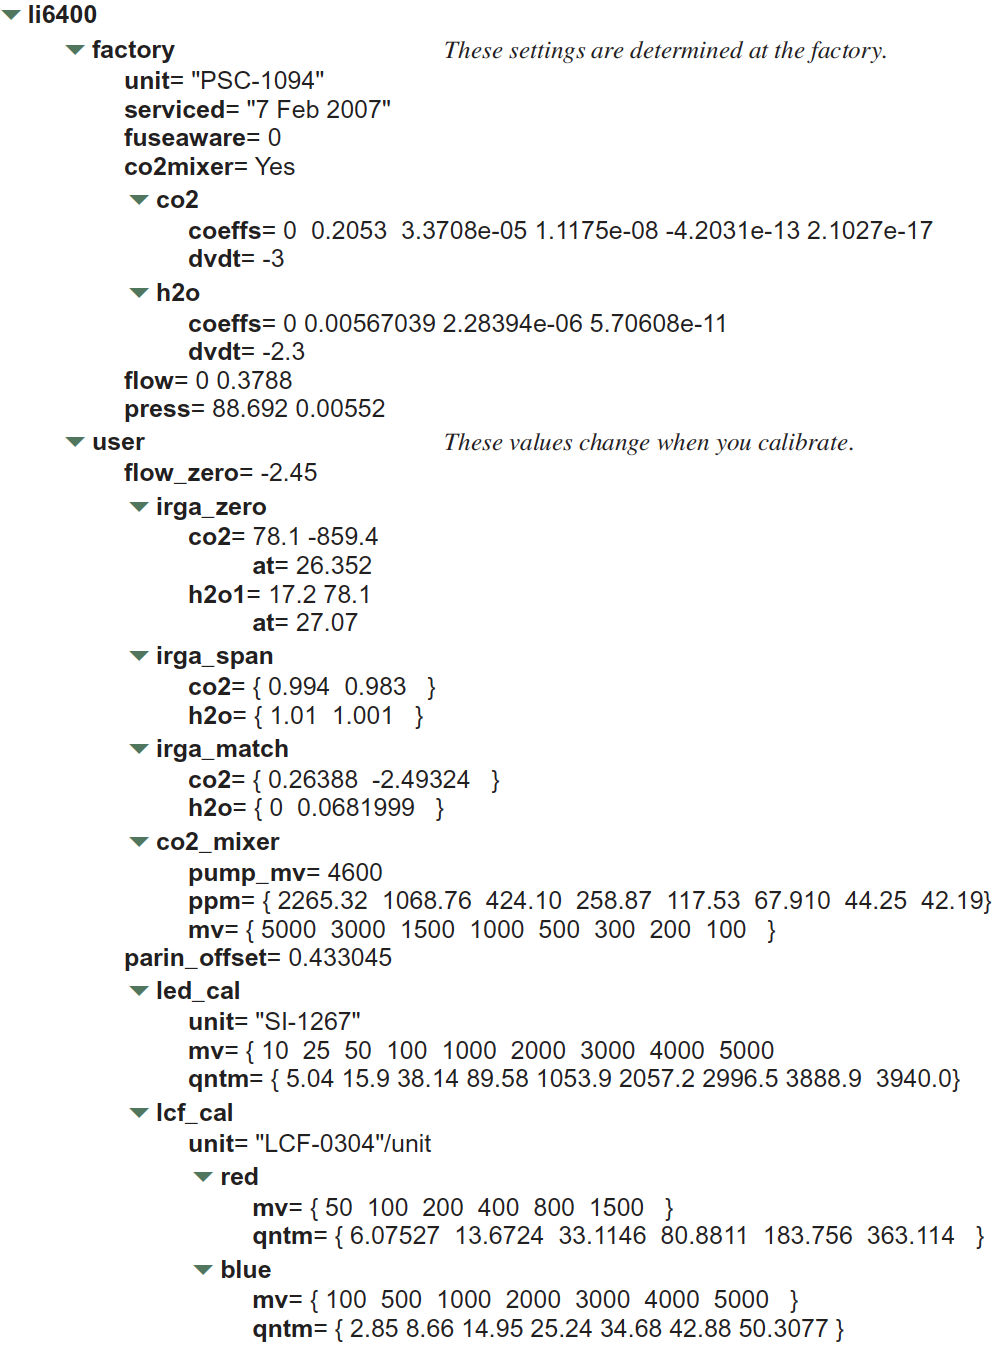
View Current...and press f1. You should see a tree whose root node isli6400. -
- There are two sections to this tree: factory holds calibration coefficients for the various sensors. These values are set, as you might expect, at the factory. User holds calibration values that get adjusted when you do calibrations, such as zeros and spans.
-
- Explore
- Expand various nodes of the tree to see what’s there. For details, see Managing Calibration Data.
- Return to the Calib Menu
- We’re done, so press escape or f5 (Done).
- Return to OPEN’s Main Screen.
- Press escape to leave the Calib Menu.
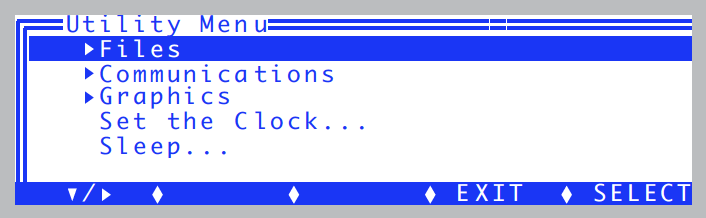
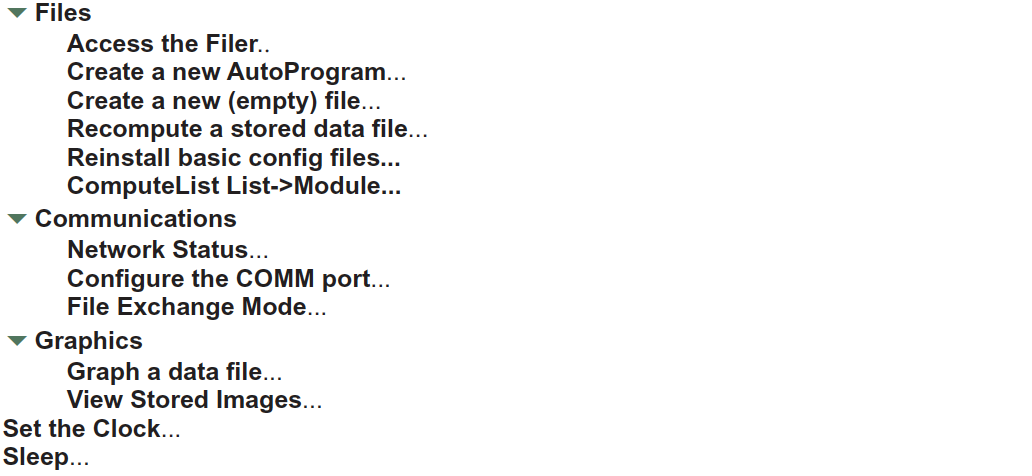
The Utility Menu
The Utility Menu (Figure 3‑9) has a collection of useful things that you’ll occasionally need to do while using OPEN.
New Measurements
The final stop on this first tour is New Measurements mode (press f4). This is where you make measurements, control chamber conditions, log data, and the like. It has its own tour, so keep reading.