If you’re using a Western blot for a quantitative comparison of different treatments of the same sample(s), you need a way to reliably and appropriately look at your experimental outcomes in tandem. That means normalizing signals that are detected within the linear range and are proportional to protein expression. But it also means taking the definition of quantitative a bit further. It’s possible to get two quantitative Western blots and yet still compare them inaccurately. Proper analysis takes all factors into consideration and reduces variability wherever possible. It’s a bit tedious, but absolutely necessary.
“Data comparisons should only be made from comparative experiments, and individual data should not be utilized across multiple figures.”
So if you dare to compare, do so with care.
Proper analysis can solve many headaches. You may be wondering how to normalize samples of two different groups from different animals. Or maybe you’re trying to perform cross-blot comparison from one experiment. Protein quantification is a tricky thing – try to keep consistency in mind.
Compare with consistencyAnalyze bands on the same blot
“Most importantly, it is possible to compare two blots only if they present exactly the same conditions, using different lysates derived from cells cultured and treated in the same way.”
We advise against comparing multiple film exposures or combining data captured on different pieces of film. Multiple film exposures from the same blot are captured under different time points, meaning the raw data are ever changing. What’s more, film detects signals with a shocking lack of proportionality with both high and low intensity signals. (Seriously, the physics regarding film’s reciprocity failure are fascinating.)
Then, once you’ve got a bunch of pieces of film, you’ll need to get them digitized for protein quantification and eventual publication. No problem, you say. I’ll just pop it in my trusty office scanner. Sorry, but 1970 called, and it wants its densitometry back. Optical density (OD) values underestimate strong signals due to how quickly film saturates. This disappointing dynamic range of film makes densitometry an art rather than a science. Hint: your science should be a science.
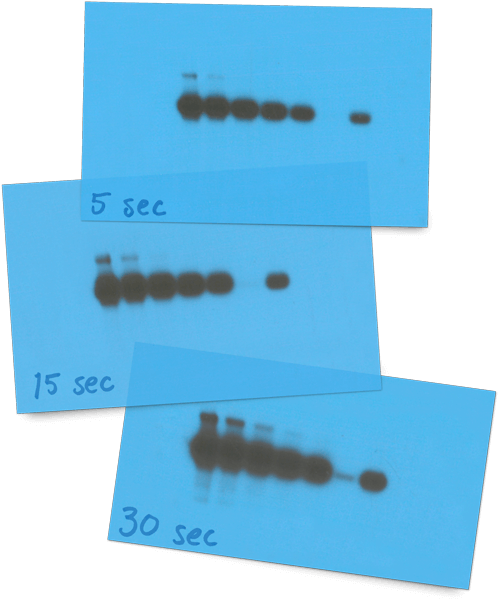
“Film can make small differences in abundance appear as large differences in band intensity. When saturated, film exposures can also hide sample-to-sample variations in high-abundance proteins such as loading controls.”
Stripping is not uniform across the entire blot, creating additional variability. Light stripping leaves antibodies behind and creates artifacts. Harsh stripping leads to a loss of sample proteins from the membrane. For these reasons, stripping and reprobing is not recommended for quantitative Westerns.
“Membrane stripping and reprobing is a quantitative trade-off between antibody removal and total protein loss.”
You can simultaneously detect two targets in one sample on the same blot, in the same lane with multiplexing. Multiplexing is dual-color near-infrared detection with two distinct dye-labeled secondary antibodies.
Fluorescent immunoblotting with multiple antibodies makes normalization with an internal control simpler, more convenient, and more accurate. The blot is incubated with primary antibodies raised in different hosts. Secondary antibodies labeled with spectrally-distinct fluorescent dyes are then used to simultaneously detect the internal control on the same blot and in the same lanes as the target protein.

Multiplexing advantages:
Comparing bands in the same lane with two colors is the most quantitative way to analyze Western blots.
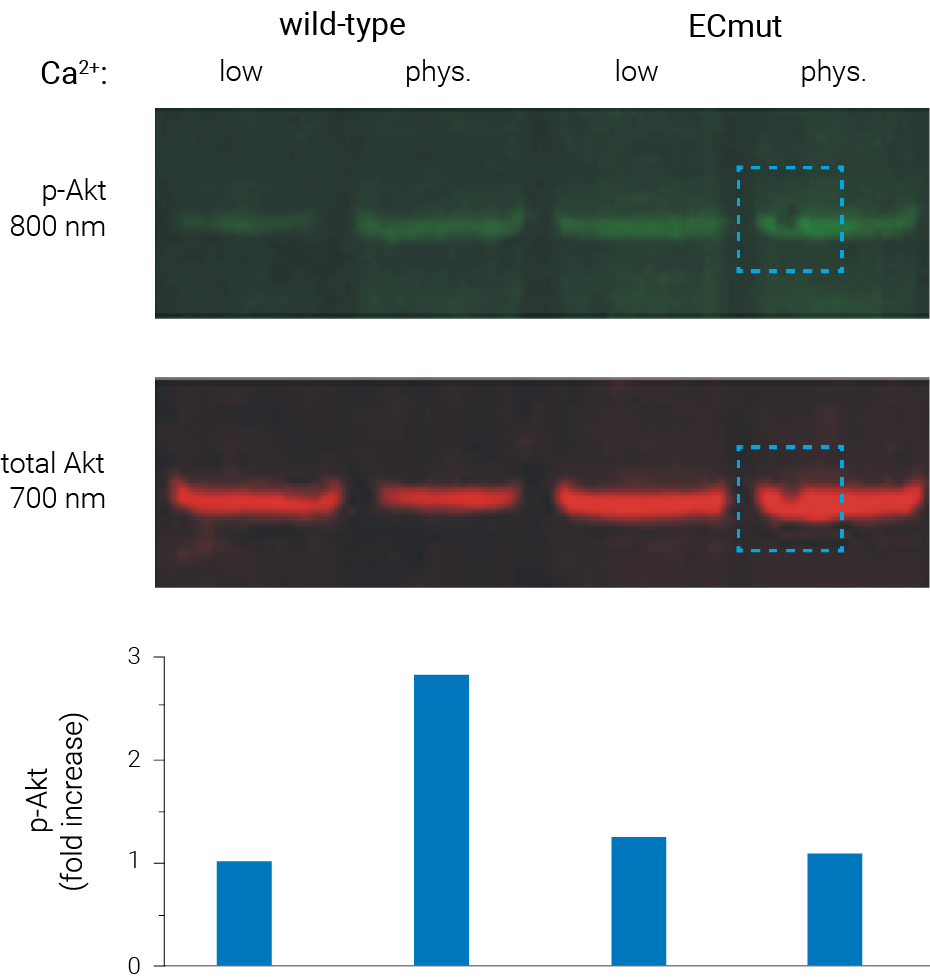
Figure 1. With multiplex Westerns, transfer artifacts affect both protein targets in the same way. In this experiment, Akt (red) and phospho-Akt (green) were detected simultaneously on a single blot. A bubble in one lane affected protein transfer (highlighted area). Because Akt and phospho-Akt were detected on the same blot, in the same lane, quantitative analysis was not affected. Georgopoulos et al (2010) PLoS ONE 5(10): e13621.
“For proteins, two-color analysis on one blot gives faster, more precise measurements of protein expression, by eliminating the variability due to stripping or comparing separate blots.”
It’s best not to compare bands between different samples if they’re on different blots. If this is unavoidable, compare only across replicates that are produced in parallel. Avoid comparing blots that aren’t replicates.
For the best analysis, reduce variability wherever you can. That could mean using digital detection instead of film, or multiplexing instead of stripping and reprobing.
“…blots were standardized so that data from replicate blots could be combined.”
LI-COR provides products, protocols, and support for Western blotting (and a range of other assays) that help reduce variability and increase replicability. Let us know how we can help you.
Get in Touch