At every step, Empiria Studio Software provides intuitive tools to translate great data into meaningful information.
The only software to provide answers at every step for reliable, publishable results.
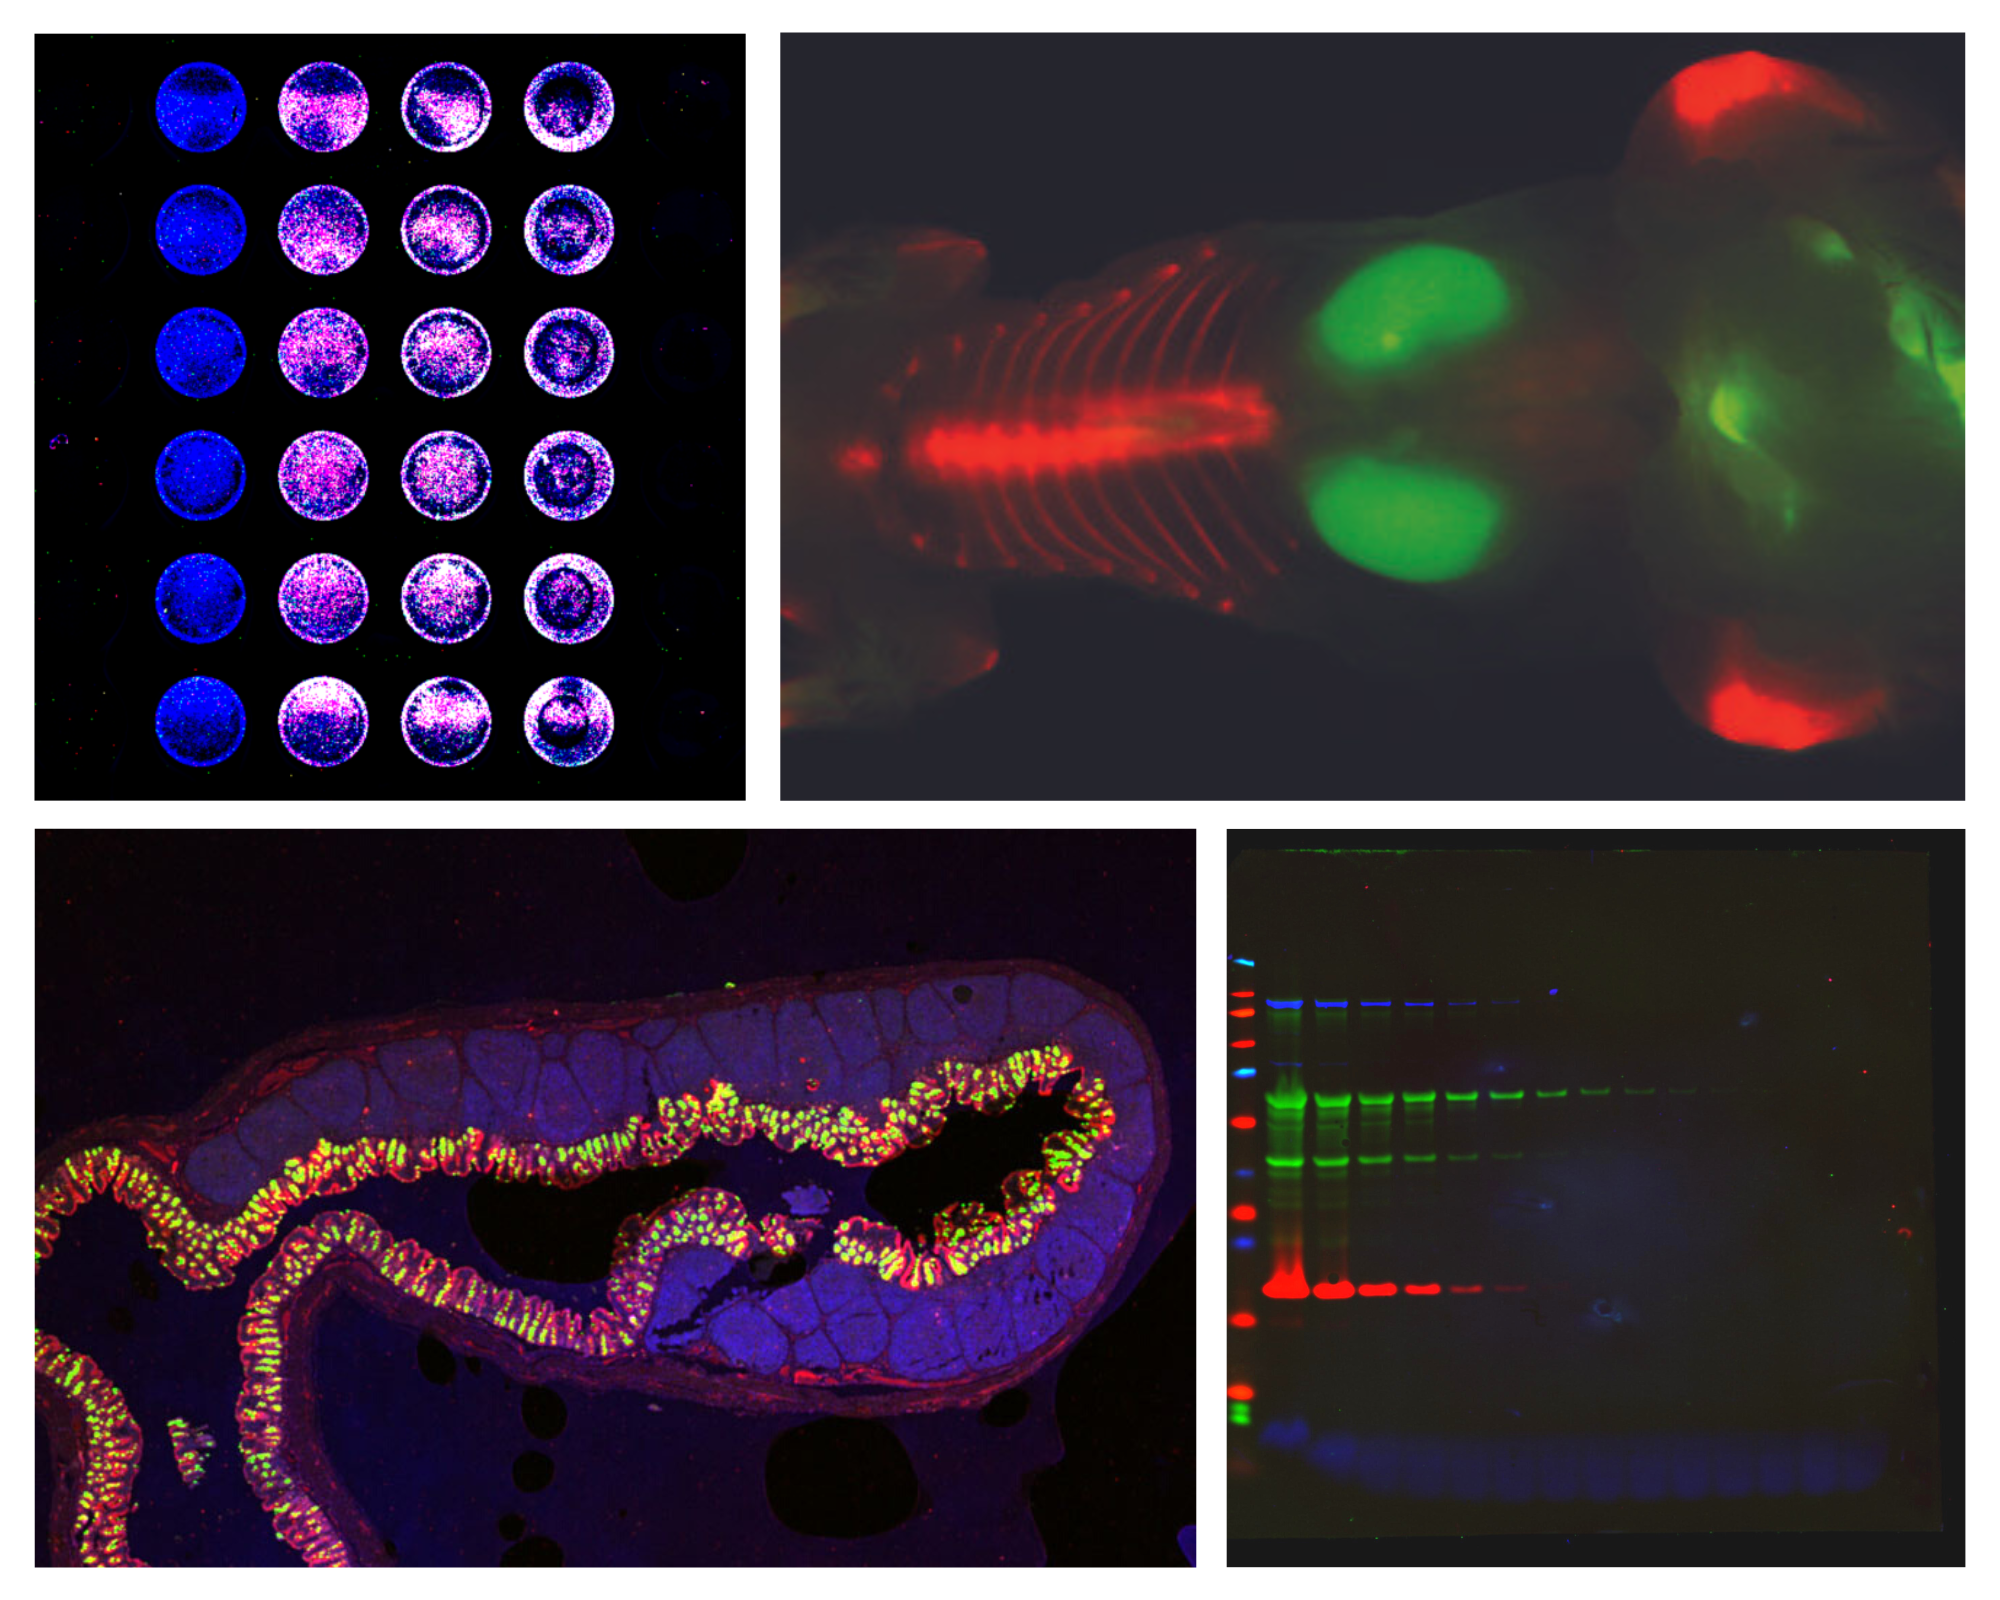
Execute fast, advanced analysis of assay images acquired using LI-COR imagers—including In-Cell Western™ Assays, Western blots, tissue sections, and small animal images.
Determine target protein expression, build a library of validated antibodies, compare replicates, perform in-depth statistical analysis, share results, and much more—all in one software.
| Assay | Analysis Type |
|---|---|
| Qualitative Western Blots | Quick signal identification data and charts |
| Quantitative Western Blots | Comprehensive projects with validation experiments and target analysis, including fold change and statistical calculations |
| Gels | Qualitative and quantitative analysis of protein and nucleic acid gels |
| Multiwell Plates | Comprehensive In-Cell Western, ELISA*, and other multiplex fluorescence cell analysis assays |
| Slides | Quantify, examine, organize, and annotate slide images |
| Small Animal | Quantify, examine, organize, and annotate small animal images |
* There is a bug in Empiria Studio 2.0 - 3.2 Absorbance Assay workflows that causes incorrect calculation of absorbance values. Please see this support page for more information or this page for information about calculating absorbance from Image Studio 6.0 quantification values. Questions? Please contact biohelp@licor.com.
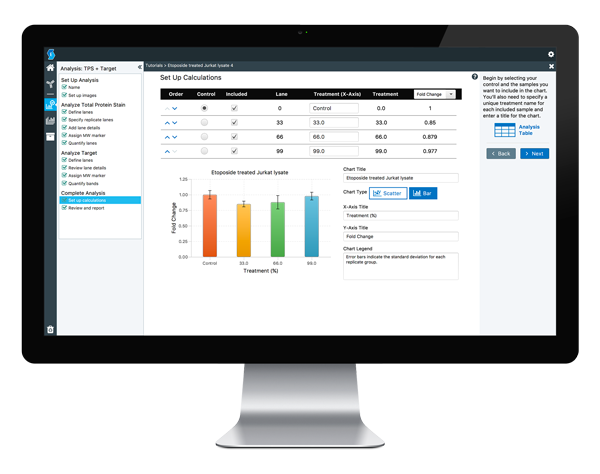
Let Empiria Studio handle the complex math for fast, stress-free analysis.
Empiria Studio takes the guesswork out of quantification. Target protein data is automatically normalized based on your chosen internal loading control, and advanced statistical values are automatically calculated, including % CV, standard deviation, and signal-to-noise ratio.
At the end of a target analysis, Empiria Studio calculates fold change and creates a chart using your data.
Use integrated grant and publisher best practices as a strong foundation for credible imaging results.
Empiria Studio incorporates NIH Guidelines for Scientific Record Keeping and includes Western blot workflows created in partnership with high-impact journals.* This ensures your results meet publication requirements and conform to accepted standards.
*Journal of Biological Chemistry, Nature Publishing Group, Rockefeller University Press
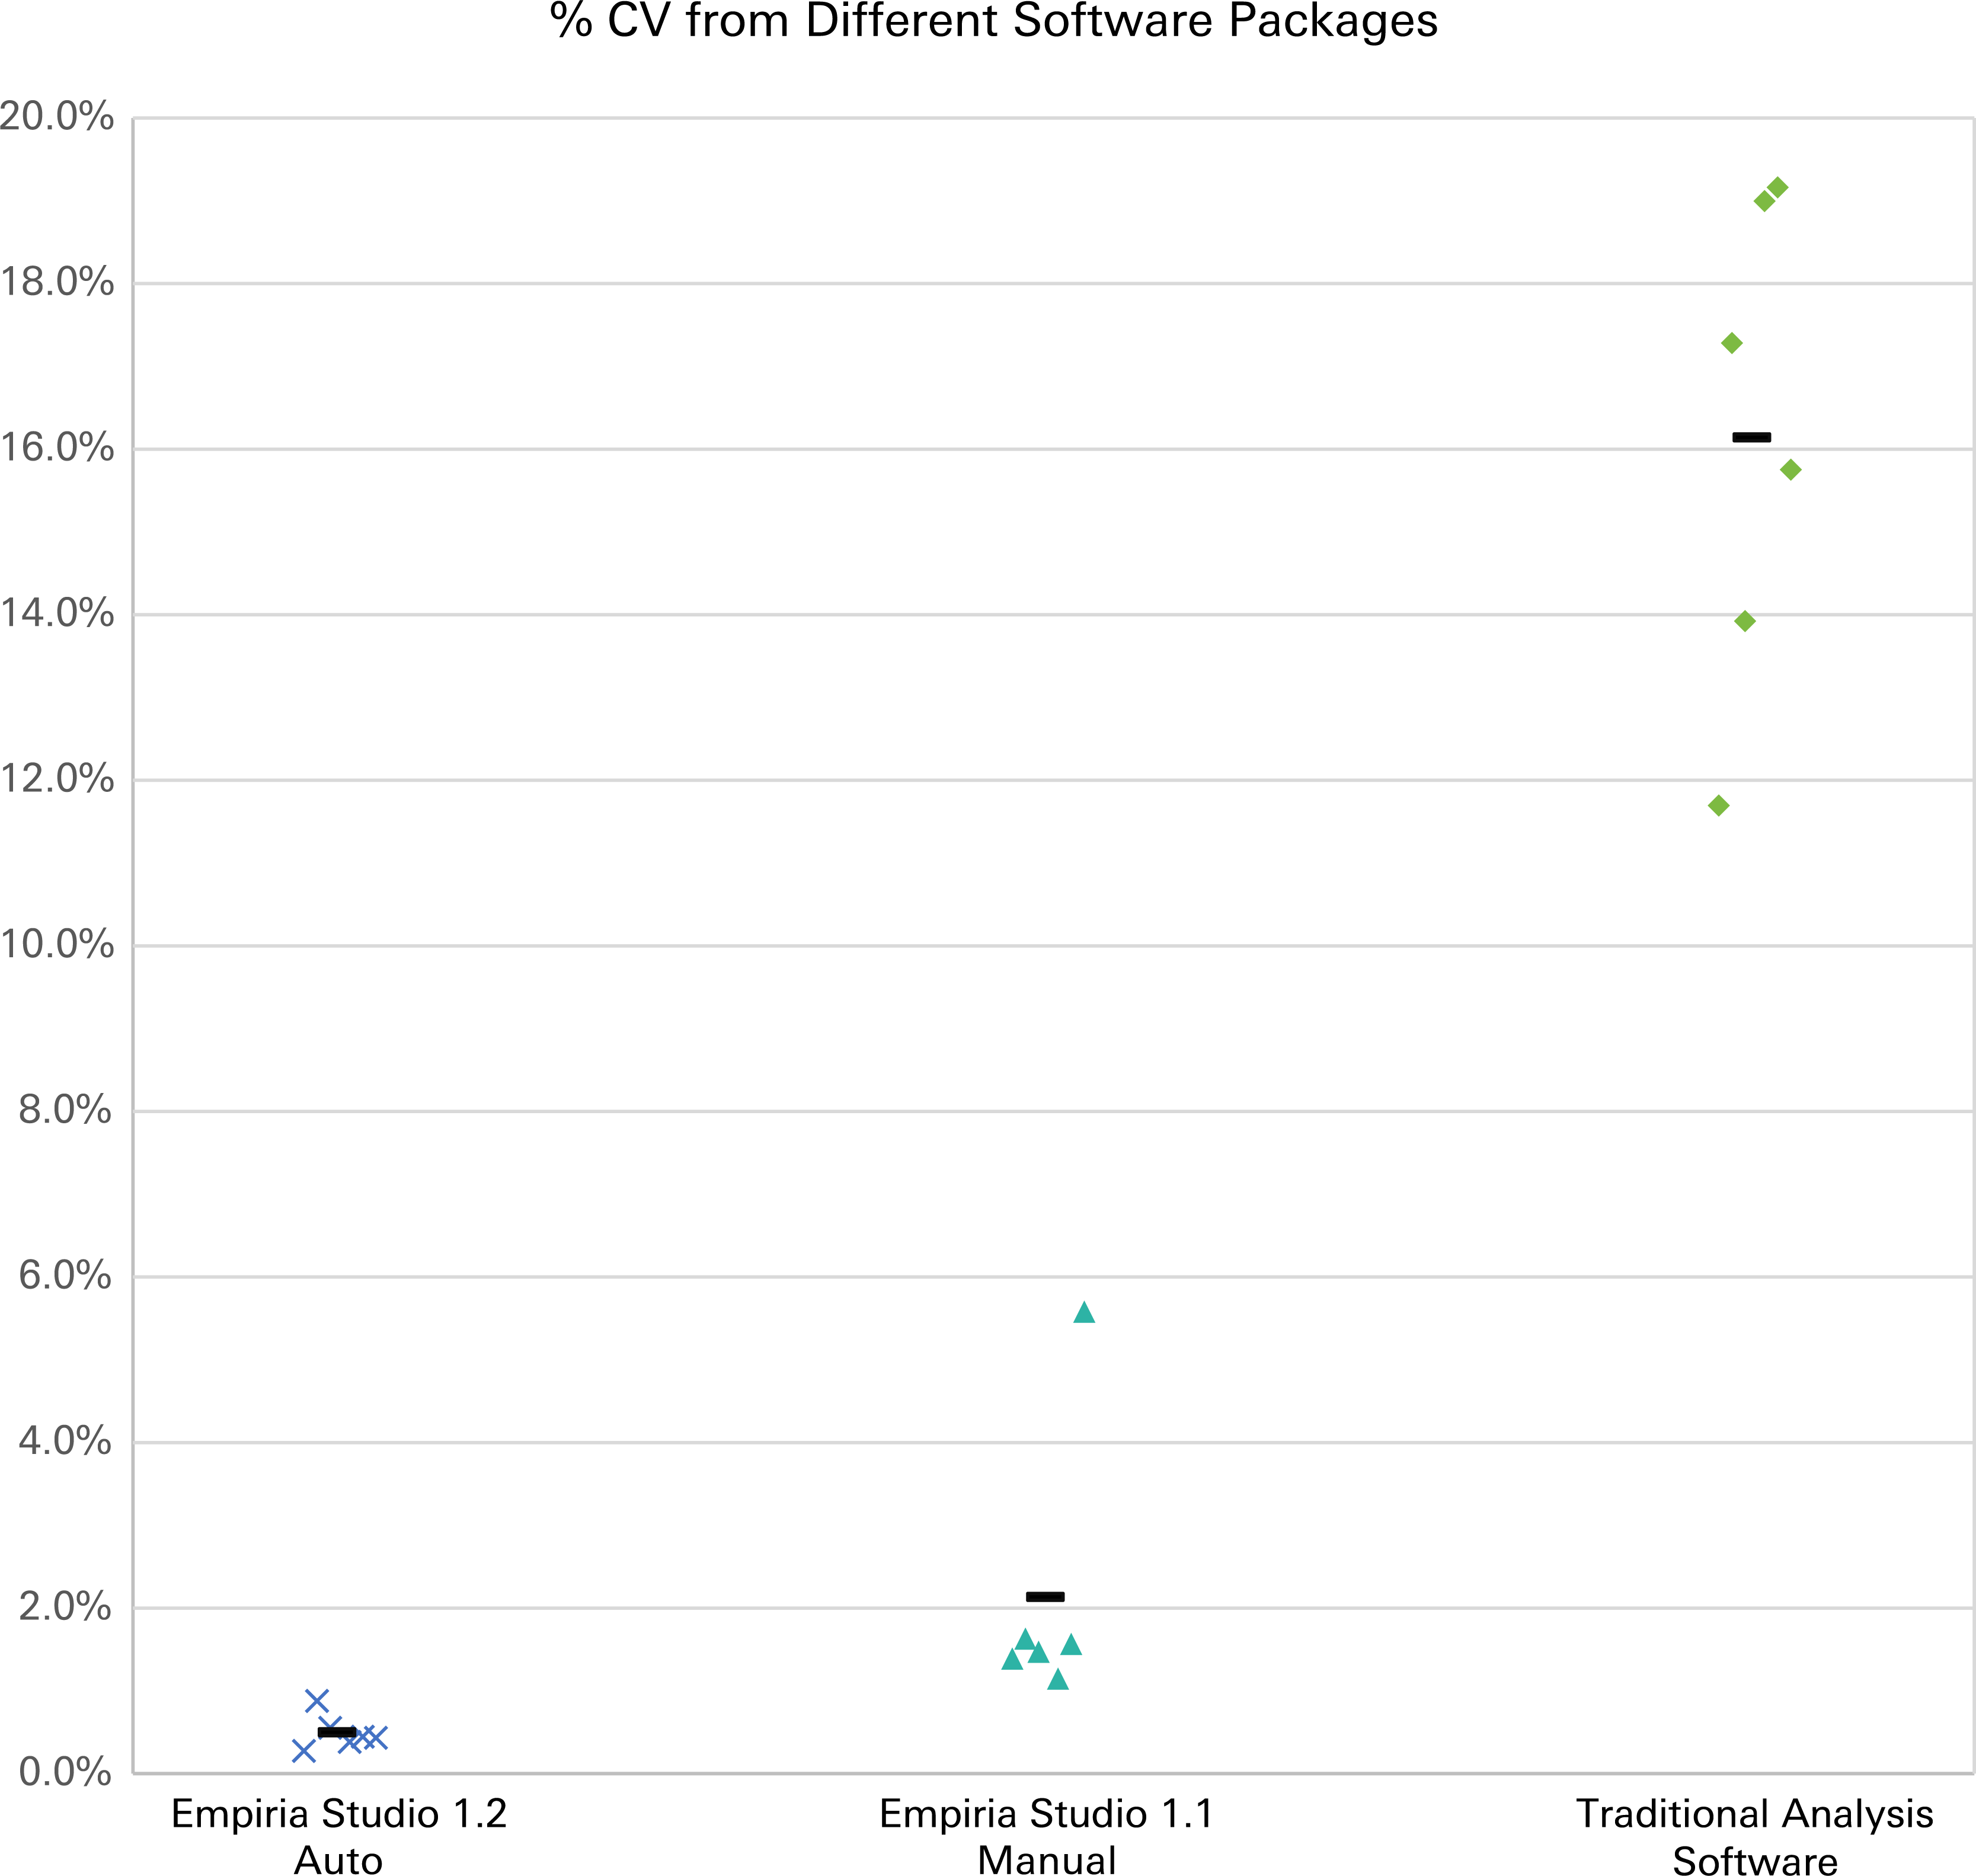
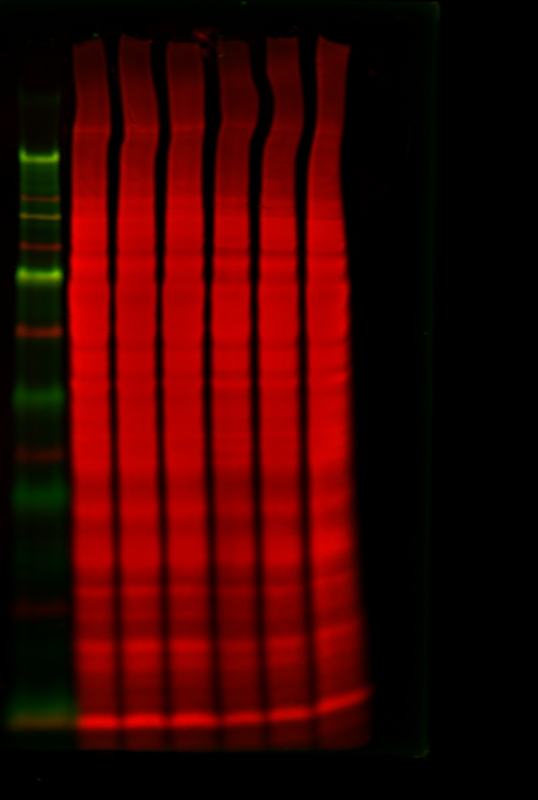
Get more consistent results faster with patented lane finding.
Compared to manual methods, Adaptive Lane Finding accelerates analysis and eliminates variability from manual lane placement. Analyze up to 26 lanes and multiple channels with up to two targets per channel.
In conjunction with Adaptive Background Subtraction, Adaptive Lane Finding improves total protein stain quantification to maximize the reliability of your Western blot results.
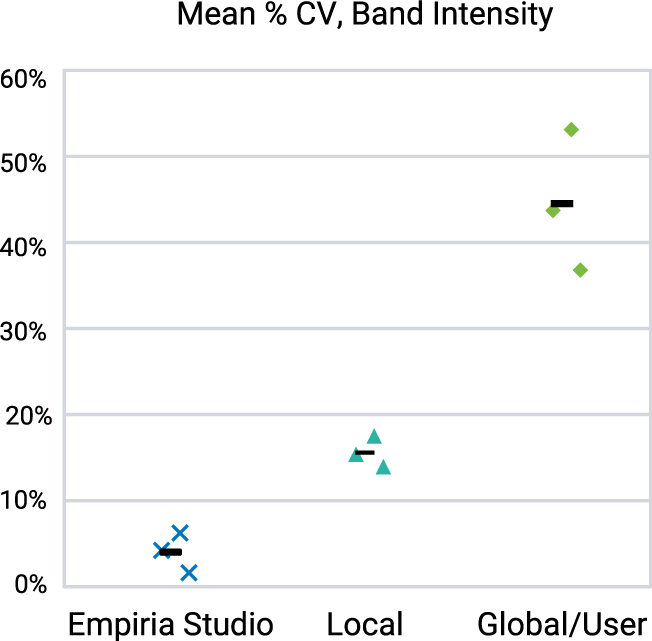
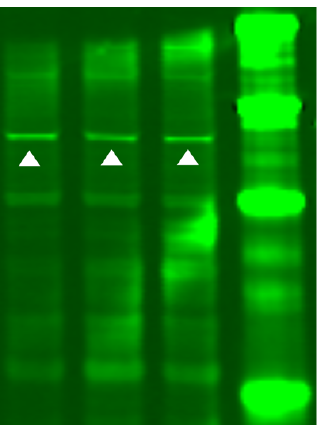
Quantification in Empiria Studio uses a patented background subtraction method optimized for consistency.
Adaptive Background Subtraction adjusts to the unique background in each image and subtracts background automatically. Because users do not need to choose a background subtraction method, variability from user choice is eliminated and results among multiple researchers are consistent.
Empiria Studio uses intuitive analysis workflows for consistent image analyses among all users.
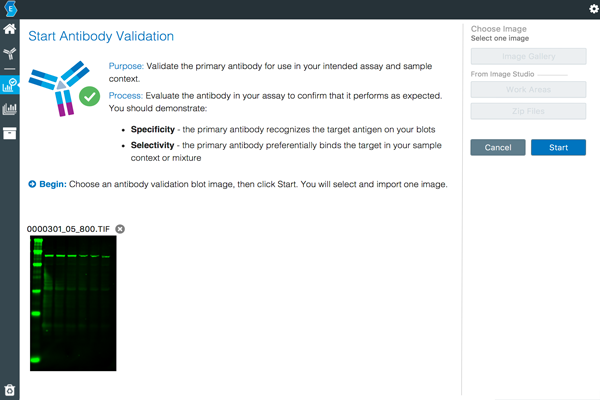
Confirm that a primary antibody is specific and selective to its expected target using the Antibody Validation workflow.
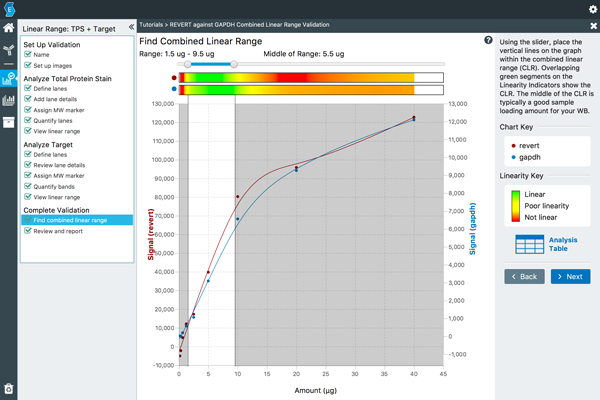
Use the Combined Linear Range Determination workflow in every membrane-based experiment; otherwise, it can be difficult to load the correct protein amount and accurately measure changes in protein expression.
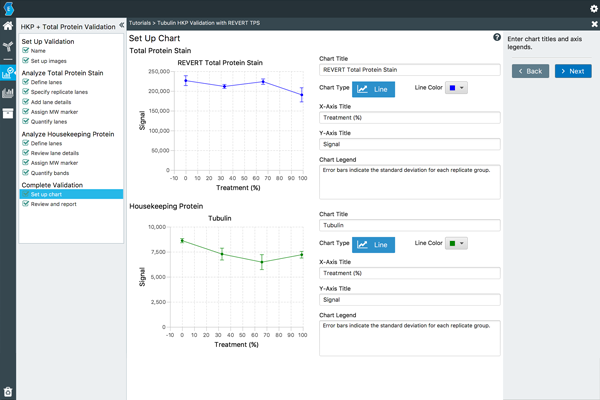
When using a housekeeping protein as an internal loading control, it is important to ensure that its expression is not altered by conditions in the experiment. Use the Housekeeping Protein Validation workflow for verification.
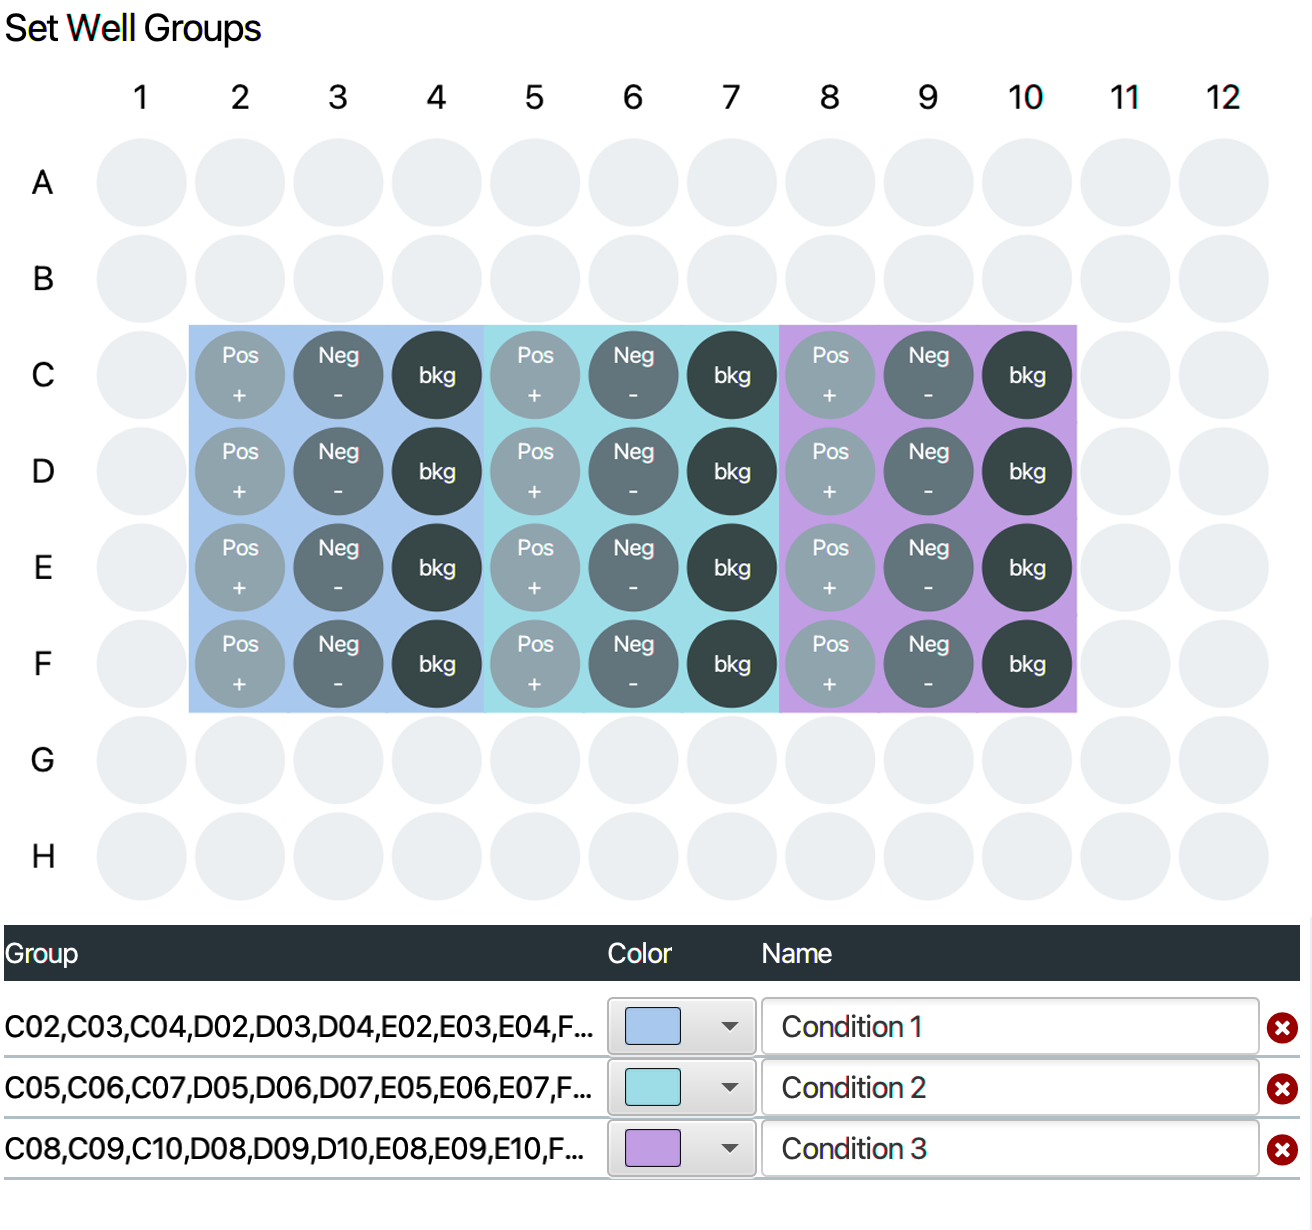
Plan experiments and analyze results correctly—every time.
Create plate templates to plan the experimental layout of your multiwell plate assays, such as In-Cell Western Assays or ELISAs. Then print the template and place it under your plate to see exactly which wells to load with controls, background, and treatments.
By using the same template to load your wells and analyze images, you can track experimental details and achieve reliable results by ensuring well loading and analysis are consistent.
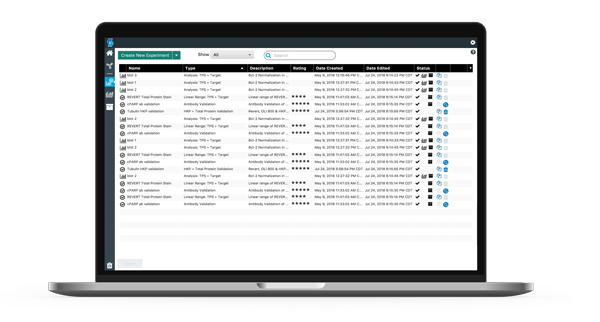
Easily analyze and organize images using Projects.
Project-based organization preserves the integrity of your data by keeping all the parts of your experiments together. Experiment files contain all images, analysis details, and quantification data.
This approach makes quickly finding and sharing experimental data and related analysis easy and transparent.

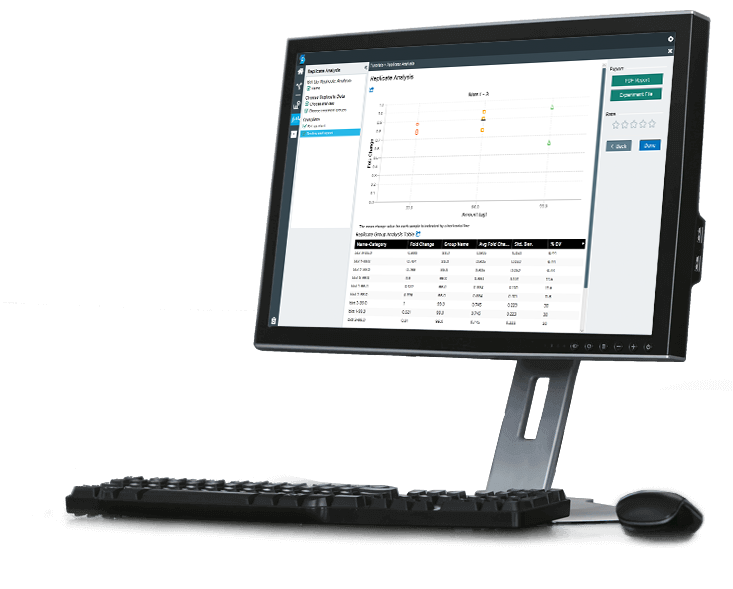
Compare replicates to clearly demonstrate the significance of your data.
Compare replicates to determine fold change, percent change, standard deviation, and other statistics. This makes it simple to consolidate the data you care about in a single software package—without the uncertainty and hassle of formulas and spreadsheets.

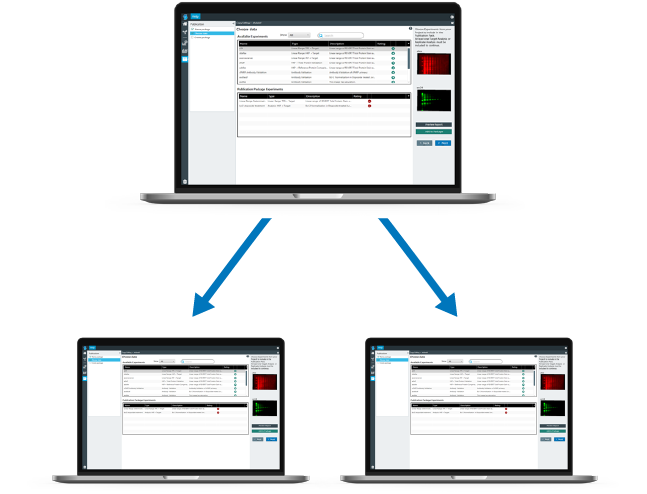
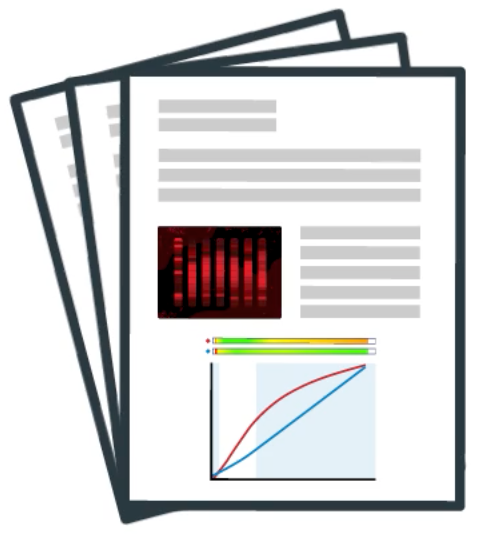
Streamline file and data sharing among colleagues, labs, and publishers.
Empiria Studio makes it simple to share all your images, supporting data, and target analysis data in just one file.
Save money on Empiria Studio when you buy a license for yourself or your whole lab.
License Terms
Reviewer and Editorial Licenses
If you are currently a reviewer or part of the editorial staff at a scientific journal, contact us to get your free license.
| Empiria Studio Software | Price | Purchasing | ||||
|---|---|---|---|---|---|---|
| 9141-500 | 1 User License | $305.00 | 305.00 € | £278.00 | Order Online | |
| 9141-505E | 5 User Licenses | $1,148.00 | 1.148,00 € | £1,044.00 | Contact Us | |
| 9141-507E | 10 User Licenses | $1,913.00 | 1.913,00 € | £1,740.00 | Contact Us | |
| 9141-510E | 25 User Licenses | $3,825.00 | 3.825,00 € | £3,479.00 | Contact Us | |
Empiria Studio requires a minimum of 8 GB of RAM. 64-bit versions of Windows 10 and Windows 11 are supported. macOS Ventura and Sonoma are supported on both Intel and Apple Silicon processors.