Data file structure
After a data file is exported from the computer software as a tab-delimited or comma-delimited text file, it can be imported into a spreadsheet application. Data are organized into groups as indicated in the first row. The second row contains the data label, and the third row contains additional information such as unit, format, or equation.
The fluorometer, leaf angle, and GPS groups will be absent from the data files of previous LI-600 models without those features.
Groups, variables and units
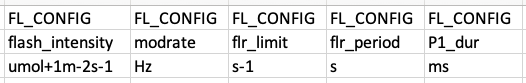
To view a variable's unit of measure or format, see the third row of the data table as imported into a spreadsheet application. The example below shows information in the fluorometer configuration group.
Groups, labels and descriptions
Following is a list of groups and labels in each data file, and the description for each label. See Flash files for information on flash files. The tables are organized as follows.
| Group | |
|---|---|
| label | Description |
System
The System group consists of five parameters for each measurement. Time and Date are set manually in Settings or synced from GPS (recommended) on the device. See Settings and Clocks.
| SYS | |
|---|---|
| Obs# | Observation/record number |
| Time | Time of observation: HHMMSS |
| Date | YYYYMMDD |
| configName | Configuration name |
| configAuthor | Configuration author |
User Defined
The User Defined group contains the remarks and labels created in Configuration Management in the computer software. See Remarks and Data Labels for configuring them. See Taking a measurement for adding them to measurements. At least one label must be formatted as a barcode to enable the barcode scanner.
| USERDEF | |
|---|---|
| remark | Mark reason -alphanumeric |
| barcode | Label 1 barcode, list, or number |
| Label 2 barcode, list, or number | |
| Label 3 barcode, list, or number | |
Porometry
The Porometry Group contains the data collected from the LI-600 porometer.
| PORO | |
|---|---|
| gsw | Stomatal conductance |
| gbw | One-sided boundary layer conductance |
| gtw | Total conductance |
| E_apparent | Transpiration |
| VPcham | Chamber vapor pressure |
| VPref | Reference vapor pressure |
| VPleaf | Leaf vapor pressure |
| VPDleaf | Vapor pressure deficit |
| H2O_r | Reference H2O mole fraction |
| H2O_s | Chamber H2O mole fraction |
| H2O_leaf | Leaf H2O mole fraction |
| leaf_area | Leaf area in cm2 |
| leaf_width | Leaf width in mm |
Fluorometry
The Fluorometry Group contains the data collected from the LI-600 Fluorometer.
| FLUORO | |
|---|---|
| flashID | Flash file ID |
| Fo | Minimum fluorescence in dark |
| Fm | Maximum fluorescence in dark |
| Fv/Fm | Quantum efficiency in dark |
| Fs | Minimum fluorescence in light |
| Fm' | Maximum fluorescence in light |
| PhiPS2 | Quantum efficiency in light |
| PS2/1 | Ratio of PSII to PSII absorptance |
| abs | Leaf light absorptance |
| ETR | Electron transport rate |
| TRANS | Transmission factor |
Sensor
The Sensor group contains the values recorded by the relative humidity, temperature, flow, pressure, and PAR sensors as well as the battery voltage. The output in the SENSOR group is calculated from the SENSOR_V and calibration coefficients determined at the factory.
| SENSOR | |
|---|---|
| rh_s | Sample relative humidity |
| rh_r | Reference relative humidity |
| Tref | Block reference temperature |
| Tmeas | IRT leaf (sample) temperature |
| Tleaf | Calculated leaf temperature |
| P_atm | Atmospheric pressure |
| flow | Flow rate to cuvette |
| flow_s | Exhaust flow leaving cuvette |
| leak_pct | Flow percent leak |
| Qamb | Ambient light |
| batt | Battery voltage |
Leaf angle
The leaf angle group contains measurements from the magnetometer, accelerometer, GPS, and calculated variables. See Leaf angle and GPS. This group will not be included in data files from instruments without an accelerometer/magnetometer.
| LEAF_ANGLE | |
|---|---|
| pitch | Slope from horizontal |
| roll | Rotation from horizontal |
| heading | Rotation from North |
| angle_inc_leaf | Angle of incidence between the leaf and the sun |
| direct_pct | Proportion of direct irradiance incident on leaf |
| slope_leaf | Leaf inclination from horizontal |
| az_leaf | Leaf rotation from south |
| dec_solar | Angular position of sun with respect to equator |
| az_solar | Solar rotation |
| zenith_solar | Solar zenith angle |
GPS
The GPS group contains the GPS coordinates, altitude, number of satellites, and horizontal dilution of precision. For important information about GPS time, see Clocks. This group will not be included in data files from instruments without a GPS receiver.
| GPS | |
|---|---|
| gps_time | YYYYMMDD |
| gps_date | HHMMSS |
| latitude | Latitude |
| longitude | Longitude |
| altitude | Altitude (meters) |
| gps_sats | Number of GPS satellites |
| gps_HDOP | GPS horizontal dilution of precision |
Match
The Match group records the time and date of the RH sensor matching and the sensor correction. See Measurement Settings, and Taking a measurement
| MATCH | |
|---|---|
| match_time | Match time |
| match_date | Match date |
| rh_adj | Relative humidity sensor correction |
| type | Valved (0) or serial (1) match |
Stability
The Stability group records the measurement stability of stomatal conductance(gsw), slope, and fluorescence (flr) at 1, 2, and 4 seconds. See Taking a measurement, step 6.
| STABILITY | |
|---|---|
| gsw1sec | Stomatal conductance at 1 sec |
| gsw2sec | Stomatal conductance at 2 sec |
| gsw4sec | Stomatal conductance at 4 sec |
| flr1sec | Slope and fluorescence at 1 sec |
| flr2sec | Slope and fluorescence at 2 sec |
| flr4sec | Slope and fluorescence at 4 sec |
Porometer configuration
See Measurement Settings.
| P_CONFIG | |
|---|---|
| auto | Auto mode (0 for LI-600N) |
| flow_set | Flow set point |
| gsw_limit | gsw slope limit |
| gsw_period | gsw period |
| aw | Area to width conversion factor |
| Bla | Boundary layer coefficient a |
| Blb | Boundary layer coefficient b |
| Blc | Boundary layer coefficient c |
| Bld | Boundary layer coefficient d |
| Ble | Boundary layer coefficient e |
| chamber | Standard (0) or Needle (1) |
Fluorometer configuration
See Measurement Settings.
| FL_CONFIG | |
|---|---|
| dark | Dark adapted or not |
| flash_type | Flash type |
| flash_intensity | Flash intensity |
| modrate | Modulation rate |
| flr_limit | Flr slope limit |
| flr_period | Flr period |
| P1_dur | MPF phase 1 duration |
| P2_dur | MPF phase 2 duration |
| P3_dur | MPF phase 3 duration |
| P1_Fmax | Phase 1 maximum fluorescence |
| P2_ramp | Phase 2 ramp depth |
| P2_slp | Phase 2 regression slope |
| P3_Fmax | Phase 3 maximum fluorescence |
| P3_Pred | Phase 3 predicted fluorescence |
| P3_DeltaF | Phase 3 measured–phase 3 predicted |
Sensor voltage
The Sensor Voltage group reports the voltage for each of the sensors. The output in the SENSOR group is calculated from the SENSOR_V values and calibration coefficients determined at the factory.
| SENSOR_V | |
|---|---|
| v_humA | Reference RH sensor (poro) |
| v_humB | Sample RH sensor (poro) |
| v_flowIn | Inlet flow sensor (poro) |
| v_flowOut | Outlet flow sensor (poro) |
| v_temp | Thermistor (poro) |
| v_irt | IRT target temperature (poro) |
| v_pres | Pressure sensor (poro) |
| v_par | Quantum sensor (poro) |
| v_F | De-modulated fluorescence (fluoro) |
| i_LED | LED current (optional) (fluoro) |
User calibrations
See Calibrating the sensors, and Drop-down menu.
| USERCAL | |
|---|---|
| b_rhr | Ref RH sensor zero intercept (poro) |
| m_rhr | Ref RH sensor slope (poro) |
| span_rhr | Ref RH sensor span (poro) |
| b_rhs | Sam RH sensor zero intercept (poro) |
| m_rhs | Sam RH sensor zero slope (poro) |
| span_rhs | Sam RH sensor span (poro) |
| z_flowIn | Flow in zero (poro) |
| z_flowOut | Flow out zero (poro) |
| z_quantum | Quantum sensor zero (poro) |
| z_flr | Fluor zero (optional) (fluor) |
Metadata
The metadata for each measurement includes instrument and sensor serial numbers, embedded firmware version, and when the configuration was last updated. Metadata for each data file can be viewed in the LI-600 computer software. See Local Files.
| META | |
|---|---|
| flashId | Flash ID (fluoro) |
| lciSerNum | Instrument serial# |
| lcpSerNum | Porometer serial# |
| lcfSerNum | Fluorometer serial# |
| lcrhSerNum | RH sensor serial number |
| version | Embedded version |
| configUpdatedAt | Configuration update date |
Flash files
Flash files are fluorometer data files. If a data file contains fluorometer measurements, a flash file for each measurement is downloaded and included in the .zip file exported from the computer software. See Measurement Settings.
| Flash Files | |
|---|---|
| flashId | Flash file ID |
| time | HHMMSS |
| date | YYYYMMDD |
| lciSerialNumber | Instrument serial# |
| lcpSerialNumber | Porometer serial# |
| lcfSerialNumber | Fluorometer serial# |
| Fm | Fm |
| Fo | Fo |
| Fv/Fm | Fv/Fm |
| Fm' | Fm' |
| Fs | Fs |
| PhiPS2 | ΦPSII |
| LightIntensity | Light intensity |