Display
The Display panel allows you to edit the parameters that display the selected image in the image view. The Display panel has individual sections for each channel available on a given acquisition. This example shows the 700 channel in red and the 800 channel in green.
Features
Click the Features at the top left corner of the Display panel to toggle between displaying and hiding all features on the image. Features include Bands, Lanes, Wells, Spots, Annotations, and more. Select specific features to display or hide on the Show group in each Analysis tab.
Brightness and Contrast
You can adjust the display with the Brightness and Contrast sliders. Drag a slider to adjust the display.
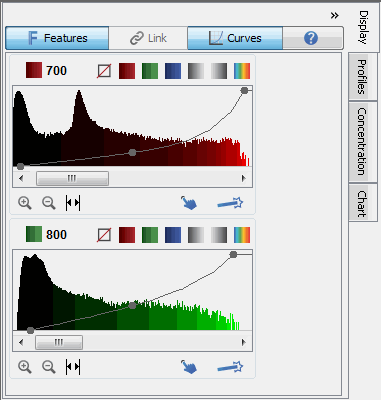
You can also adjust the display using curves on a histogram. Click Curves on the top of the Display panel to open the Curves tab.
You can also click the arrow (>) in the Display group on the Image tab to open a dialog and choose Curves to view the Curves for this image. Select Brightness/Contrast to view the Brightness and Contrast sliders again.
Curves
The x-axis of each panel represents the raw pixel values. Each panel has a bar graph displaying a histogram of number of pixels with each raw value. The higher the bar at a given location on the x-axis, the more pixels that contain that particular intensity value. This histogram is shaded with the color map in use for that channel. Also shown in each panel is an adjustable curve that maps raw data to displayed data.
The adjustable curve overlaying each histogram represents how the raw data maps to the displayed data. Adjust any of the three dots on the line (Max, Min, or K Value) to optimize the displayed image.To view the numbers hover the mouse over one of the three dots in the line. The Max and Min numbers are displayed. The middle one also shows the K value, which is used to smoothly change between linear (K=0) and logarithmic (K=1) mappings of the data onto the color maps.
- Moving the Max Point to the left is similar to increasing the Contrast value in the Odyssey software. As more of the intensity values are mapped to the brightest display values, the bands become brighter.
- Moving the Min Point to the right shades more of the lower intensity values to lower display values, creating a visually cleaner background.
- Increasing the K value reduces the contrast between the higher and lower intensity values, so less intense bands appear brighter while very bright bands are avoided.
Adjusting the Parameters
You can adjust each channel’s display parameters independently.
 Use the Channel label to cycle through channel
views. Press once to show the single channel. Press again to show the
other channels.
Use the Channel label to cycle through channel
views. Press once to show the single channel. Press again to show the
other channels. -
 Use the disable button to disable (gray
out) the channel. This is necessary when you are adding shapes.
Use the disable button to disable (gray
out) the channel. This is necessary when you are adding shapes. -


 Use the color buttons
to change the channel’s display color.
Use the color buttons
to change the channel’s display color. 
 Use
the gray scale buttons to display the channel in gray scale. This is useful
for displaying the image for reports that will be published.
Use
the gray scale buttons to display the channel in gray scale. This is useful
for displaying the image for reports that will be published. 
 Use
the zoom buttons to zoom in on the range of pixel values for the channel.
Use
the zoom buttons to zoom in on the range of pixel values for the channel. Use the expand button to show the full histogram
in full zoomed out view. Use the zoom in button to zoom back incrementally
or the automatic button to zoom in all the way.
Use the expand button to show the full histogram
in full zoomed out view. Use the zoom in button to zoom back incrementally
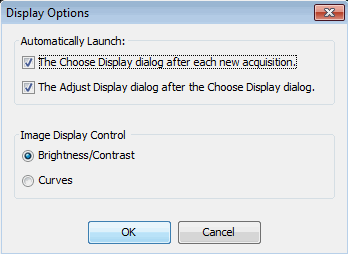
or the automatic button to zoom in all the way.  Use the Choose Display button to select the best display from six choices. See Choose Display for more information.
 Use the Adjust Display button to open a dialog to help you set the min and max points of the display mapping. See Adjust Display for more information.
The Choose Display and Adjust Display dialogs automatically open after a scan for each channel acquired. Click the arrow (>) in the Display group to open the Display Options dialog and remove the check marks to disable this feature.
Link Image Display Values
Click Link at the top of the Display panel to force all images currently in the filtered Images Table to have the same Image Display values as those applied to the display of the selected image. When the Image Display values are linked, any changes that you make to the Curves or Brightness/Contrast sliders affect all the images in the filtered view regardless of the image view mode (single image or multi-image mode).
The Link button is only enabled after a filter has been defined and applied to the Images table. It is unavailable if no filter has been applied.
The Image Display values will differ depending on the instrument and acquisition settings used. Linking the Image Display values of images from different instruments, or from the same instrument with different acquisition settings, will not provide accurate comparisons.
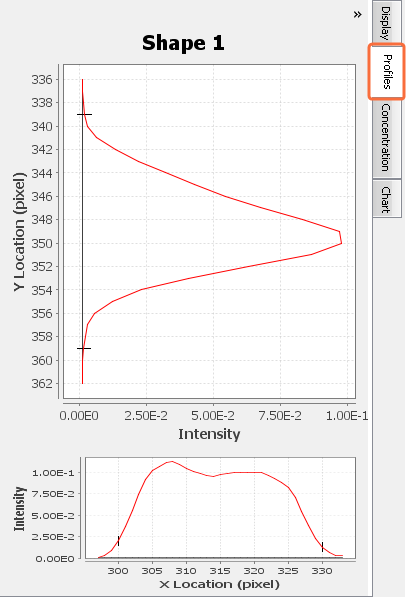
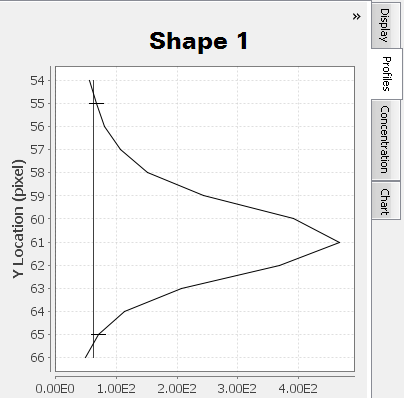
Profiles
The Profiles tab displays a graph of Pixel Intensity vs Location for a selected shape or lane. This graph can be helpful to visually correlate band brightness with pixel intensity peaks.
The Profiles tab can be used to:
- See if a shape overlaps multiple bands
- Inspect the pixel intensity profile throughout a lane
- Select the shape or lane in the image.
Click the Profiles tab on the right side of the Image Studio Software window.
The Profiles tab will open to show a graph with Pixel Intensity on the x-axis and pixel Position on the y-axis.
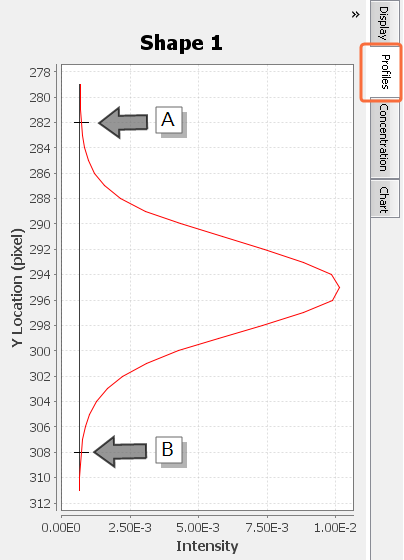
Using the Profiles Tab To See If a Shape Overlaps Multiple Bands
Only one peak should appear in the shape profile if only one band is enclosed by the shape and the shape's background border.
In
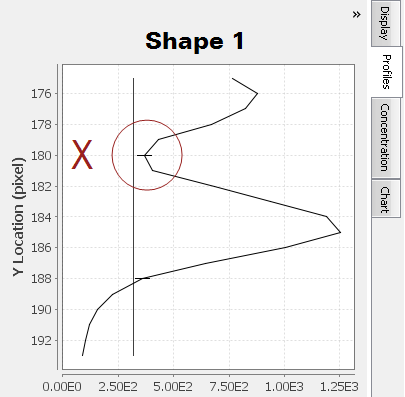
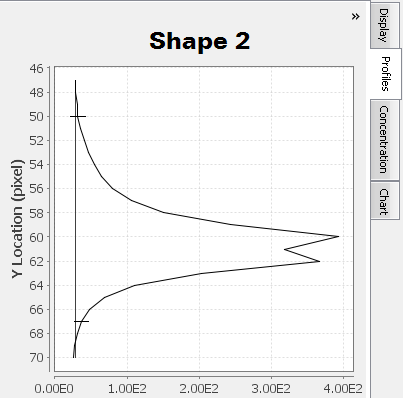

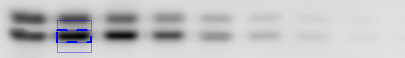

Multiple "humps" may exist at the top of a peak . Carefully examine the Profiles tab in conjunction with the background border surrounding the shape to ensure multiple "humps" are from the same band and not different bands. For Shape 2, a less dense area inside the band is causing two peaks to appear in the Profiles tab.
Using the Profiles Tab to Inspect a Lane Profile
When a lane from a Western or MPX™ Western analysis is selected, the pixel intensity profile throughout the lane can be seen in the Profiles tab.
If Image Studio Lane is selected as the background subtraction method in the Define Type list ![]() , a line representing lane background can be displayed beneath the lane profile
, a line representing lane background can be displayed beneath the lane profile
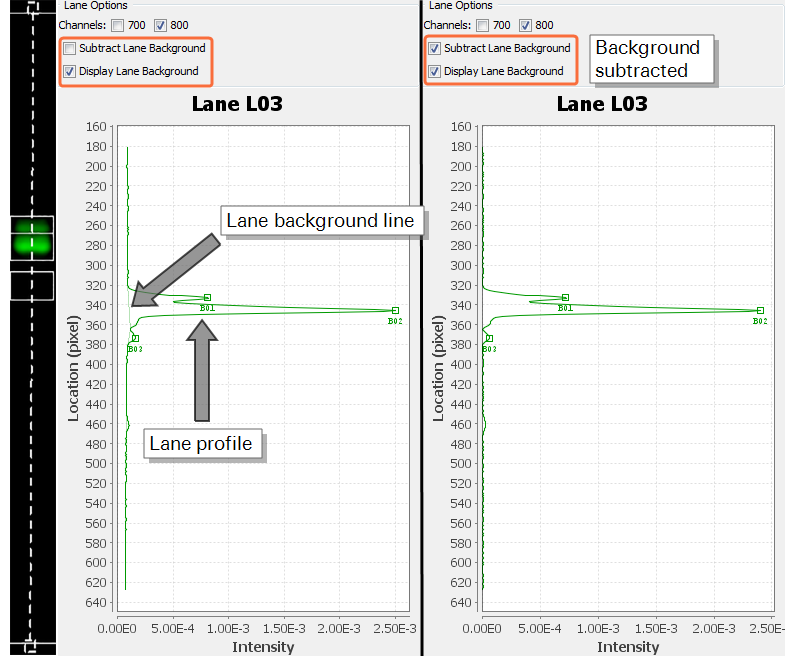
- To display the lane background line, select the Display Lane Background check box and a light colored line representing the background will appear beneath the original lane profile.
- To display the lane profile with background subtracted, select the Subtract Lane Background check box and the graph will be redrawn with lane background subtracted. The signal has already been calculated with the background subtracted, even if Subtract Lane Background has not been selected.
Concentration
Use this option to assign features as concentration standards that will be used to calculate unknown concentrations of other features.
A relationship between concentration standards (added to a table) and a measured quantification value (chosen in the Concentration panel) will be determined and used to assess unknown concentrations.
To assign concentration standards and determine unknown concentrations:
Click the Concentration tab at the right side of the window to display the Concentration panel.
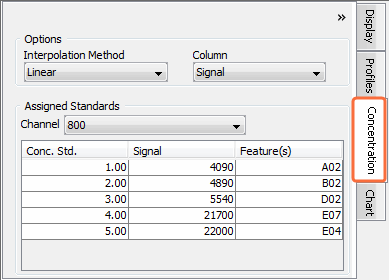 Choose the desired interpolation method, quantification value, and channel in the Concentration panel...
Interpolation Method list - Choose the interpolation type used to calculate a relationship between the concentration standard values you enter and the measured signal.
Linear - A linear relationship, y = mx + b, will be determined between the entered concentration standards and the quantification value chosen in the Column list, then used to calculate unknown concentrations.
Log - A logarithmic relationship, y = ln(x), will be determined between the entered concentration standards and the quantification value chosen in the Column list, then used to calculate unknown concentrations.
Reciprocal fit - An inverse relationship, y = 1/x, will be determined between the entered concentration standards and the quantification value chosen in the Column list, then used to calculate unknown concentrations.
Exponential - An exponential relationship, y = x^n, will be determined between the entered concentration standards and the quantification value chosen in the Column list, then used to calculate unknown concentrations.
- Column - Choose the quantification value that Image Studio Software will use to determine the relationship between entered concentration standards and measured signal. Reference for more detail about each quantification value. This value will appear in the Chart panel table next to the concentration standard values.
- Channel - Choose the channel that contains the concentration standards you would like to appear in the Chart panel table next to the concentration value.
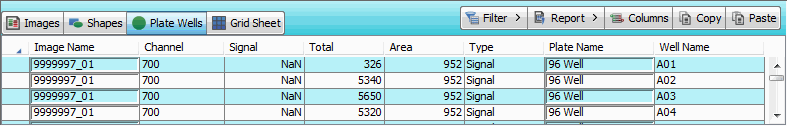
Click the tab at the top of the Table section to open the table with the features to be assigned as Concentration Standards. In the example below, the Plate Wells table is selected.
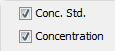
- Add the Conc. Std. and Concentration columns to the table...
- Click Columns
 at the top right of the Table section to open the Columns dialog.
 Check the boxes next to Conc. Std. and Concentration.
Click Save.
The Conc. Std. and Concentration columns will be added to the far right of the table.
- Click Columns
- Click a concentration standard feature or select its row in the table.
Double click the Conc. Std. field in the selected row.
Enter the concentration value for this feature.
The assigned concentration standard will appear in the Concentration panel table.
Ensure the values of the entered standards increase or decrease consistently with the quantification value chosen in the Concentration panel.
- Repeat steps 4 through 6 to add all of the concentration standards to the list.
- The calculated concentrations for the other features appear in the table in the Concentration column.
Concentration standards can only be added to one channel at a time. Check that the highlighted row is in the correct channel.
Chart
Click the Chart tab on the right side of the application window to open the Chart panel.
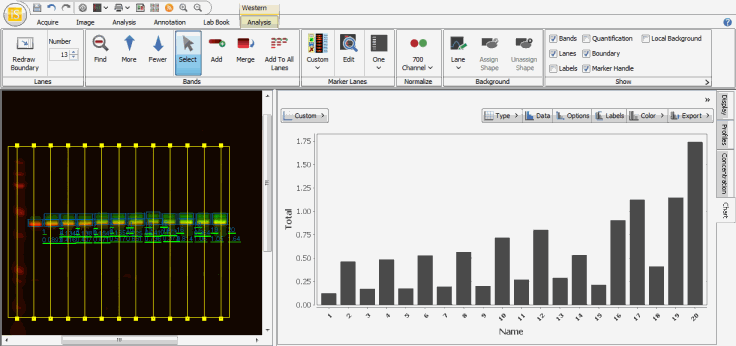
Chart Template
Click the Chart Template button on the top left of the Chart panel to select an available chart template. You can also save the current settings as a template or delete a template.
Type
Click Type on the top right of the Chart panel to select either a bar chart or scatter plot.
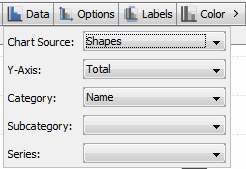
Data
Click the Data on the top right of the Chart panel to select the data for the chart.
Options
Click Options on the top right of the Chart panel to select from the choices listed.
Labels
Click Labels on the top right of the Chart panel to enter labels in the text fields for the chart.
Color
Click Color on the top right of the Chart panel to choose a color scheme for the chart.
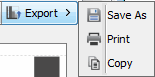
Export
Click Export on the top right of the Chart panel and select Save As, Print, or Copy.