IRDye 800CW dye is characterized by high water solubility and salt tolerance, low non-specific binding to cellular components, and a high signal-to-noise ratio.
IRDye 800CW dye-conjugated agents and probes are currently propelling more than a dozen Phase I or Phase II clinical trials, more than any other near-infrared fluorescent dye.
Click Chemistry utilizes pairs of reagents that exclusively react with each other and are effectively inert to naturally occurring functional groups such as amines. LI-COR offers IRDye 800CW DBCO, azide, and alkyne for click chemistry applications.
IRDye 800CW NHS ester is available in labeling kits so that you can label your own compounds for assay or probe development.
IRDye 800CW dye-conjugated forms are available from LI-COR, including:
Optical imaging agents, including dye-labeled2-DG, EGF, RGD, BoneTag™, and PEG Fluorescent Contrast Agent
IRDye 800CW Dyes and Conjugates Used in Various Applications
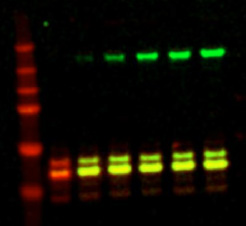
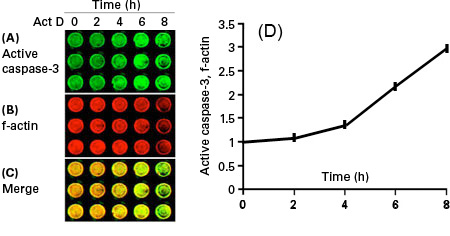
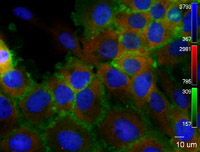
Example of a Multiplex Western Blot. Lysates of EGF-treated A431 cells were separated and transferred to nitrocellulose. The blot was probed with anti-ERK and anti-phospho-ERK primary antibodies, and then detected with IRDye 680LT and IRDye 800CW secondary antibodies. Blot was imaged with Odyssey® Fc System for 2 minutes. This phospho-ERK antibody cross-reacts with phospho-EGFR (upper green band).Time course of caspase-3 activation in S2 cells. A-C: In-Cell Western analysis of S2 cells treated with actinomycin D (Act D) to induce apoptosis. Each time point was measured in triplicate and stained for anti-active-caspase-3 (A; green) and f-actin (B; red, stained with near-infrared fluorescent phalloidin). Panel C shows merged pseudocolor images. D: Active-caspase-3 protein levels from (A) were quantified and normalized to f-actin levels in (B) for each time point. The active caspase-3:f-actin ratio at 0min Actinomycin D exposure was designated as 1, and all other ratios are shown relative to this value. Error bars represent the standard error of each independent measurement. Exposure of S2 cells to Actinomycin D increased the relative levels of active caspase-3 over time. Reprinted with permission from Bond, D.et al. (2008) Biol Proced Online. 10(1):20-28.Deconvolved image of A431 cells. pEGFR was detected with appropriate primary antibody and IRDye 800CW goat anti-rabbit polyclonal (P/N 926-32211), represented in green. Total ERK was detected with appropriate primary antibody and IRDye 680 goat anti-mouse polyclonal (P/N 926-32220) represented in red. Cell nuclei were detected with Sytox Green (Invitrogen), represented in blue. Image captured using an Olympus IX71/IX81 microscope.